本文說明如何使用 Google Cloud Managed Service for Prometheus,針對直方圖指標擷取 Prometheus 範例。您必須使用下列其中一種方式:
- Managed Service for Prometheus 代管收集作業版本 0.7.0 以上
- Managed Service for Prometheus 自行部署的收集版本 2.35.0-gmp.5-gke.0 以上
- OpenTelemetry 收集器
範例通常用於將追蹤 ID 與在一段時間間隔內收集的指標資料建立關聯,但也可以用於將任何非指標資料與收集的指標建立關聯。將追蹤資訊與指標資料一併儲存,您就能快速找出與指標值突然變化相關的追蹤記錄,不必使用時間戳記手動交叉比對追蹤資訊和指標資料,找出應用程式在記錄指標資料時發生的情形。
Managed Service for Prometheus 範例與 Cloud Trace 和第三方追蹤工具 (例如 Grafana Tempo) 相容。
以下螢幕截圖顯示 Grafana 圖表,其中包含一系列直方圖值區和相關範例,其中一個範例已展開:
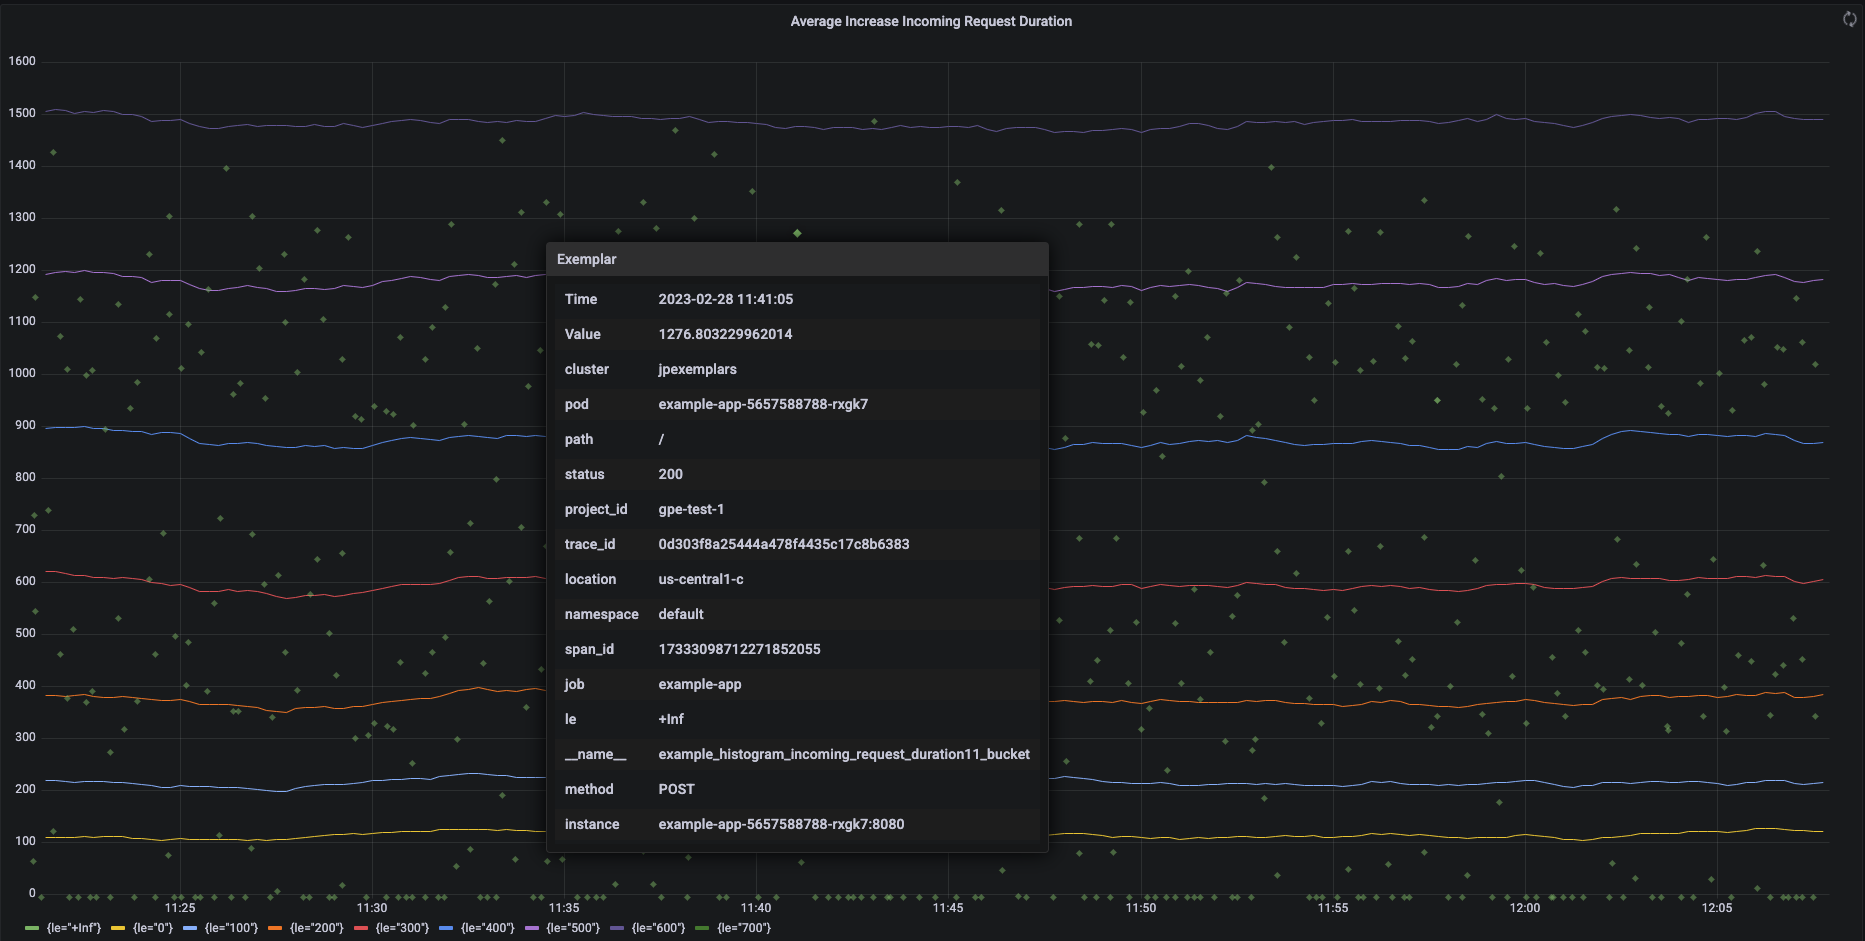
Managed Service for Prometheus 中的 Prometheus 範例
您可以使用 OpenMetrics 公開格式,在 Prometheus 中支援範例。OpenMetrics 範例的結構如下:
- 範例的值:必須是整數或 64 位元浮點值。
- (選用) 時間戳記:必須是 Unix Epoch 秒,可為負值。
- 範例的標籤數量,通常包括
trace_id和span_id值;所有標籤名稱和值的總長度不得超過 128 個 UTF-8 字元,或 Go 應用程式中的 128 個 rune。
Google Cloud Managed Service for Prometheus 只能擷取附加至直方圖指標的範例。無法擷取連結至計數器指標的範例。Prometheus 直方圖指標會轉換為類似的 Cloud Monitoring Distribution 類型,後者支援範例。Cloud Monitoring 中的非發布指標不支援範例。
您可以查詢示例,但只能查詢 24 個月內的資料。請將這個保留期限與上游 Prometheus 進行比較,後者只會在資料在記憶體中時保留範例,通常少於 14 天。Managed Service for Prometheus 會將範例儲存至時間序列,因此範例會根據時間序列的保留政策保留。如要進一步瞭解 Cloud Monitoring 中的資料保留設定,請參閱「資料保留」一文。
啟用取樣值擷取功能
如果您使用 Managed Service for Prometheus 搭配 managed collection 0.7.0 以上版本,系統會自動啟用示例攝取功能。
如果您使用 Managed Service for Prometheus 搭配自行部署的收集功能,則必須在啟動伺服器時啟用取樣值攝取功能,方法是指定下列功能旗標:
--enable-feature=exemplar-storage
使用範例編寫指標
每個 Prometheus 用戶端都有自己的操作說明,可在該用戶端中正確使用範例。請按照下列操作說明,讓應用程式以 OpenMetrics 格式公開指標,方便 Prometheus 從應用程式的 /metrics 端點擷取資料。如需範例,請參閱以下內容:
- OpenTelemetry Java 範例
- Prometheus Java 用戶端
- Prometheus Python 用戶端
- Prometheus Go 用戶端
與 Cloud Trace 整合
您可以使用與 Cloud Trace 相容的範例,編寫 Prometheus 直方圖。您可以在 Cloud Monitoring 熱力圖表上顯示資料 (包括範例),並透過範例查看相關追蹤範圍的詳細資料。您也可以在 Trace 中分析追蹤記錄資料。詳情請參閱「在熱力圖表中顯示示例」。
如要建立與 Trace 相容的範例,Prometheus 範例必須包含下列標籤:
project_idtrace_idspan_id
如果範例包含這三個標籤,系統就會使用這些標籤建立與 Trace 相容的 SpanContext 物件,並附加至為 Cloud Monitoring Distribution 儲存桶建立的範例。
除了組成完整 SpanContext 的標籤外,所有標籤都會加入 Distribution 值區範例所附加的 DroppedLabels 物件。
使用範例查詢指標
Prometheus API 會公開 api/v1/query_exemplars 端點,用於查詢範例。
設定用於與 Google Cloud Managed Service for Prometheus 互動的查詢介面時,系統會自動納入範例查詢。如要瞭解如何設定查詢介面,請參閱「使用 Grafana 進行查詢」或「使用 Prometheus API 或 UI 進行查詢」。