本文档介绍如何使用 Google Cloud Managed Service for Prometheus 来注入有关直方图指标的 Prometheus 范例。您必须使用以下其中一项:
- Managed Service for Prometheus 托管式收集 0.7.0 版或更高版本
- Managed Service for Prometheus 自部署收集 2.35.0-gmp.5-gke.0 版或更高版本
- OpenTelemetry 收集器
范例通常可用于将跟踪记录标识符与在特定时间间隔内收集的指标数据相关联,但可用于将任何非指标数据与收集的指标相关联。将跟踪记录信息存储在指标数据中后,您可以快速识别与指标值突然变化相关的跟踪记录;您不必使用时间戳来标识记录指标数据时应用中发生的情况以手动交叉引用跟踪记录信息和指标数据。
Managed Service for Prometheus 范例与 Cloud Trace 以及第三方跟踪工具(如 Grafana Tempo)都兼容。
以下屏幕截图显示了一组直方图范围和相关范例的 Grafana 图表,其中展开了一个范例:
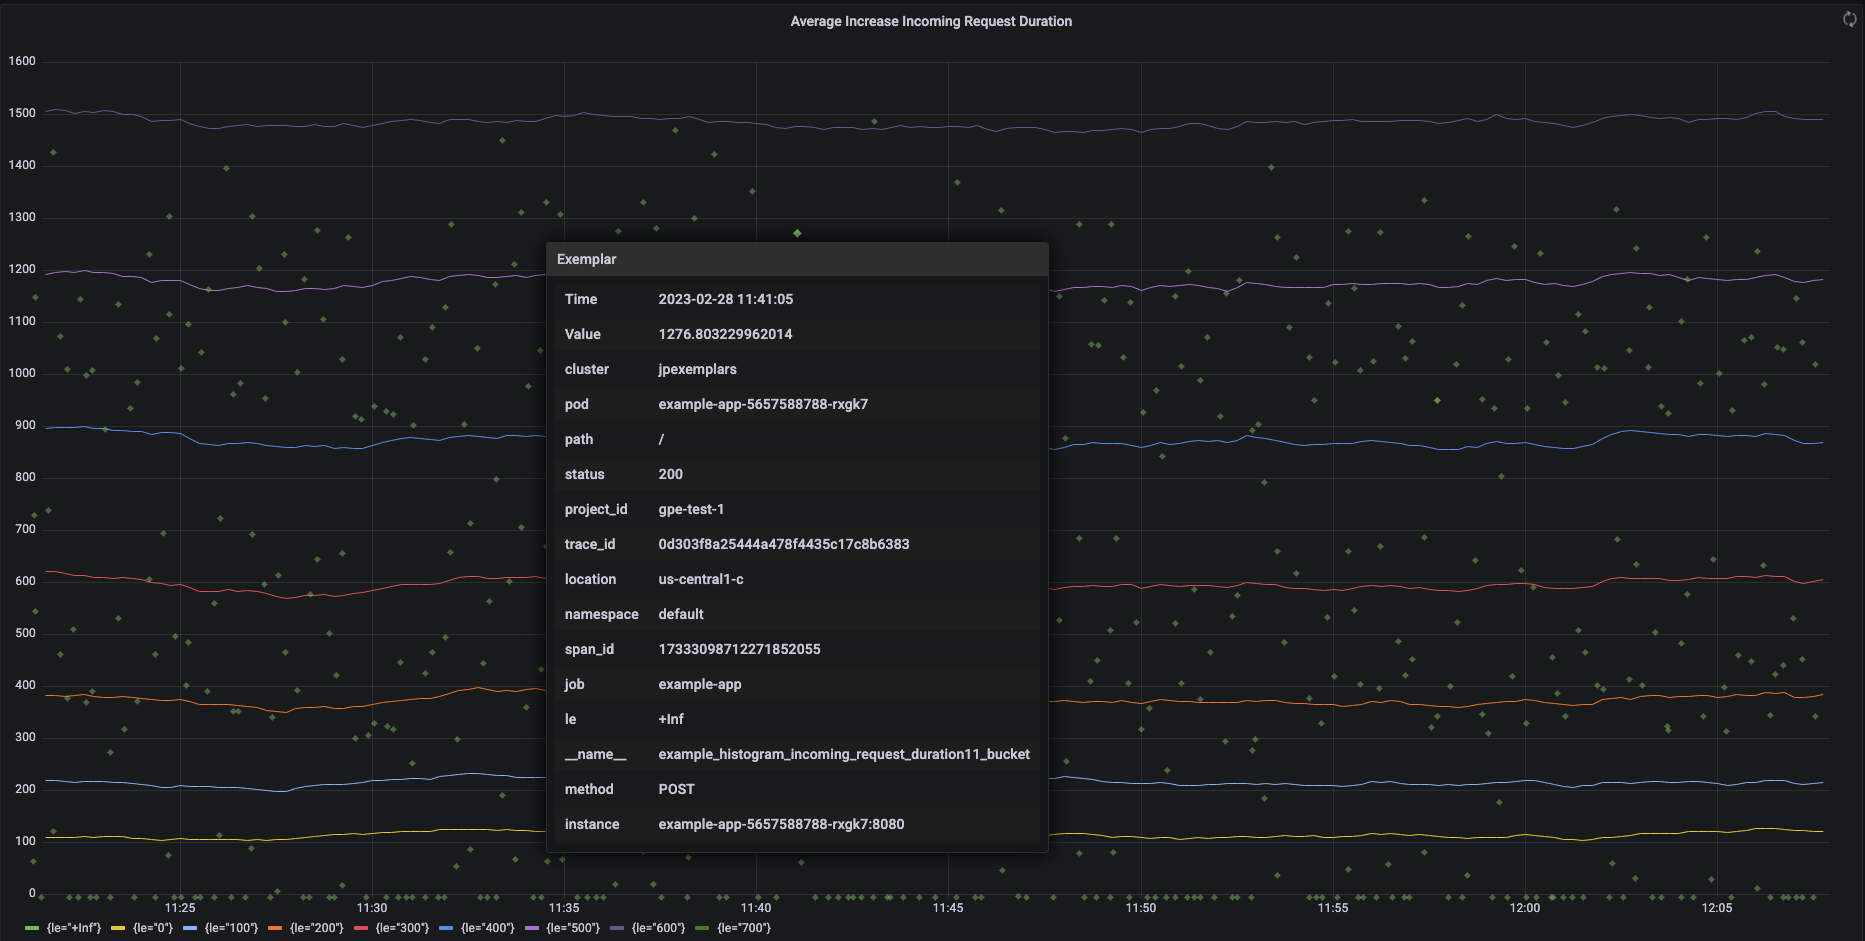
Managed Service for Prometheus 中的 Prometheus 范例
Prometheus 中使用 OpenMetrics 公开格式来支持范例。OpenMetrics 范例的结构如下:
- 范例的值:必须是整数或 64 位浮点数。
- (可选)时间戳:必须是 Unix 时间戳秒数,可以是负数。
- 范例的多个标签,通常包括
trace_id和span_id值;在 Go 应用中,所有标签名称和值的总长度不得超过 128 个 UTF-8 字符,或者不得超过 128 个符文。
Google Cloud Managed Service for Prometheus 只能注入附加到直方图指标的范例。无法注入附加到计数器指标的范例。Prometheus 直方图指标会转换为类似的 Cloud Monitoring Distribution 类型,该类型支持范例。Cloud Monitoring 中的非分布指标不支持范例。
范例在 24 个月内均可查询。将此保留期限与上游 Prometheus 进行比较,其中范例仅在数据位于内存中时保留(通常少于 14 天)。Managed Service for Prometheus 将范例与时序一起存储,因此根据时序的保留政策保留范例。如需详细了解 Cloud Monitoring 中的数据保留,请参阅数据保留。
启用范例注入
如果您将 Managed Service for Prometheus 与代管式集合版本 0.7.0 或更高版本搭配使用,则系统会自动启用范例注入。
如果您将 Managed Service for Prometheus 与自部署收集搭配使用,则必须在启动服务器时通过指定以下功能标志来启用范例注入:
--enable-feature=exemplar-storage
使用范例编写指标
每个 Prometheus 客户端都有自己的说明,用于在该客户端中正确使用范例。请按照以下说明操作,以便您的应用以 OpenMetrics 格式公开指标,供 Prometheus 从应用的 /metrics 端点爬取。如需查看示例,请参阅以下内容:
- OpenTelemetry Java 示例
- Prometheus Java 客户端
- Prometheus Python 客户端
- Prometheus Go 客户端
与 Cloud Trace 集成
您可以使用与 Cloud Trace 兼容的范例来编写 Prometheus 直方图。您可以在 Cloud Monitoring 热图图表上显示数据(包括范例),在该图表中,您可以使用范例查看相关跟踪记录 span 的详细信息。您还可以在 Trace 中分析跟踪记录数据。如需了解详情,请参阅在热图图表上显示范例。
如需创建与 Trace 兼容的范例,Prometheus 范例必须包含以下标签:
project_idtrace_idspan_id
如果您的范例包含这三个标签,则这些标签将用于创建一个与 Trace 兼容的 SpanContext 对象,该对象附加到为 Cloud Monitoring Distribution 范围创建的范例。
除构成完整 SpanContext 的标签之外的所有标签都会添加到附加到 Distribution 范围范例的 DroppedLabels 对象中。
使用范例查询指标
Prometheus API 公开了用于查询范例的 api/v1/query_exemplars 端点。
设置为与 Google Cloud Managed Service for Prometheus 交互的查询界面自动包含范例查询。如需了解如何设置查询界面,请参阅使用 Grafana 进行查询或使用 Prometheus API 或界面进行查询。