本文說明如何設定Google Cloud 專案的指標範圍,以便與 Google Cloud Managed Service for Prometheus 搭配使用。
理想的 Managed Service for Prometheus 部署方式與一般 Prometheus 部署方式有別。Prometheus 的範圍僅限於其自身的例項,而這類例項通常是叢集範圍,也就是說,規則和查詢會在收集資料的 Prometheus 伺服器上執行。由於 Managed Service for Prometheus 會將資料傳送至全球後端 Monarch,因此您必須將查詢設為針對 Monarch 執行,而非本機叢集。如果您使用受管理的收集,則規則也必須符合相同規定。
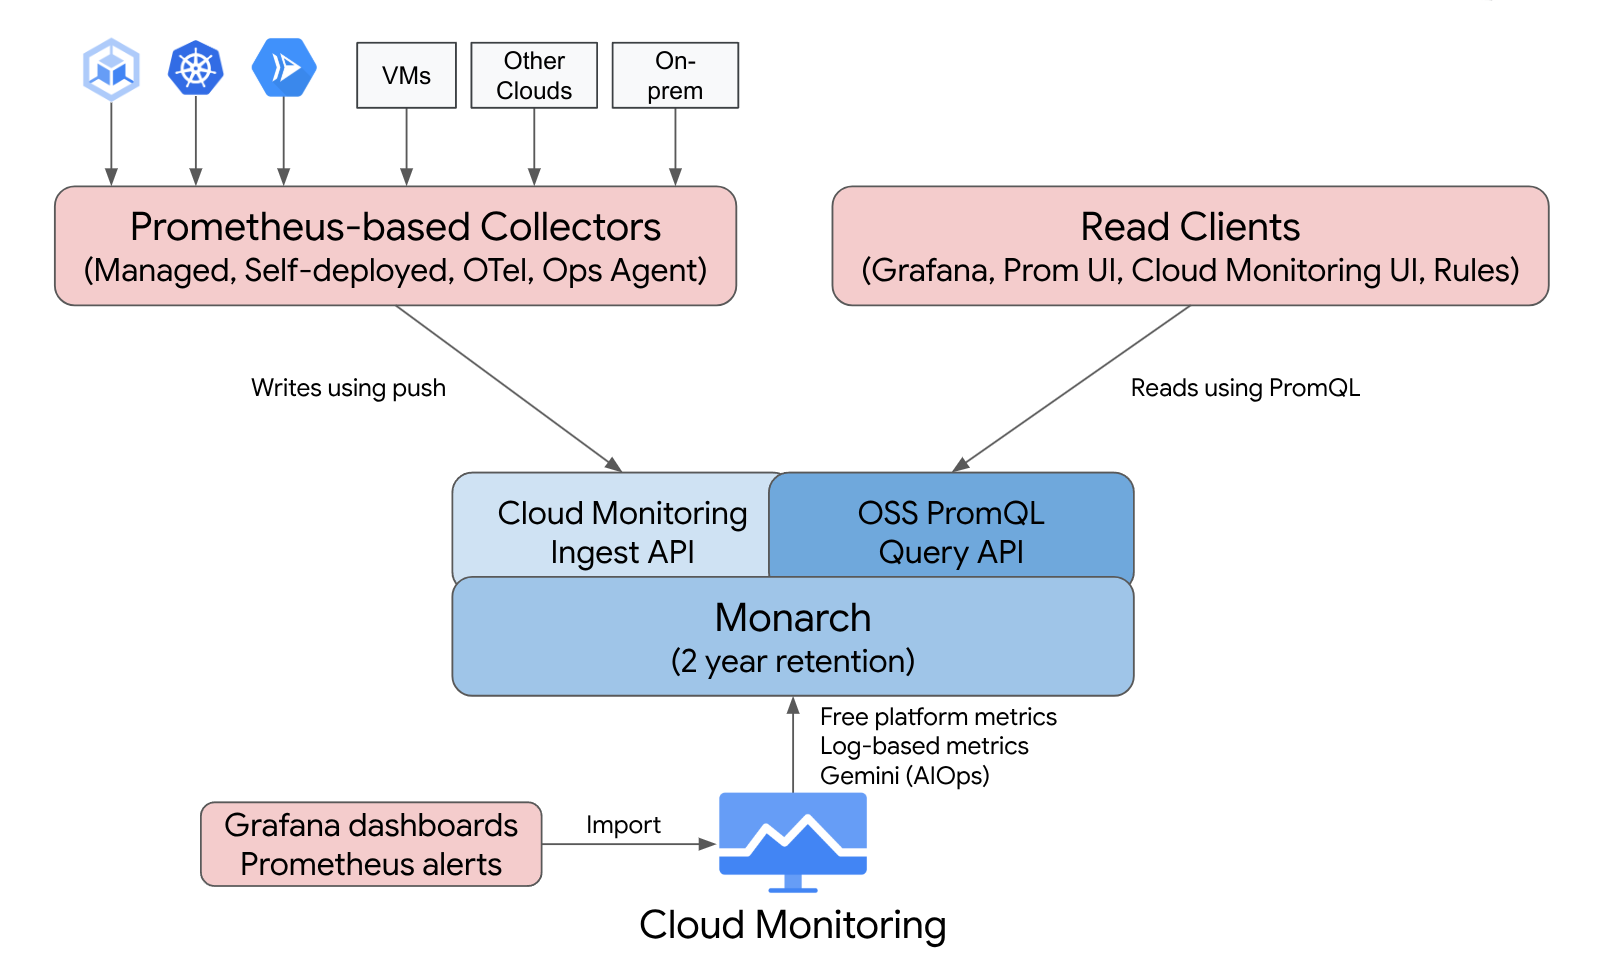
無論您如何查詢資料,使用 Managed Service for Prometheus 查詢的資料都會由 Cloud Monitoring 建構 指標範圍決定。
指標範圍
監控指標範圍是僅限讀取時間的建構元件,可讓您查詢屬於多個 Google Cloud 專案的指標資料。每個指標範圍都由指定的 Google Cloud 專案代管,稱為範圍專案。
[[["容易理解","easyToUnderstand","thumb-up"],["確實解決了我的問題","solvedMyProblem","thumb-up"],["其他","otherUp","thumb-up"]],[["難以理解","hardToUnderstand","thumb-down"],["資訊或程式碼範例有誤","incorrectInformationOrSampleCode","thumb-down"],["缺少我需要的資訊/範例","missingTheInformationSamplesINeed","thumb-down"],["翻譯問題","translationIssue","thumb-down"],["其他","otherDown","thumb-down"]],["上次更新時間:2025-09-04 (世界標準時間)。"],[],[],null,["# Configuring your metrics scopes\n\nThis document describes how to configure the metrics scopes of your\nGoogle Cloud projects for use with Google Cloud Managed Service for Prometheus.\n\nThe ideal Managed Service for Prometheus deployment is different from the\ntypical Prometheus deployment by necessity. Prometheus is highly scoped to\nits own instance---which is itself typically cluster-scoped---in that\nrules and queries run on the Prometheus server that collects the data.\nBecause Managed Service for Prometheus sends data to the global backend,\n[Monarch](https://research.google/pubs/pub50652/), queries must be configured to execute against\nMonarch, not the local cluster. If you are using managed collection,\nthen the same requirement applies to rules.\n\nThe data you query using Managed Service for Prometheus is determined\nby the Cloud Monitoring construct *metrics scope*, regardless of\nhow you query the data.\n\nMetrics scopes\n--------------\n\nA Monitoring metrics scope is a read-time-only construct that\nlets you query metric data belonging to multiple Google Cloud projects. Every\nmetrics scope is hosted by a designated Google Cloud project, called the\n*scoping project*.\n\nBy default, a project is the scoping project for its own metrics scope,\nand the metrics scope contains the metrics and configuration for that\nproject. A scoping project can have more than one monitored project in its\nmetrics scope, and the metrics and configurations from all the monitored\nprojects in the metrics scope are visible to the scoping project. A\nmonitored project can also belong to more than one metrics scope.\n\nWhen you query the metrics in a scoping project, and if that\nscoping project hosts a multi-project metrics scope, you can retrieve\ndata from multiple projects. If your metrics scope contains all your\nprojects, then your queries and rules evaluate globally.\n\nFor more information about scoping projects and metrics scope,\nsee [Metrics scopes](/monitoring/settings#concept-scope). For information about configuring\nmulti-project metrics scope, see [View metrics for multiple\nprojects](/monitoring/settings/multiple-projects).\n\nTo minimize the complexity of your permissions model, use as few metrics\nscopes as possible. If you do not consider your metric data to be sensitive\nand it is acceptable for all users to be able to access all metrics,\nthen use a single metrics scope that contains all your projects.\n\nGrouping projects together for querying\n---------------------------------------\n\nThe other best-practice scenarios use the following metrics-scope\nconfigurations:"]]