本文將說明如何使用 OpenTelemetry 檢測 LangGraph ReAct Agent,以便從該 Agent 收集遙測資料。使用者提示、代理程式回覆和選項會以附加至範圍的屬性形式,納入遙測資料。與包含生成式 AI 事件的範圍相關聯的記錄項目,也會包含代理程式回覆。如果代理程式使用 Langchain 的 ChatVertexAI 呼叫 Gemini 模型,請按照本文中的操作說明進行。
檢測生成式 AI 應用程式,收集遙測資料
如要為生成式 AI 應用程式進行儀表化,以收集記錄、指標和追蹤資料,請執行下列操作:
安裝 OpenTelemetry 套件
新增下列 OpenTelemetry 檢測和匯出工具套件:
pip install 'opentelemetry-instrumentation-vertexai>=2.0b0' \
  'opentelemetry-instrumentation-sqlite3' \
  'opentelemetry-exporter-gcp-logging' \
  'opentelemetry-exporter-gcp-monitoring' \
  'opentelemetry-exporter-otlp-proto-grpc'
記錄和指標資料會透過 Cloud Logging API 或 Cloud Monitoring API 傳送至 Google Cloud 專案。opentelemetry-exporter-gcp-logging 和 opentelemetry-exporter-gcp-monitoring 程式庫會叫用這些 API 中的端點。
追蹤記錄資料會使用遙測 (OTLP) API 傳送至 Google Cloud ,該 API 會實作 OpenTelemetry OTLP 通訊協定。opentelemetry-exporter-otlp-proto-grpc 程式庫會叫用遙測 (OTLP) API 端點。
追蹤資料的儲存格式通常與 OpenTelemetry OTLP 通訊協定定義的 proto 檔案一致。不過,欄位可能會先從 OpenTelemetry 專屬資料類型轉換為 JSON 資料類型,再進行儲存。如要進一步瞭解儲存格式,請參閱「追蹤資料的結構定義」。
設定 OpenTelemetry 來收集及傳送遙測資料
在 LangGraph 代理程式的初始化程式碼中,設定 OpenTelemetry 來擷取遙測資料並傳送至 Google Cloud 專案:
如要查看完整範例,請按一下「更多」圖示 more_vert,然後選取「在 GitHub 上查看」。
追蹤生成式 AI 虛擬服務專員的叫用情形
如要追蹤 LangGraph 代理程式叫用的執行作業,請在代理程式叫用作業周圍建立自訂範圍:
如要查看完整範例,請按一下「更多」圖示 more_vert,然後選取「在 GitHub 上查看」。
您可能想在應用程式程式碼的重要位置加入先前的程式碼。
如要進一步瞭解如何新增自訂範圍和指標,請參閱「在應用程式中新增自訂追蹤記錄和指標」。
執行範例
這個範例是使用 OpenTelemetry 檢測的 LangGraph 代理程式,可將追蹤記錄和記錄檔連同生成式 AI 提示和回覆,以及指標傳送至您的Google Cloud 專案。
LangGraph 代理程式身分
LangGraph 代理程式定義為 SQL 專家,可完整存取暫時性 SQLite 資料庫。這個代理程式是使用 LangGraph 預先建構的 ReAct 代理程式實作,並使用 SQLDatabaseToolkit 存取資料庫 (一開始是空的)。
事前準備
- Sign in to your Google Cloud account. If you're new to Google Cloud, create an account to evaluate how our products perform in real-world scenarios. New customers also get $300 in free credits to run, test, and deploy workloads.
-
Install the Google Cloud CLI.
-
如果您使用外部識別資訊提供者 (IdP),請先 使用聯合身分登入 gcloud CLI。
-
如要初始化 gcloud CLI,請執行下列指令:
gcloud init -
Create or select a Google Cloud project.
Roles required to select or create a project
- Select a project: Selecting a project doesn't require a specific IAM role—you can select any project that you've been granted a role on.
-
Create a project: To create a project, you need the Project Creator
(
roles/resourcemanager.projectCreator), which contains theresourcemanager.projects.createpermission. Learn how to grant roles.
-
Create a Google Cloud project:
gcloud projects create PROJECT_ID
Replace
PROJECT_IDwith a name for the Google Cloud project you are creating. -
Select the Google Cloud project that you created:
gcloud config set project PROJECT_ID
Replace
PROJECT_IDwith your Google Cloud project name.
-
Verify that billing is enabled for your Google Cloud project.
-
Enable the Vertex AI, Telemetry, Cloud Logging, Cloud Monitoring, and Cloud Trace APIs:
Roles required to enable APIs
To enable APIs, you need the Service Usage Admin IAM role (
roles/serviceusage.serviceUsageAdmin), which contains theserviceusage.services.enablepermission. Learn how to grant roles.gcloud services enable aiplatform.googleapis.com
telemetry.googleapis.com logging.googleapis.com monitoring.googleapis.com cloudtrace.googleapis.com -
Install the Google Cloud CLI.
-
如果您使用外部識別資訊提供者 (IdP),請先 使用聯合身分登入 gcloud CLI。
-
如要初始化 gcloud CLI,請執行下列指令:
gcloud init -
Create or select a Google Cloud project.
Roles required to select or create a project
- Select a project: Selecting a project doesn't require a specific IAM role—you can select any project that you've been granted a role on.
-
Create a project: To create a project, you need the Project Creator
(
roles/resourcemanager.projectCreator), which contains theresourcemanager.projects.createpermission. Learn how to grant roles.
-
Create a Google Cloud project:
gcloud projects create PROJECT_ID
Replace
PROJECT_IDwith a name for the Google Cloud project you are creating. -
Select the Google Cloud project that you created:
gcloud config set project PROJECT_ID
Replace
PROJECT_IDwith your Google Cloud project name.
-
Verify that billing is enabled for your Google Cloud project.
-
Enable the Vertex AI, Telemetry, Cloud Logging, Cloud Monitoring, and Cloud Trace APIs:
Roles required to enable APIs
To enable APIs, you need the Service Usage Admin IAM role (
roles/serviceusage.serviceUsageAdmin), which contains theserviceusage.services.enablepermission. Learn how to grant roles.gcloud services enable aiplatform.googleapis.com
telemetry.googleapis.com logging.googleapis.com monitoring.googleapis.com cloudtrace.googleapis.com 如果您在 Cloud Shell、資源或本機開發環境中執行範例,則本節列出的權限就已足夠。 Google Cloud對於正式版應用程式,通常是服務帳戶提供寫入記錄、指標和追蹤資料的憑證。
如要取得範例應用程式寫入記錄、指標和追蹤資料所需的權限,請要求管理員為您授予專案的下列 IAM 角色:
-
Cloud 遙測資料追蹤記錄寫入者 (
roles/telemetry.tracesWriter) -
記錄寫入者 (
roles/logging.logWriter) -
Monitoring 指標寫入者 (
roles/monitoring.metricWriter) -
Vertex AI 使用者 (
roles/aiplatform.user)
-
Cloud 遙測資料追蹤記錄寫入者 (
在 Cloud Shell 中發出下列指令:
git clone https://github.com/GoogleCloudPlatform/opentelemetry-operations-python.git前往範例目錄:
cd opentelemetry-operations-python/samples/langgraph-sql-agent設定環境變數:
# Capture GenAI prompts and responses
export OTEL_INSTRUMENTATION_GENAI_CAPTURE_MESSAGE_CONTENT=true
# Capture application logs automatically
export OTEL_PYTHON_LOGGING_AUTO_INSTRUMENTATION_ENABLED=true
建立虛擬環境並執行範例:
python -m venv venv/
source venv/bin/activate
pip install -r requirements.txt
python main.py
應用程式會顯示類似以下的訊息:
Starting agent using ephemeral SQLite DB.如要建立資料庫,請在「Talk to the SQL agent >>」(與 SQL 代理程式對話 >>) 提示中輸入值,然後按下 Enter 鍵。
代理執行的動作隨即會顯示在 Cloud Shell 中。
下圖說明使用者與應用程式之間的互動範例:
Talk to the SQL agent >> Create a new table to hold weather data.
👤 User: Create a new table to hold weather data.
🤖 Agent: I need to know what columns the table should have. What information about the weather do you want to store? For example, I could include columns for date, location, temperature, humidity, and precipitation.

Talk to the SQL agent >> Create a new table to hold weather data. Include date, location, temperature, humidity, and precipitation.
👤 User: Create a new table to hold weather data. Include date, location, temperature, humidity, and precipitation.
🤖 Agent

CREATE TABLE weather (
  date DATE,
  location VARCHAR(255),
  temperature REAL,
  humidity REAL,
  precipitation REAL
);
如要退出,請輸入
Ctrl-C。-
記錄檢視器 (
roles/logging.viewer) -
監控檢視器 (
roles/monitoring.viewer) -
Cloud Trace 使用者 (
roles/cloudtrace.user) -
前往 Google Cloud 控制台的「Trace Explorer」頁面:
您也可以透過搜尋列找到這個頁面。
在工具列中,依序選取「新增篩選器」和「範圍名稱」,然後選取
invoke agent。「執行範例」一節包含範例執行作業,其中兩個提示會傳送至應用程式。下圖顯示篩選資料後的「追蹤記錄探索工具」頁面:
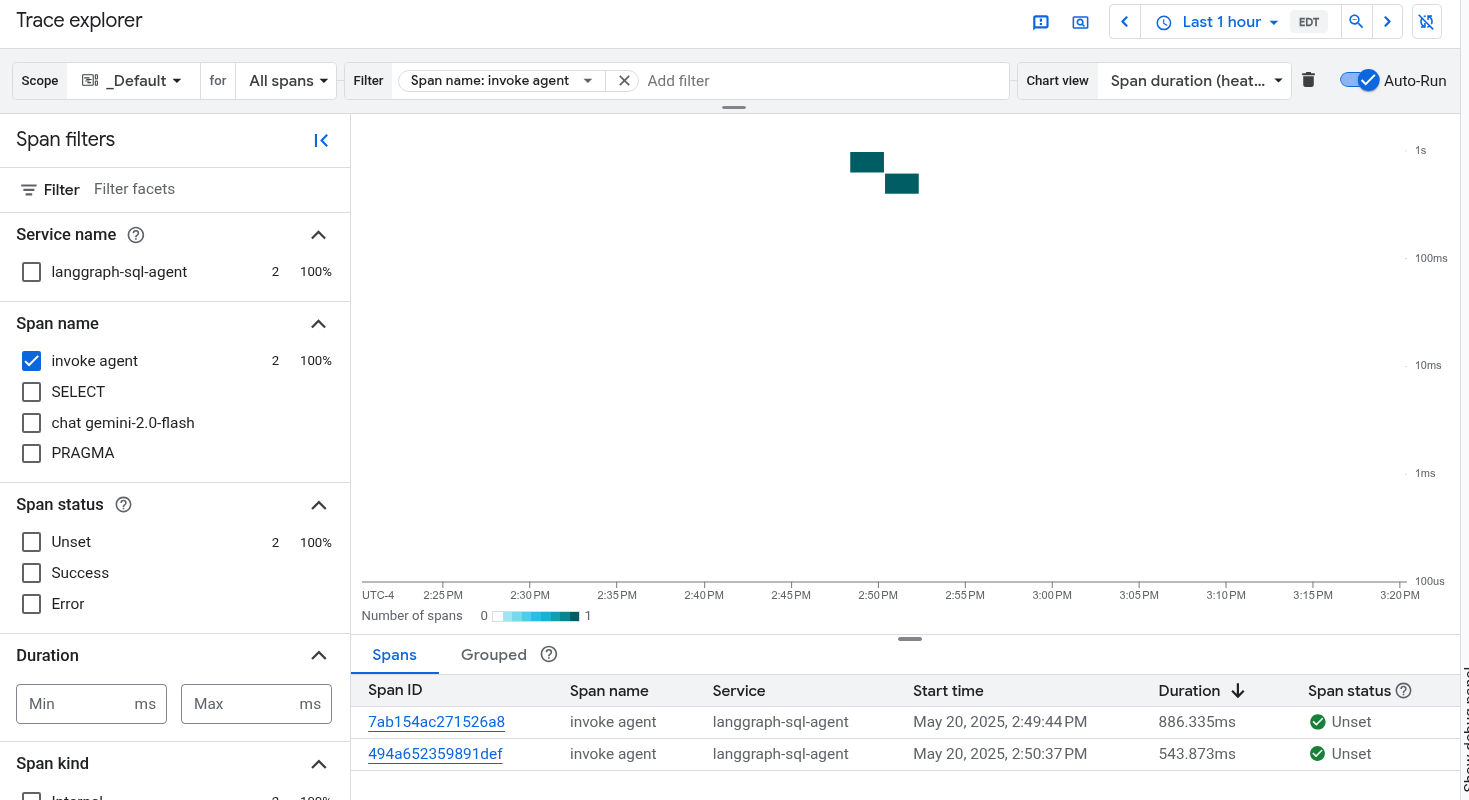
如果您從未使用過 Cloud Trace,Google Cloud Observability 就需要建立資料庫來儲存追蹤資料。建立資料庫可能需要幾分鐘,這段期間無法查看任何追蹤資料。
如要探索時距和記錄檔資料,請在「Spans」(時距) 表格中選取時距。
「詳細資料」頁面隨即開啟。這個頁面會顯示相關聯的追蹤記錄及其範圍。頁面上的表格會顯示所選時間範圍的詳細資訊。這類資訊包括:
「生成式 AI」GenAI分頁會顯示生成式 AI 代理的事件。 如要進一步瞭解這些事件,請參閱「查看生成式 AI 事件」一文。
下圖顯示追蹤記錄,其中一個範圍的名稱為
invoke_agent。該範圍會叫用 Gemini。 Gemini 時距包含生成式 AI 事件: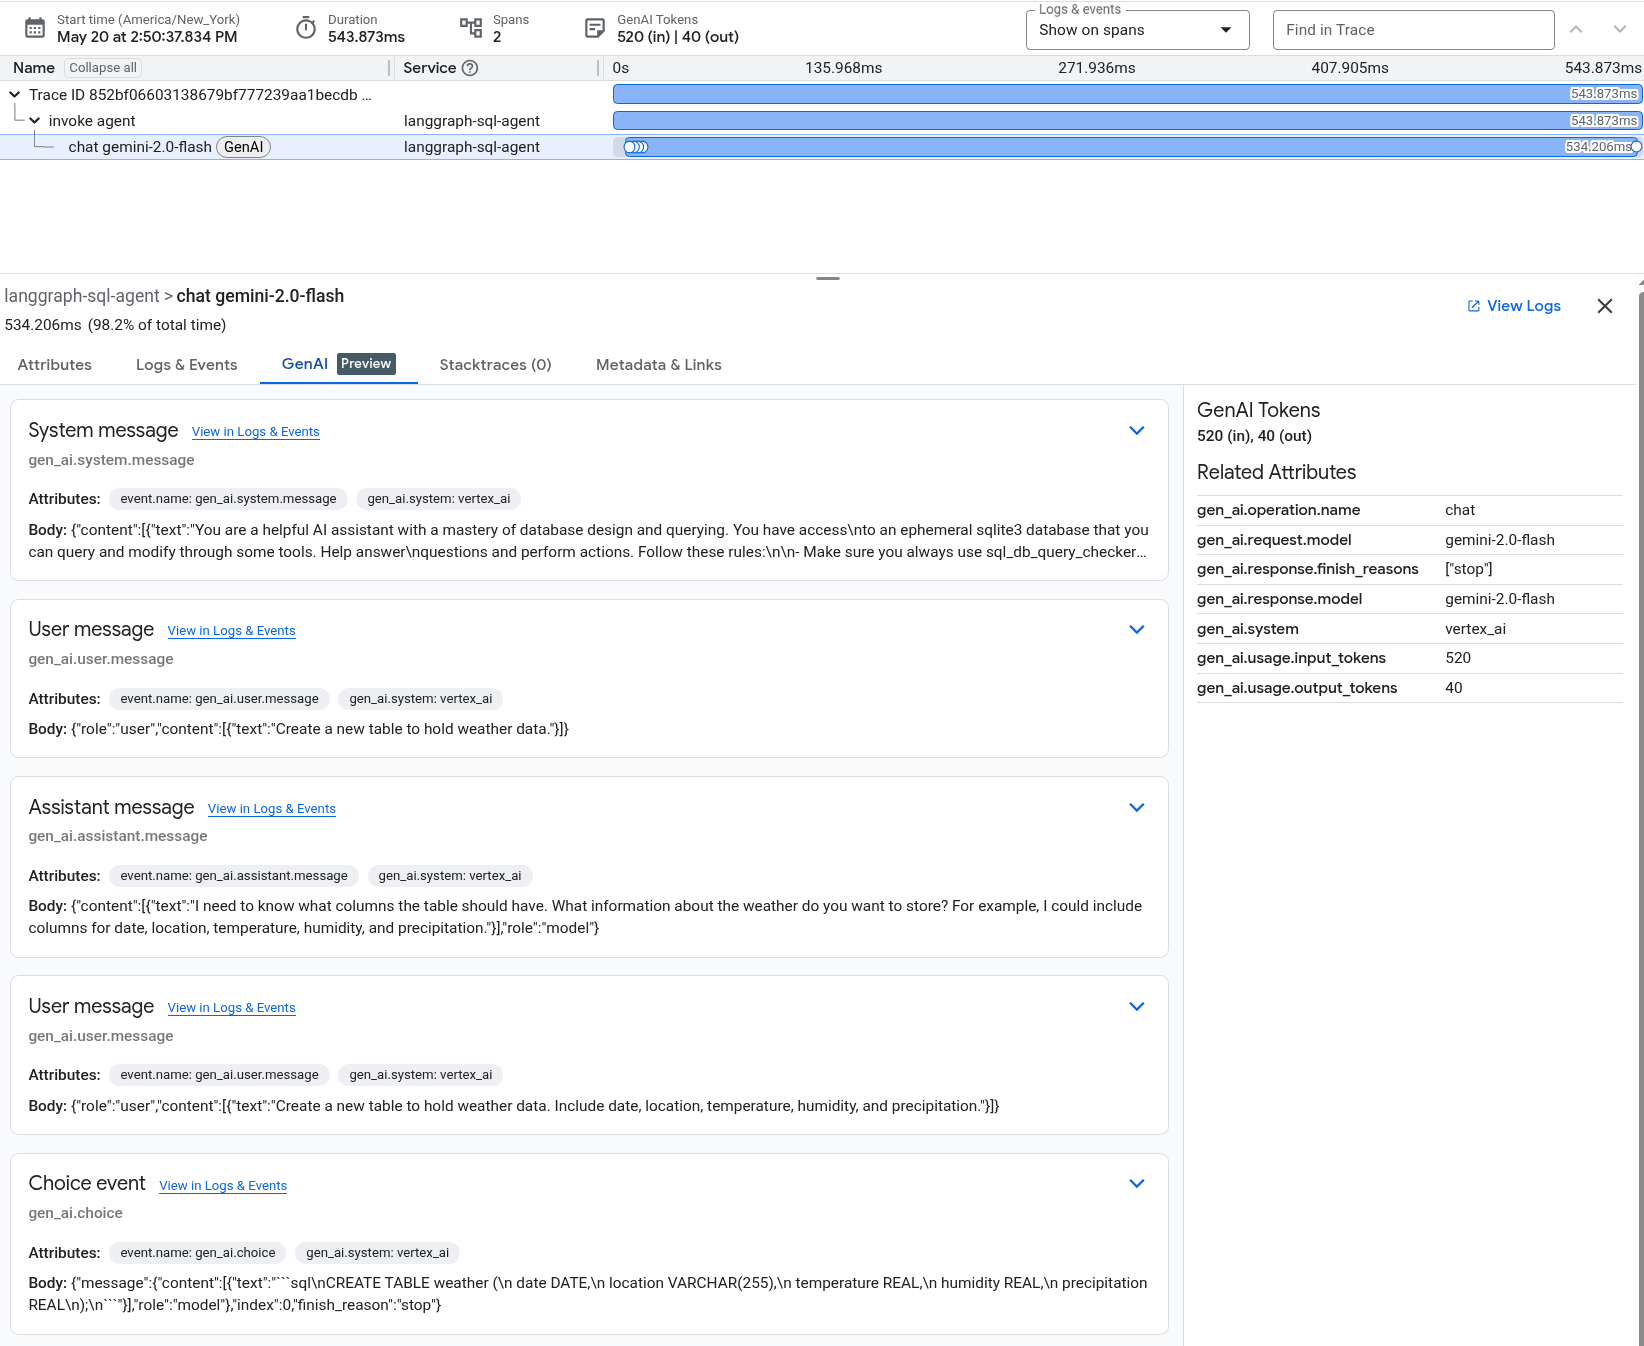
「記錄和事件」分頁會列出與時距相關聯的記錄項目和事件。如要在記錄檔探索工具中查看記錄資料,請在這個分頁的工具列中選取「查看記錄」。
記錄資料包含 LangGraph 代理程式的回應。舉例來說,在範例執行中,JSON 酬載包含下列內容:
{
  logName: "projects/my-project/logs/otel_python_inprocess_log_name_temp"
  jsonPayload: {
    finish_reason: "stop"
    message: {
      role: "model"
      content: [
        0: {
          text: "I need to know what columns the table should have. What information about the weather do you want to store? For example, I could include columns for date, location, temperature, humidity, and precipitation."
        }
      ]
    }
  index: 0
  }
...
}
執行範例
如要執行範例,請按照下列步驟操作:
生成式 AI 代理執行的動作並非確定性,因此即使輸入相同的提示,回覆也可能會有差異。
查看追蹤記錄、指標和記錄
本節說明如何查看生成式 AI 事件。
事前準備
如要取得查看記錄、指標和追蹤資料所需的權限,請要求管理員為您授予專案的下列 IAM 角色:
如要進一步瞭解如何授予角色,請參閱「管理專案、資料夾和機構的存取權」。
查看遙測資料
如要查看生成式 AI 事件,請使用「Trace Explorer」頁面:
這個範例已完成儀表化,可將指標資料傳送至您的 Google Cloud 專案,但不會產生任何指標。