本文档介绍了如何对使用智能体开发套件 (ADK) 框架构建的 AI 代理进行插桩。借助这种利用 OpenTelemetry 的插桩,您可以收集用户提示、代理响应和代理选择。
ADK 框架本身已使用 OpenTelemetry 进行插桩,可捕获代理执行过程中关键步骤的遥测数据。这样可提供开箱即用的宝贵应用可观测性。不过,这种可观测性可能无法满足您应用的应用场景。您可以使用 OpenTelemetry 添加其他插桩库,以捕获应用其他部分的遥测数据,也可以使用自己的自定义插桩来捕获应用特有数据,从而获得更精细的可观测性。
例如,在您的应用中,您可以编写插桩代码来执行以下操作:
- 跟踪代理调用的工具的资源消耗情况。
- 跟踪应用特有验证的失败情况、业务规则的违反情况或自定义错误恢复机制。
- 跟踪代理回答以领域特有标准为评判准则的质量得分。
对生成式 AI 应用进行插桩以收集遥测数据
如需对 AI 代理进行插桩以收集日志、指标和跟踪记录数据,请执行以下操作:
本部分的其余内容将介绍上述步骤。
安装 OpenTelemetry 软件包
添加以下 OpenTelemetry 插桩和导出器软件包:
pip install 'opentelemetry-instrumentation-google-genai' \
  'opentelemetry-instrumentation-sqlite3' \
  'opentelemetry-exporter-gcp-logging' \
  'opentelemetry-exporter-gcp-monitoring' \
  'opentelemetry-exporter-otlp-proto-grpc' \
  'opentelemetry-instrumentation-vertexai>=2.0b0'
日志和指标数据使用 Cloud Logging API 或 Cloud Monitoring API 发送到您的 Google Cloud 项目。opentelemetry-exporter-gcp-logging 和 opentelemetry-exporter-gcp-monitoring 库会调用这些 API 中的端点。
跟踪数据使用支持 OTLP 格式的遥测 (OTLP) API 发送到 Google Cloud 。通过此端点接收的数据也会以 OTLP 格式存储。
opentelemetry-exporter-otlp-proto-grpc 库会调用遥测 (OTLP) API 端点。
配置 OpenTelemetry 以收集和发送遥测数据
在 ADK 代理的初始化代码中,通过添加代码来配置 OpenTelemetry 以捕获遥测数据并将其发送到您的 Google Cloud 项目:
如需查看完整示例,请点击 more_vert 更多,然后选择在 GitHub 上查看。
编写自定义入口点以使用配置的 OpenTelemetry
如需使用 OpenTelemetry 进行插桩,请为 ADK 应用创建自定义入口点。自定义入口点必须在启动 ADK 代理之前配置 OpenTelemetry。
在示例应用中,main 方法充当自定义入口点,用于初始化 OpenTelemetry,然后启动 FastAPI 服务器,以便您与代理互动。
如需查看完整示例,请点击 more_vert 更多,然后选择在 GitHub 上查看。
下载并运行示例应用
此示例代码实现了一个使用 ADK 构建的生成式 AI 代理。该代理使用 OpenTelemetry 进行插桩,并配置为将指标、跟踪记录和日志发送到您的 Google Cloud 项目。发送到您项目的遥测数据包括生成式 AI 提示和回答。
ADK 代理角色
生成式 AI 代理定义为可完全访问临时 SQLite 数据库的 SQL 专家。该代理使用智能体开发套件构建,并使用 SQLDatabaseToolkit 访问数据库。数据库最初是空的。
准备工作
-
Install the Google Cloud CLI.
-
配置 gcloud CLI 以使用您的联合身份。
如需了解详情,请参阅使用联合身份登录 gcloud CLI。
-
如需初始化 gcloud CLI,请运行以下命令:
gcloud init -
Create or select a Google Cloud project.
Roles required to select or create a project
- Select a project: Selecting a project doesn't require a specific IAM role—you can select any project that you've been granted a role on.
-
Create a project: To create a project, you need the Project Creator
(
roles/resourcemanager.projectCreator), which contains theresourcemanager.projects.createpermission. Learn how to grant roles.
-
Create a Google Cloud project:
gcloud projects create PROJECT_ID
Replace
PROJECT_IDwith a name for the Google Cloud project you are creating. -
Select the Google Cloud project that you created:
gcloud config set project PROJECT_ID
Replace
PROJECT_IDwith your Google Cloud project name.
-
Verify that billing is enabled for your Google Cloud project.
-
Enable the Vertex AI, Telemetry, Cloud Logging, Cloud Monitoring, and Cloud Trace APIs:
Roles required to enable APIs
To enable APIs, you need the Service Usage Admin IAM role (
roles/serviceusage.serviceUsageAdmin), which contains theserviceusage.services.enablepermission. Learn how to grant roles.gcloud services enable aiplatform.googleapis.com
telemetry.googleapis.com logging.googleapis.com monitoring.googleapis.com cloudtrace.googleapis.com 如果您在 Cloud Shell、 Google Cloud资源或本地开发环境中运行示例,则只需具备本部分中列出的权限即可。对于生产应用,通常由服务账号提供用于写入日志、指标和跟踪记录数据的凭据。
如需获得让示例应用写入日志、指标和跟踪记录数据所需的权限,请让管理员为您授予项目的以下 IAM 角色:
-
Cloud Telemetry Traces Writer (
roles/telemetry.tracesWriter) -
Logs Writer (
roles/logging.logWriter) -
Monitoring Metric Writer (
roles/monitoring.metricWriter) -
Vertex AI User (
roles/aiplatform.user)
-
Cloud Telemetry Traces Writer (
在 Cloud Shell 中,发出以下命令:
git clone https://github.com/GoogleCloudPlatform/opentelemetry-operations-python.git前往示例目录:
cd opentelemetry-operations-python/samples/adk-sql-agent创建虚拟环境并运行示例:
python -m venv venv/
source venv/bin/activate
pip install -r requirements.txt
env $(cat opentelemetry.env | xargs) python main.py
应用会显示类似以下内容的消息:
Appplication startup complete
Uvicorn running on http://0.0.0.0:8080
如需与代理互动,请在浏览器中打开上一步中列出的地址。
展开选择一个代理,然后从代理列表中选择
sql_agent。-
Logs Viewer (
roles/logging.viewer) -
Monitoring Viewer (
roles/monitoring.viewer) -
Cloud Trace User (
roles/cloudtrace.user) -
在 Google Cloud 控制台中,前往 Trace 探索器页面:
您也可以使用搜索栏查找此页面。
在工具栏中,依次选择添加过滤条件、Span 名称和
call_llm。下面展示了过滤数据后的 Trace 探索器页面:
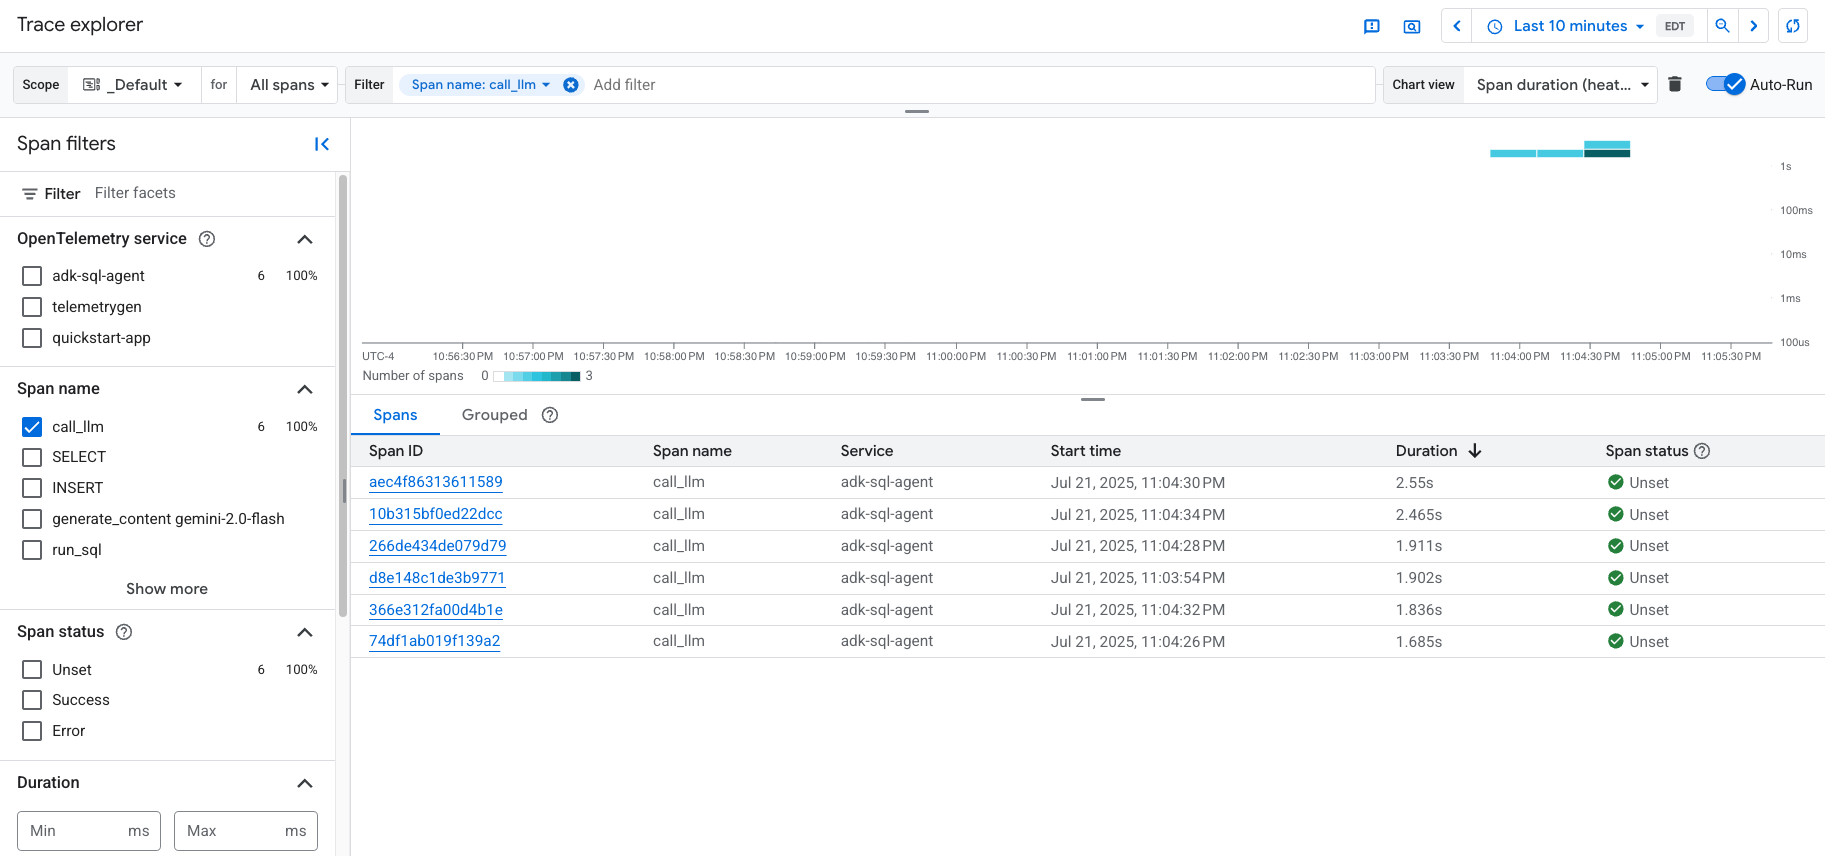
如果您之前从未使用过 Cloud Trace,Google Cloud Observability 需要创建一个数据库来存储跟踪记录数据。创建数据库可能需要几分钟时间,在此期间,您无法查看任何跟踪记录数据。
如需浏览 span 和日志数据,请在 Span 表格中选择 span。
系统会打开详细信息页面。此页面会显示关联的跟踪记录及其 span。页面上的表格会显示您所选 span 的详细信息。这些信息包括:
GenAI 标签页会显示生成式 AI 智能体的事件。如需详细了解这些事件,请参阅查看生成式 AI 事件。
以下屏幕截图展示了一条跟踪记录,其中一个 span 的名称为
call_llm。该 span 会调用为该代理提供支持的 LLM(大语言模型)。在此示例中,它是 Gemini。 Gemini span 包含以下生成式 AI 事件: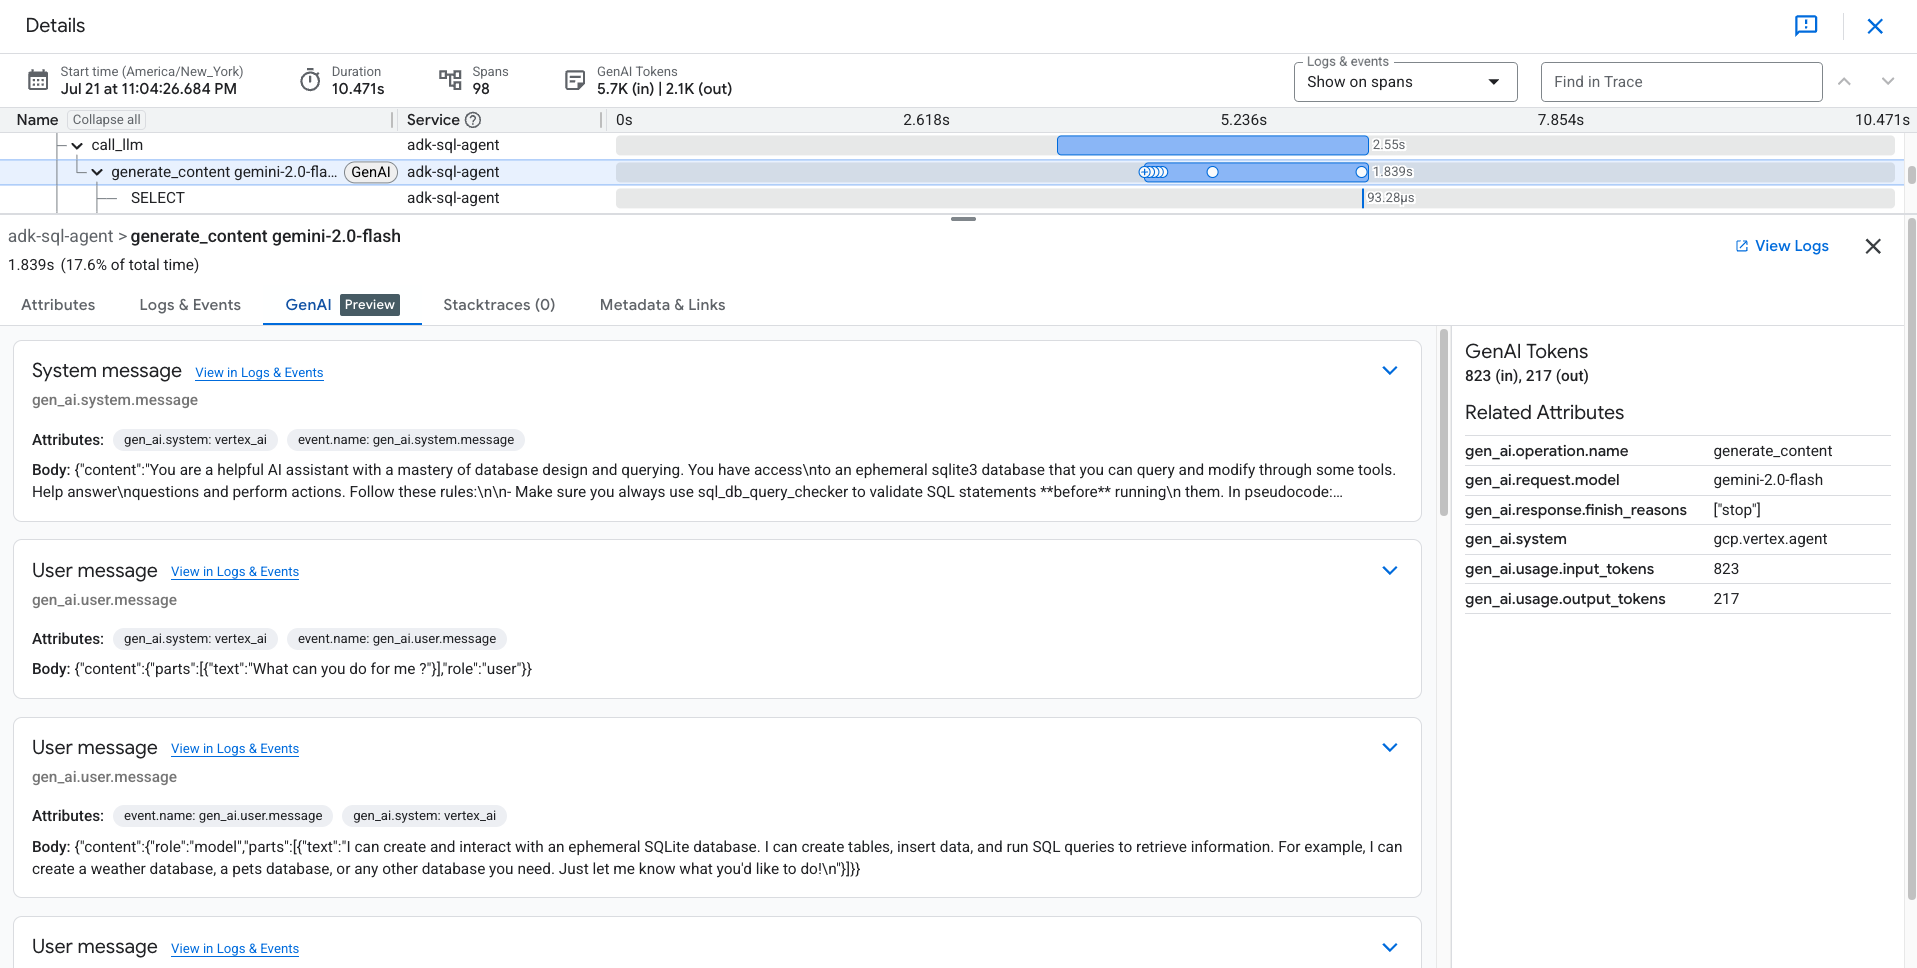
日志和事件标签页会列出与该 span 关联的日志条目和事件。如果您想在 Logs Explorer 中查看日志数据,请在该标签页的工具栏中选择查看日志。
日志数据包含
sql_agent的回答。例如,对于示例运行,JSON 载荷包含以下内容:{ "logName": "projects/my-project/logs/otel_python_inprocess_log_name_temp", "jsonPayload": { "content": { "role": "model", "parts": [ { "executable_code": null, "inline_data": null, "thought": null, "video_metadata": null, "code_execution_result": null, "function_response": null, "thought_signature": null, "text": "Okay, I will create a table named `weather` with columns `id`, `city`, `temperature`, and `date`. Then I will insert some sample rows into the table and display all the data in the table.\n", "file_data": null, "function_call": null } ] } }, ... }
启动应用
如需启动示例应用,请执行以下操作:
与代理互动
如需与代理互动,请向其提问或发出命令。例如,您可以提出以下问题:
What can you do for me ?
同样,由于 sql_agent 具有 SQL 专家角色,因此您可以要求它为您的应用创建表,并编写查询来使用所创建的表。代理创建的临时数据库只能受在运行应用的机器上创建的 .db 文件的支持。
下方展示了 sql_agent 与用户之间的互动示例:
Create a table for me to store weather data and also insert sample data in
the table. At the end show all data in the table you created.
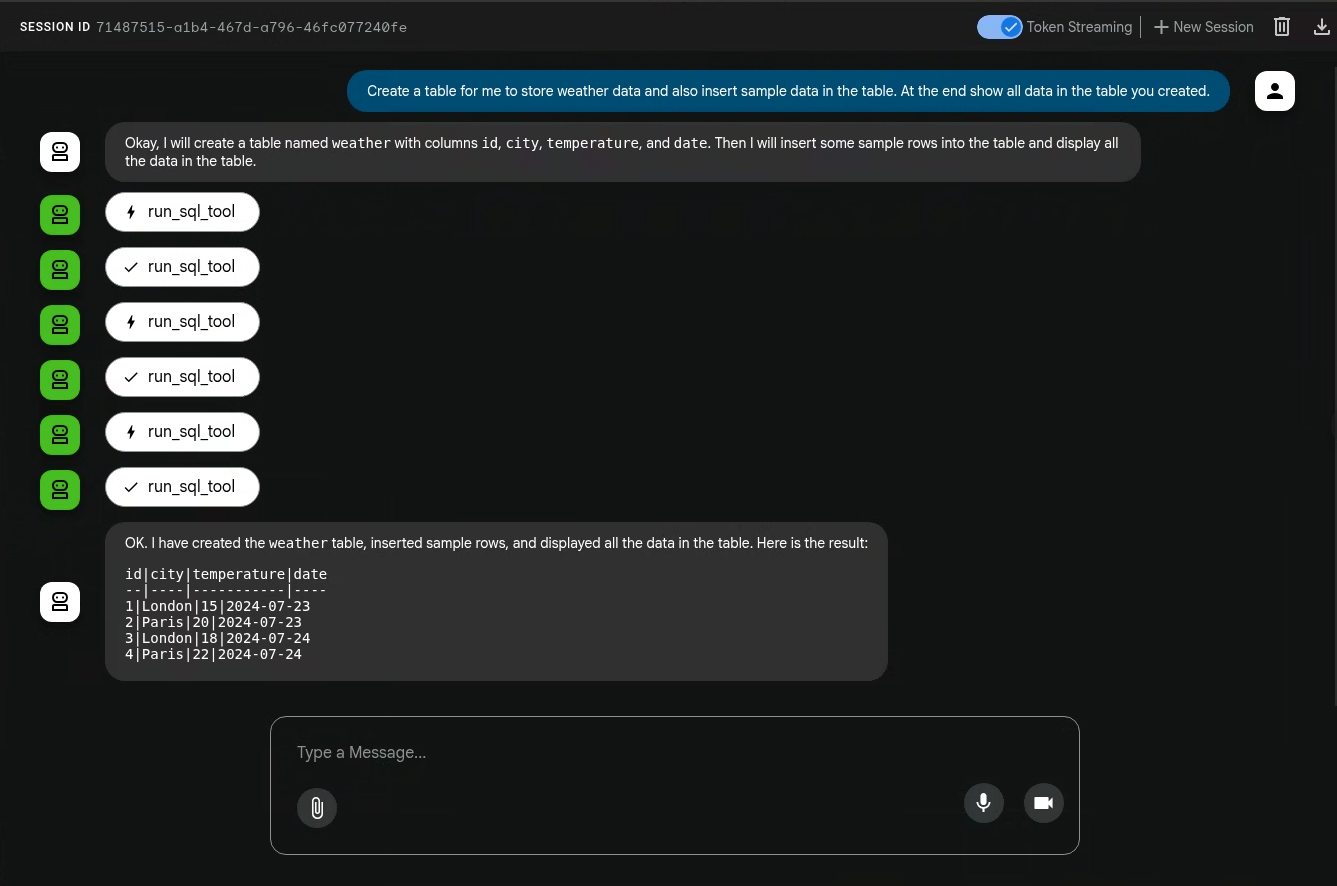
生成式 AI 代理执行的操作不是确定性的,因此您可能会看到针对同一提示的不同回答。
退出应用
如需退出应用,请在用于启动应用的 shell 中输入 Ctrl-C。
查看跟踪记录、指标和日志
本部分介绍如何查看生成式 AI 事件。
准备工作
如需获得查看日志、指标和跟踪记录数据所需的权限,请让管理员为您授予项目的以下 IAM 角色:
如需详细了解如何授予角色,请参阅管理对项目、文件夹和组织的访问权限。
查看遥测数据
如需查看应用创建的生成式 AI 事件,请访问 Trace 探索器页面:
该示例经过插桩,可将指标数据发送到您的 Google Cloud 项目,但不会生成任何指标。