Set up a query-based alert by using MQL
This document shows you how to use Monitoring Query Language (MQL) to explore metrics, create charts, and set up a query-based alert in the Google Cloud console. If you prefer to use the Cloud Monitoring API, then see Creating conditions for alerting policies.
In this document, you do the following:
Create a Compute Engine instance.
Navigate to the code editor.
Perform a query and create a chart.
Set up a query-based alert.
Before you begin
To use MQL, you need to create a Google Cloud project and enable billing.
- Sign in to your Google Cloud account. If you're new to Google Cloud, create an account to evaluate how our products perform in real-world scenarios. New customers also get $300 in free credits to run, test, and deploy workloads.
-
In the Google Cloud console, on the project selector page, select or create a Google Cloud project.
-
Verify that billing is enabled for your Google Cloud project.
-
In the Google Cloud console, on the project selector page, select or create a Google Cloud project.
-
Verify that billing is enabled for your Google Cloud project.
Next, configure permissions and notification channels.
-
To get the permissions that you need to create alerting policies with an MQL-based condition, ask your administrator to grant you the Monitoring Editor (
roles/monitoring.editor) IAM role on your project. For more information about granting roles, see Manage access to projects, folders, and organizations.You might also be able to get the required permissions through custom roles or other predefined roles.
For more information about Cloud Monitoring roles, see Control access with Identity and Access Management.
Ensure that you're familiar with the general concepts of alerting policies, MQL, and the code editor. For more information, see the following topics:
Create a Compute Engine instance
To have a Google Cloud resource to collect metrics from, create a Compute Engine instance by completing the following steps:
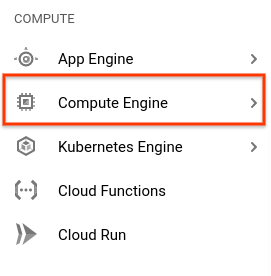
From the Google Cloud console menu, select Compute Engine.

Select Create instance, and then click Create.
Navigate to the code editor
To begin using MQL, do the following:
-
In the Google Cloud console, go to the leaderboard Metrics explorer page:
If you use the search bar to find this page, then select the result whose subheading is Monitoring.
- In the toolbar of the query-builder pane, select the button whose name is either code MQL or code PromQL.
- Verify that MQL is selected in the Language toggle. The language toggle is in the same toolbar that lets you format your query.
Use the code editor to construct, test, and run MQL queries.
Perform a query and create a chart
Create a query that charts the CPU utilization of your instance:
Paste the following query into the code editor:
fetch gce_instance::compute.googleapis.com/instance/cpu/utilization
| {
    top 1, max(val())
  ;
    bottom 1, min(val())
  }
| union
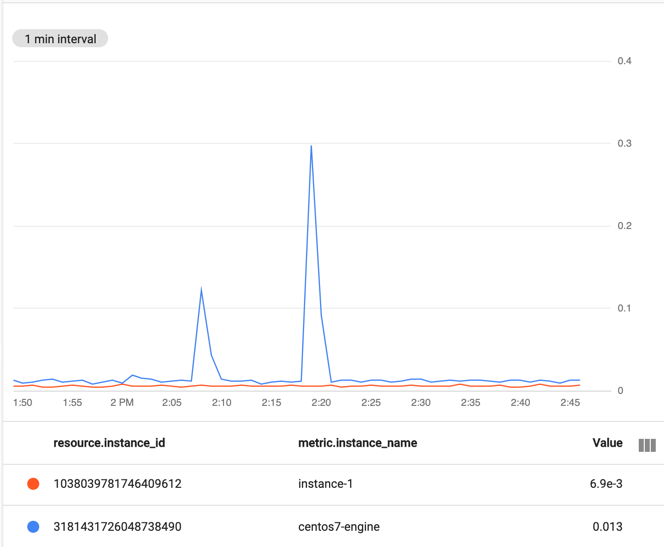
This query selects the time series with the maximum and minimum CPU utilization for charting. For more information on this query, see Combining selections with
union.Click Run Query. The chart displays two lines, showing your instance's maximum and minimum CPU utilization:

To save the chart, click Save Chart. Give the chart a name and add it to either an existing dashboard or a new one. Then click Save.
The chart can be accessed by going to the Monitoring overview page, or if you saved it to a dashboard, by going to that dashboard's page.
Set up a query-based alert
You can create an alerting policy that monitors the results of a query. To create such an alerting policy, complete the following steps:
-
In the Google Cloud console, go to the notifications Alerting page:
If you use the search bar to find this page, then select the result whose subheading is Monitoring.
From the Alerting page, click Edit Notification Channels. In this step, you configure an email address to receive alert notifications.
On the Notification channels page, go to Email and click Add new.
Enter the email address to which you want alert notifications sent in the Email Address field.
Enter a brief description of this channel, like "Alert on-call", in the Display name field.
Click Save.
Go back to the Alerting page by clicking arrow_back Back on the page header.
From the Alerting page, click Create Policy.
This page leads you through the steps to create an alerting policy:
- Describing what you want to alert on.
- Providing information about how to address this issue.
- Specifying a notification channel for the alert.
To describe what you want to alert on, click New Condition. This action brings up the form-based condition editor.
Under Policy configuration mode, select Code editor (MQL or PromQL).
Verify that MQL is selected in the Language toggle. The language toggle is in the same toolbar that lets you format your query.
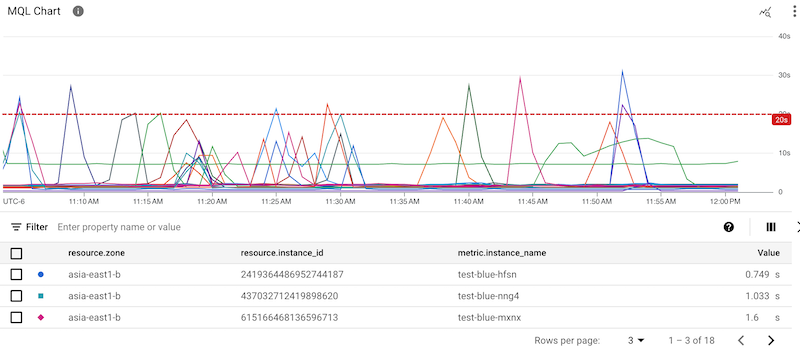
Enter the query that selects the data you want to monitor in the code editor. The following query triggers an alert when your instance's CPU usage time stays higher than 20 seconds:
fetch gce_instance::compute.googleapis.com/instance/cpu/usage_time
| window 1m
| condition val() > 20 's'
The
conditionoperation establishes the performance threshold you want to alert on. For more information aboutconditionand other alerting operations, see Alerting in the MQL reference.If Auto-run is enabled, then the MQL chart shows the selected data and a threshold line:

To configure the alert trigger, click Next:
In the Alert trigger menu, select the number of time series that must satisfy the alerting operation before the alerting policy can be triggered. You can select from the following criteria:
- A single time series.
- A specific number of time series.
- A percentage of the time series.
- All of the time series.
Optional: Expand the Advanced options menu, and in the Trigger when condition is met for this amount of time field, enter or select a value.
This field defines how long the condition must be satisfied before the alerting policy is triggered. The Retest window isn't the same as the alignment window used in the MQL query. For more information on the relationship between these values, see The alignment period and the duration.
Enter a name for your condition, such as "Basic MQL condition".
To set up notifications, documentation, and the alerting policy name, click Next.
Select the notification channel you created previously.
Choose a severity level.
Enter some text to be sent with any alert notification in the Documentation field. This text typically provides responders with information to help them address the problem. For this exercise, enter "Your CPU usage has exceeded 20 seconds."
Enter a name for the alerting policy in the Alert policy name field. This value lets you distinguish among notifications from different alerting policies.
Save your policy by clicking Create policy.
Clean up
To avoid incurring charges to your Google Cloud account for the resources used on this page, follow these steps.
Go to the Identity and Access Management page in the Google Cloud console:
Click Shut down and follow the instructions.
What's next
- Learn more about using the code editor.
- Explore a set of MQL examples.
- Learn more about MQL-based alerting policies.
- Learn how to invoke MQL queries from the Cloud Monitoring API.
- Explore the details of MQL in the MQL Reference.
- Read our resources about DevOps and explore DORA's research program.
