概覽
你是否看過這則錯誤訊息?
Unable to aggregate ratio metrics in the request. Please select another metric.
這項錯誤表示您要求 Looker Studio 對已匯總的比率指標執行無法執行的作業。舉例來說,您已根據計算欄位套用篩選器,但圖表包含比率指標。
解決方法是在圖表中選取非比率欄位 (例如使用「曝光次數」而非「點閱率」),或是移除或變更篩選器。
深入探討
比率指標會顯示兩個以上值的相對大小。舉例來說,Google Ads 指標「點閱率」(CTR) 是指廣告獲得的點擊次數除以廣告顯示次數後所得出的比率。在 Google Analytics 中,「參與度」是指網站或行動應用程式中互動工作階段的百分比,而「跳出率」則是參與度的相反詞。跳出率是指非互動工作階段的百分比。
在 Looker Studio 中,如果篩選含有比率指標的圖表,且篩選方式需要產品重新計算比率,就會出現先前的錯誤。
以下 3 點有助於瞭解這個問題:
Google Analytics、Google Ads、YouTube 和 Google Marketing Platform 產品等資料集中的資料,在傳送至 Looker Studio 時已完成匯總。舉例來說,當 Looker Studio 要求 Google Ads 指標 (例如點閱率) 時,資料已處理為適當的彙整類型。
由於上述原因,系統會在匯總資料後套用計算欄位函式。您無法 (一般來說也不會) 返回原始資料,查看該指標的每個獨立例項。舉例來說,如果您嘗試在 Google Ads 資料來源中,使用公式
SUM( Impressions )建立計算欄位,系統會顯示下列錯誤訊息:Re-aggregating metrics is not supported。這是因為「曝光次數」已匯總 (且匯總類型「自動」無法變更)。
為確保一致性,即使基礎系統並未原生支援,您仍可搭配所有資料來源類型使用 Looker Studio 中的所有計算欄位函式。舉例來說,您可以使用 CONCAT 函式合併任何資料來源中的多個值,即使基礎系統本身沒有 CONCAT 函式也沒關係。Looker Studio 不會將 CONCAT 函式「下推」至基礎系統,而是要求資料並自行執行串連作業。
匯總失敗示例
那麼這一切與 Unable to aggregate ratio metrics 錯誤有何關聯?這個範例會稍微深入探討 CONCAT 範例,協助您找出答案。
假設您在 Google Ads 資料來源中,使用下列公式建立名為「廣告活動:點擊類型」的計算欄位:
CONCAT(Campaign, " : ", Click Type)
Looker Studio 會分別查詢「廣告活動」和「點擊類型」,然後執行串連作業。結果會分組,因此不會有重複的記錄。
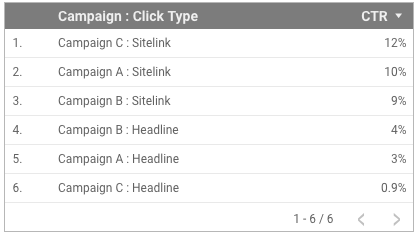
現在您可以在圖表中使用該串連欄位,且系統會正確匯總您納入的指標。舉例來說,我們可以在表格中使用「廣告活動:點擊類型」做為維度,並使用「點閱率」做為比率指標:
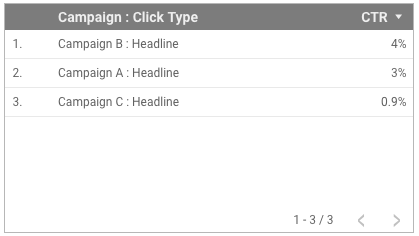
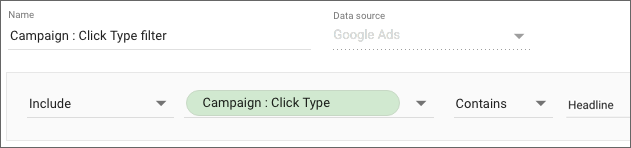
但現在假設您套用篩選器,只顯示「點擊類型」值為 Headline 的記錄:
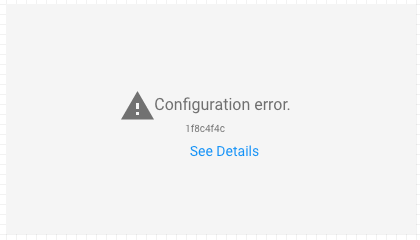
這會導致圖表無法正常運作:
為何會中斷
篩選器會要求 Looker Studio 納入「廣告活動:點擊類型」傳回的每筆記錄 (如果記錄包含 Headline 字串)。該欄位是兩個維度的串連,因此 Looker Studio 必須重新擷取這些維度,然後套用篩選器,才能完成這項要求。問題在於表格中出現了比例指標「點閱率」。Google Ads 比率指標會在 Looker Studio 提出要求前計算。Looker Studio 無法存取原始資料,也無法重新計算包含字串 Headline 的記錄的新比率。
解決方法
這類情況的解決方法取決於您要顯示的資料。在本例中,您可以將「點閱率」指標替換為非比率指標,例如「曝光次數」。或者,您也可以在標準的「點擊類型」欄位套用篩選器,而非在串連的「廣告活動:點擊類型」欄位套用篩選器,這樣也能達到相同效果。

圖表現在可以正常運作: