目標
在本教學課程中,您將完成下列目標:
- 瞭解如何建立算術計算欄位。
- 建立條件運算式來評估資料,並傳回不同的結果。
- 瞭解實作計算欄位的不同方法。
情境
假設您管理一家線上寵物用品店,您可以評估銷售資料,例如產品代碼 (SKU)、商品名稱、價格和銷售數量。範例如下:
| SKU | 項目 | 價格 | 售出數量 |
|---|---|---|---|
| D-001 | Healthy Dog 狗食 | 79.96 |
16 |
| B-002 | 鸚鵡棲木 | 74.97 |
8 |
| B-001 | Pretty Bird Bird Seed | 31.96 |
20 |
| C-002 | Hungry Kitty Cat Food | 29.98 |
3 |
| D-002 | Playful Puppy Toy | 17.97 |
11 |
| C-001 | Happy Cat Catnip |
14.97 |
4 |
您可以使用 Looker Studio 中的計算結果欄位,操控及擴充這項資料。在本練習中,您將使用計算欄位執行下列工作:
- 計算每筆訂單的總價值。
- 為超過特定金額的訂單套用折扣。
- 將銷售額歸入各部門。
範例資料
如要按照本練習的內容操作,請使用下列範例資料。否則,請使用自己的資料 (並相應調整欄位名稱)。您必須具備 Google 試算表的存取權。或者,您也可以使用檔案上傳連接器,將資料匯入 Looker Studio。
複製下列資料並貼到文字檔:
SKU,Item,Price,Qty Sold
D-001,Healthy Dog Dog Food,79.96,16
B-002,Parrot Perch,74.97,8
B-001,Pretty Bird Bird Seed,31.96,20
C-002,Hungry Kitty Cat Food,29.98,3
D-002,Playful Puppy Toy,17.97,11
C-001,Happy Cat Catnip,14.97,4
步驟 1:準備資料
- 複製上一個方塊中的範例資料。
- 開啟文字編輯器,貼上範例資料,然後將檔案儲存為
pet-store-data.csv。
在 Google 試算表中,依序選取「檔案」>「匯入」。
選取「上傳」,然後上傳您在步驟 2 建立的範例資料檔案。
選取「取代試算表」。
為試算表命名
Pet Store。
步驟 2:建立報表並新增資料
- 在 Looker Studio 中建立新報表。
- 在「將資料新增至報表」面板中,選取 Google 試算表連接器。
- 選取剛建立好的
Pet Store試算表和工作表。 - 保留已選取的預設選項。
- 按一下 [Add] (新增)。
隨即顯示的新報表會包含畫布上的表格,並使用寵物商店資料來源的欄位。
步驟 3:建立小計欄位
在選單中,依序選取「資源」>「管理已新增的資料來源」。
找出「Pet Store」資料來源,然後點選「編輯」
 。
。「資料來源欄位」面板隨即顯示。
按一下
 「新增欄位」。
系統隨即顯示計算結果欄位編輯器。
在「Field Name」(欄位名稱) 中輸入
Subtotal。在「Formula」(公式) 中輸入
Price * Qty Sold。按一下 [儲存]。
按一下「所有欄位」,返回主要資料來源編輯器。
步驟 4:建立折扣欄位
假設你想根據訂單價值提供不同的折扣率,建立另一個名為「Discount」的計算欄位,評估「小計」欄位並套用下列折扣。
| 小計價值 | 折扣率 |
| 0 - 99 | 0 |
| 100 到 499 人 | 5% |
| 500 個以上 | 10% |
提示:
- 在這個步驟中,您只會計算折扣。您將在下一個步驟中套用這項公式,方法是將「小計」欄位乘以「折扣」欄位。
- 使用
CASE運算式評估「小計」欄位。
- 每個折扣率都使用
WHEN子句。- 使用
ELSE子句傳回原價 (0% 折扣)。- 折扣應以小數值表示。舉例來說,25% 的折扣應輸入 .25。
解決方案
CASE
WHEN Subtotal > 499 THEN .9
WHEN Subtotal > 100 THEN .95
ELSE 1
END
THEN步驟 5:建立總計欄位
建立另一個名為「Total」的計算欄位,將「小計」欄位乘以「折扣」欄位。
解決方案
Subtotal * Discount
步驟 6:建立部門欄位
建立名為 Department 的最終計算欄位,剖析 SKU 欄位,並根據 SKU 指派新值。你會將狗、貓和鳥類相關商品分到不同部門。
提示:再次使用
CASE陳述式,這次搭配STARTS_WITH(或REGEXP_MATCH) 函式。
解決方案
CASE
WHEN STARTS_WITH(SKU, "C") THEN "Cat"
WHEN STARTS_WITH(SKU, "D") THEN "Dog"
WHEN STARTS_WITH(SKU, "B") THEN "Bird"
ELSE "Misc"
END
步驟 7:在報表中查看資料
- 儲存「部門」欄位後,按一下左側的「所有欄位」,返回資料來源編輯器。
- 按一下「完成」,然後關閉「管理資料來源」面板。
現在,您可以按照下列步驟,將新的計算欄位新增至圖表:
- 選取資料表。
- 將建立的每個計算欄位從「資料」面板拖曳到表格上,或拖曳到表格的「設定」面板,即可將這些欄位新增到表格。
另外也提供
先前的解決方案會將問題分解為個別區塊,並建立獨立欄位來處理每個區塊,就像您處理「小計」、「折扣」和「總計」欄位一樣。
另一種做法是在單一計算結果欄位中執行所有計算。舉例來說,您可以將本教學課程的步驟 3 到 5 合併為一個欄位:
CASE
WHEN Price * Qty Sold > 499 THEN (Price * Qty Sold) * .9
WHEN Price * Qty Sold > 100 THEN (Price * Qty Sold) * .95
ELSE Price * Qty Sold
END
這兩種方法各有優缺點:
將複雜公式拆分成不同欄位,可讓公式更容易閱讀及編寫,也較不容易出錯。在更多情境中,個別欄位也很有用。舉例來說,如果折扣率使用獨立欄位,您就能在其他計算中使用該欄位,或在報表中顯示該欄位。使用大量不連續的計算欄位建立公式的缺點之一,是您可能不清楚每個欄位的作用,因此必須個別編輯這些欄位,才能瞭解計算方式。
另一方面,將所有邏輯集中在一個欄位中,可讓公式更容易瞭解和編輯。但您可能也必須重複輸入大量內容,而且複雜的公式可能難以擴充或維護。舉例來說,假設您有 10 個產品等級,各有不同的訂購數量門檻。或者,假設您想為其他產品系列套用相同的折扣,在這種情況下,使用個別欄位來設定門檻和折扣可能較為簡單或有效率。
中庸之道
這項解決方案結合了先前說明的兩種方法。這樣做可將主要邏輯保留在單一欄位中,同時將部分依附邏輯分成不同欄位:
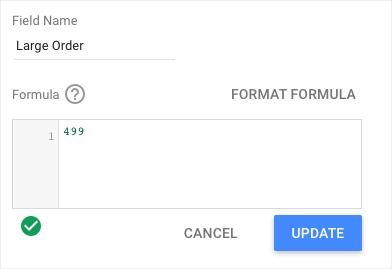
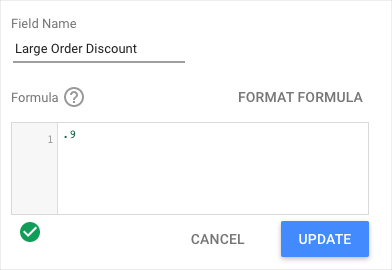
CASE
WHEN Subtotal > Large Order THEN Subtotal * Large Order Discount
WHEN Subtotal > Medium Order THEN Subtotal * Medium Order Discount
ELSE Subtotal
END
在這個解決方案中,我們建立了個別欄位,用來保存大型和中型訂單的值,以及對應的折扣。
這項解決方案的優點是容易閱讀、彈性高,而且相對容易視需要調整。