您可以添加将数据的每一行与列的总值进行比较的指标。您还可以对图表中的数据应用滚动计算。
向图表添加比较指标
- 修改报告。
- 选择图表。
- 在属性面板中,选择设置标签页。
- 选择一个指标,然后点击 “修改”选项。
- 点击比较计算菜单,然后选择一种比较方式。
- 如需显示指标的基础值,请将比较计算选择项更改为无。

与总数进行比较
您可以将每行数据与相应字段的总计值进行比较:
- 占总数的百分比显示的是当前行的值除以列总和所得的百分比。
- 与总数的差显示的是列总数减去当前行的值。
- 与总数的百分比差:列总数减去当前行的值,然后除以列总数。
对于上述每种总计比较,您还可以选择计算总值时忽略画布过滤条件,以在不应用观看者应用的过滤条件(例如控件)的情况下计算总值。总行数仍包含过滤条件属性。
示例
下表显示了将不同的“与总数比较”选项应用于订单价值字段的结果。这样一来,您就可以评估每个订单对总销售额的贡献。
| 商品 | 售出数量 | 订单价值 | 占总数的百分比 | 与总数的差值 | 与总数的百分比差值 |
|---|---|---|---|---|---|
| Pretty Bird 鸟食 | 20 |
31.96 | 12.79% | -217.85 | -87.21% |
| Healthy Dog 狗粮 | 16 | 79.96 | 32.01% | -169.85 | -67.99% |
| 顽皮的小狗玩具 | 11 | 17.97 | 7.19% | -231.84 | -92.81% |
| 鹦鹉栖架 | 8 | 74.97 | 30.01% | -174.84 | -69.99% |
| Happy Cat 猫薄荷 | 4 | 14.97 | 5.99% | -234.84 | -94.01% |
| Hungry Kitty 猫粮 | 3 | 29.98 | 12% | -219.83 | 88% |
| 总计 | 62 | 249.81 | 100% | 0 | 0% |
与最大值比较
您可以将每行数据与相应字段的最大值进行比较:
- 占最大值的百分比:显示当前行的值除以最大值所得的结果。
- 与最大值之间的差异显示当前行的值减去最大值的结果。
- 与最大值之间的百分比差异显示当前行的值减去最大值,然后除以最大值所得的结果。
示例
下表显示了将不同的“与最大值比较”选项应用于订单价值字段的结果。这样一来,您就可以了解每个订单与最大订单的比较情况。
| 商品 | 售出数量 | 订单价值 | 占最大值的百分比 | 与最大值之间的差异 | 与最大值之间的百分比差异 |
|---|---|---|---|---|---|
| Pretty Bird 鸟食 | 20 |
31.96 | 39.97% | -48 | -60.03% |
| Healthy Dog 狗粮 | 16 | 79.96 | 100% | 0 | 0% |
| 顽皮的小狗玩具 | 11 | 17.97 | 22.47% | -61.99 | -77.53% |
| 鹦鹉栖架 | 8 | 74.97 | 93.76% | -4.99 | -6.24% |
| Happy Cat 猫薄荷 | 4 | 14.97 | 18.72% | -64.99 | -81.28% |
| Hungry Kitty 猫粮 | 3 | 29.98 | 37.49% | -49.98 | -62.51% |
相对比较
如果图表中包含比较日期范围,您可以将比较功能应用于基本数据或相应的比较日期范围。
例如,假设有一个时序图表,用于比较当前 28 天与之前 28 天的数据。当前时间段内会话数的最大值为 1,947(6 月 26 日)。上一个时间段的会话数最大值为 1,571(6 月 4 日)。
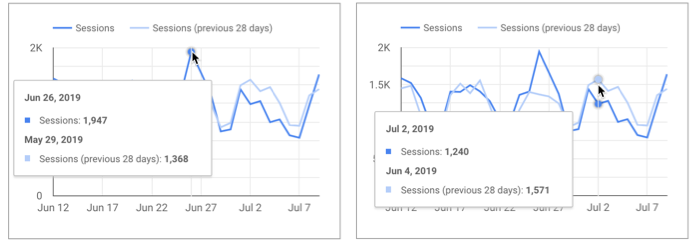
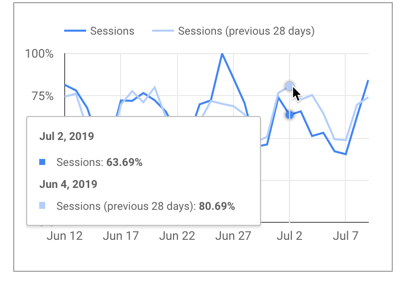
如果您相对于基本数据应用占最大值的百分比函数,那么上一个时间段的每个数据点都将除以当前时间段的最大值 (1,947)。对于 6 月 4 日的数据点,相对于基准数据的最大值百分比为:1571/1947 = 80.69%。
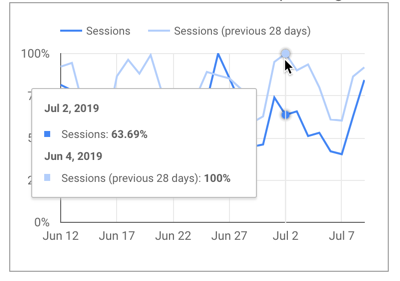
如果您改为应用相对于相应数据的最大值百分比函数,那么前期中的每个数据点都将除以前期的最大值 (1,571)。对于 6 月 4 日的数据点,相对于相应数据的最大值百分比为:1571/1571 = 100%。
应用层递计算
运行计算功能可计算一系列值的汇总结果。滚动计算会为输入的每一行返回一个值,表示该行与整个集合的关系。
以下示例展示了如何将两个正在进行的计算应用于用户数指标:
- 累计总和
- 跑步增量
示例
| 日期 | 源代码 | 用户 | 用户累计总数 | 用户数量的运行增量 |
|---|---|---|---|---|
| 2018 年 5 月 7 日 | 1,400 | 1,400 | 1,400 | |
| 2018 年 5 月 8 日 | 1,856 | 3,256 | 456 | |
| 2018 年 5 月 9 日 | 1,748 | 5,004 | -108 | |
| 2018 年 5 月 10 日 | 2,046 | 7,050 | 298 | |
| 2018 年 5 月 11 日 | 1,497 | 8,547 | -549 | |
| 2018 年 5 月 12 日 | 1,094 | 9,641 | -403 |
点击此处查看演示报告。
Looker Studio 支持以下滚动计算:
- 累计总和
- 跑步平均值
- 跑步分钟数
- 效果最大化广告系列
- 层递计数
- 运行增量
- 运行百分比增量
应用层递计算
- 修改报告。
选择图表。 3. 在属性面板中,选择设置标签页。
向图表中添加指标,然后点击 “修改”选项。
点击运行计算菜单,然后选择一个函数。
如需移除运行计算,请将运行计算选项更改为无。
如需在同一图表中显示原始指标以及指标比较或滚动计算结果,请从可用字段面板中拖动原始指标,以添加原始指标的第二个实例。(您无法使用指标或维度选择器添加重复字段。)
运行计算与计算字段之间的区别
计算字段会逐行处理图表中的数据。运行计算可跨行进行,因此您可以轻松展示复杂的数据关系,而无需在数据集中编写自定义 SQL 查询。如果要在数据源的计算字段中复制此类查询,难度会很大,甚至不可能。
不过,与计算字段不同的是,您无法修改正在进行的计算的公式。
比较指标的限制
归入“其他”选项与比较指标不兼容。如需在图表中使用比较指标,请停用归入“其他”选项。