See the supported connectors for Application Integration.
Use Application Integration dashboard
The Monitoring page in Application Integration provides a predefined monitoring dashboard to view some of the key performance and usage metrics of your integrations in your Google Cloud project. All the metrics presented in the predefined dashboard are ingested from Cloud Monitoring.
Using the Monitoring page, you can:
- View and monitor key performance and usage metrics, both at an integration level and at a project level.
- Analyze historical performance.
- Filter the metrics based on the available attributes.
- Display metrics for a specific time duration.
- Create customized metric dashboards.
Use the predefined dashboard
The predefined dashboard contains a set of curated widgets and charts to help you get a comprehensive view of your integration performance and data usage. For information about how to customize the predefined dashboard, see Customize dashboard.
To view the predefined dashboard, do the following:
- In the Google Cloud console, go to the Application Integration page.
- In the navigation menu, click Monitoring.
- In the Monitoring page, click the Dashboard drop-down menu and select Predefined.
The predefined dashboard apperas displaying the predefined charts.
Predefined charts
You can view the following widgets and charts in the predefined dashboard:
| Charts category | Chart Name | Description |
|---|---|---|
| Integration Performance | Successful executions (per hour) | Number of successful integration executions per hour. |
| Execution failures (per minute) | Number of integration execution failures per minute. | |
| Average integration execution time (per hour) | The average time, in milliseconds (ms), it takes an integration to complete an execution. Execution latencies are calculated by the minute. | |
| Step (Trigger/Task) Performance | Successful step executions (per hour) | Number of successful step (task/trigger) executions per hour. |
| Task execution failures (per minute) | Number of unsuccessful task executions per minute. | |
| Average task execution time (per hour) | The average time, in milliseconds (ms), it takes a task to complete an execution. Task execution latencies are calculated by the minute. | |
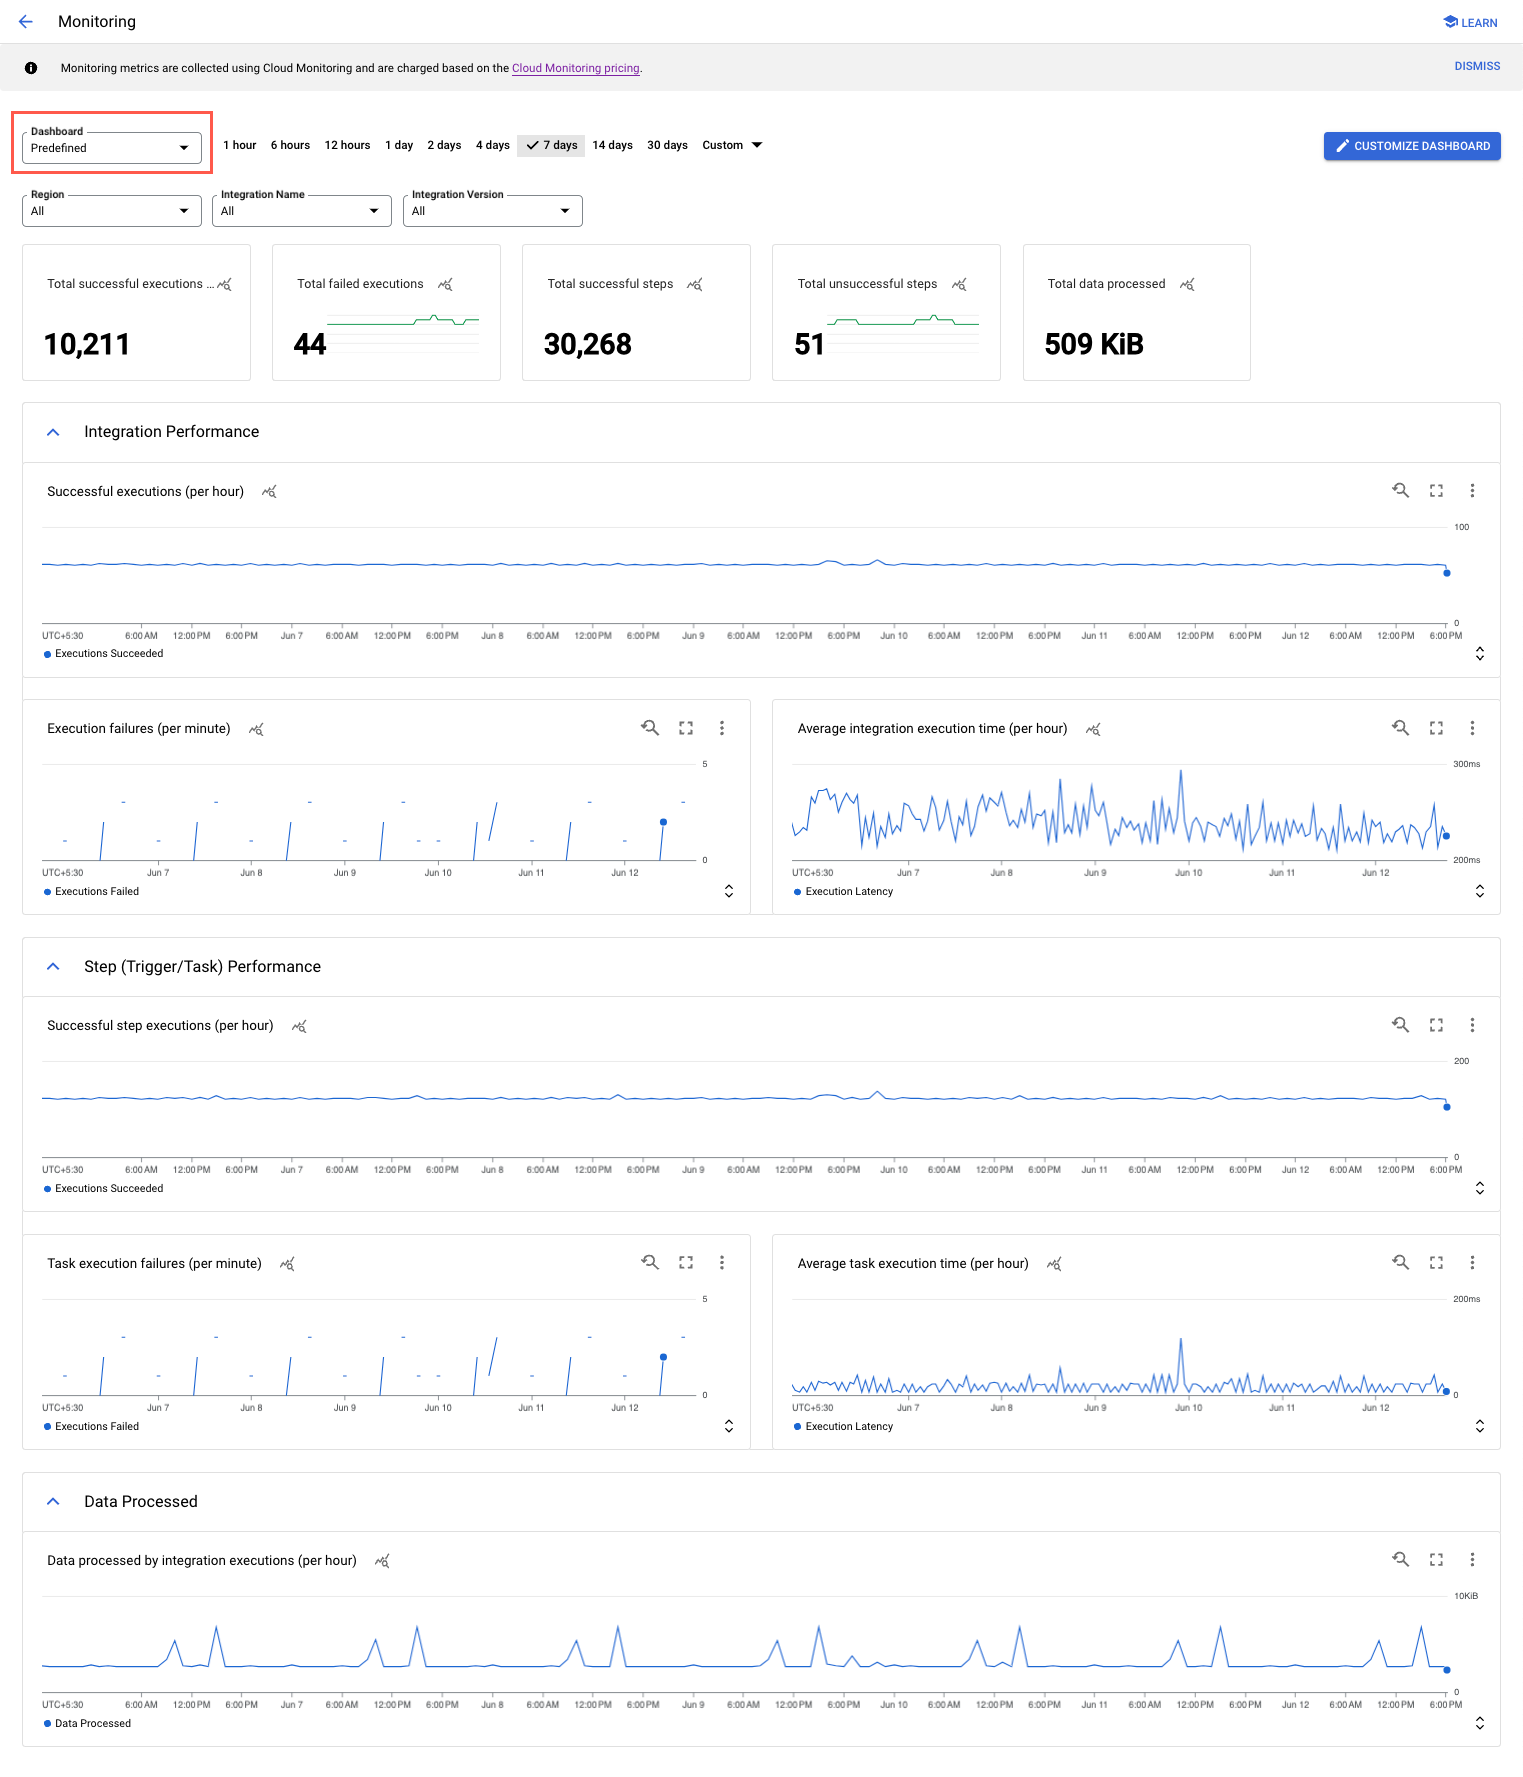
| Data Processed | Data processed by integration executions (per hour) | The amount of data processed during integration executions. |
The following image shows a sample predefined dashboard:
Customized dashboards
To customize the default predefined deashboard in Application Integration, perform the following steps:
- In the Google Cloud console, go to the Application Integration > Monitoring page.
- Click Customize dashboard.
You are redirected to the Cloud Monitoring > Dashboards page that is pre-populated with the predefined widgets and charts from Application Integration.
- Customized your dashboard using the available charts and widgets in the Chart library.
- Click Save.
Once saved, the customized dashboard is exported to Application Integration. To view your customized dashboard, go back to the Application Integration >Application Integration>Monitoring page, click the Dashboard drop-down menu and select Customized.
View metrics in Metrics Explorer
To view any of the metric charts in the Cloud Monitoring Metric Explorer, go to the desired chart, click (Actions menu) and select View in Metrics Explorer.
Using the Metric Explorer, you can build temporary metric charts to visualize the available resource metrics for your Google Cloud project. Once you have created a metric chart, if desired, you can also save it to a custom monitoring dashboard.
You can also select filters, group by metric labels, perform aggregations, and select chart viewing options using the Metric Explorer. For more information, see Create charts with Metrics Explorer.
Filters and time range
The Monitoring page let's you to filter the metrics based on one or more of the following attributes:
- Region: Region of the integration.
- Integration Name: Name of the integration.
- Integration Version: Version of the integration.
You can configure the dashboard to display metrics for a specific time range. For example, you can choose to view the metrics gathered in the past few hours, days, or a custom time period.
To configure the time range, you can either select the specific time periods such as last 30 minutes, last 1 hour or last 6 hours, or you click the Custom drop-down and select the required time value, and click Apply.
Considerations
- Monitoring metrics are generated only for published integrations.
- Step execution count metrics won't be computed for tasks that are skipped during the execution of an integration.
- All the performance metric data that is diaplayed in the Monitoring dashboards are for informational purpose only. The aggregated performance metric data might not be 100% accurate.
- Cloud Monitoring metric values must not be used to calculate billing costs.