Cloud Monitoring 提供的「服務總覽」儀表板,可讓您一覽所有服務。「服務總覽」資訊主頁也是其他服務監控工作進入點。
本頁面說明 Google Cloud 控制台「服務總覽」資訊主頁的摘要資訊。您可以在這個資訊主頁中執行下列操作:
查看服務狀態,並深入查看任何一項服務的詳細資料。
修改服務設定:
- 針對 Cloud Service Mesh、Google Kubernetes Engine 上的 Istio 和 App Engine 上的服務,您可以使用標準可用性和延遲指標定義服務等級目標 (SLO)。
- 如要使用自訂服務,您可以執行下列操作:
- 建立新的自訂服務。
- 找出要用來做為服務水準指標 (SLI) 的指標。
- 根據這些服務水準指標定義服務等級目標。
- 設定警告政策,在效能未達到服務等級目標時通知您。
如要瞭解設定工作,請參閱以下資訊:
您也可以使用 Monitoring API 透過程式輔助方式管理服務。詳情請參閱「使用 API」。
事前準備
如要瞭解服務監控,您必須熟悉服務水準指標 (SLI)、SLO、錯誤預算和以 SLO 為基礎的快訊政策等概念。這些概念已在其他頁面中說明,例如:
如需服務水準指標、服務等級目標和錯誤預算的簡介,請參閱「Service Monitoring 中的概念」。
如要瞭解以服務等級目標為準的快訊政策,請參閱「消耗率快訊」。
「服務總覽」資訊主頁
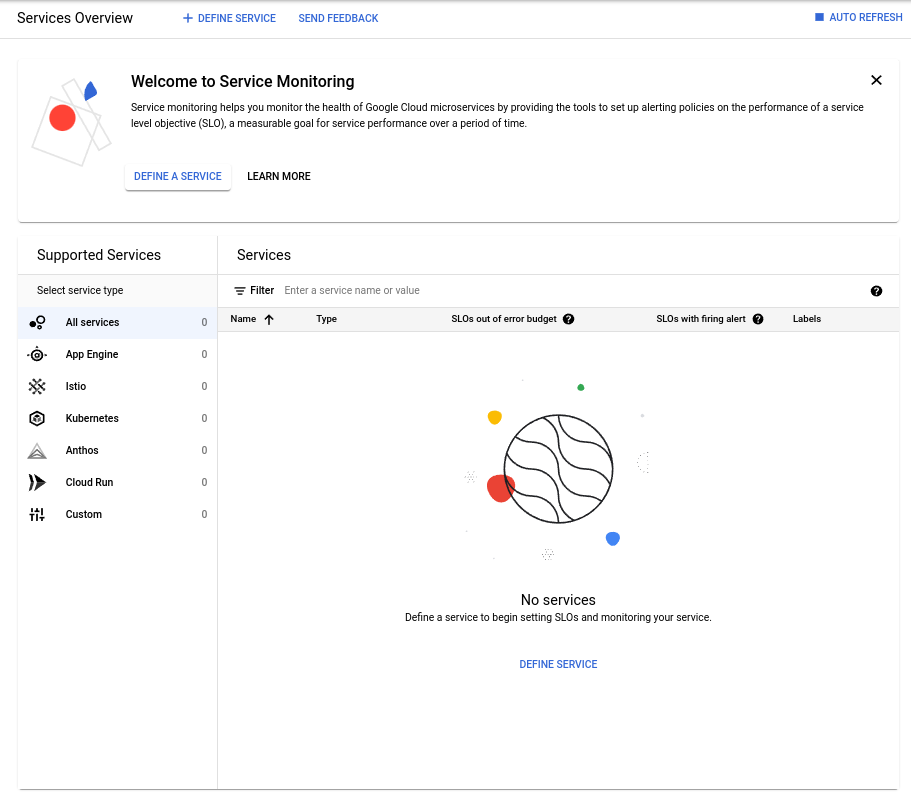
「服務總覽」資訊主頁會提供專案中所有服務的摘要檢視畫面,包括這些服務的健康狀態基本資訊。
在 Google Cloud 控制台中,前往 ![]() 「SLOs」頁面:
「SLOs」頁面:
如果您是使用搜尋列尋找這個頁面,請選取子標題為「Monitoring」的結果。
如果您尚未建立任何服務,服務總覽會顯示歡迎訊息和空白的服務清單:
建立服務後,「服務總覽」頁面會顯示下列資訊:
「目前狀態」摘要,顯示服務狀態的總覽。如要瞭解這個區域,請參閱「服務摘要」。
庫存表「服務」:顯示各項服務的相關資訊。根據預設,表格會顯示所有服務,但您可以篩選表格,只顯示特定的服務群組。如要瞭解這份表格中的資訊,請參閱「商品型錄表格」。
「支援的服務」清單,可將您定義的服務分類。您可以使用這份清單限制「服務」表格中顯示的內容。在清單中選取服務類型後,表格只會顯示該類型的服務。
服務摘要
摘要資訊卡會顯示服務數量,並提供服務的健康狀態和設定資訊:
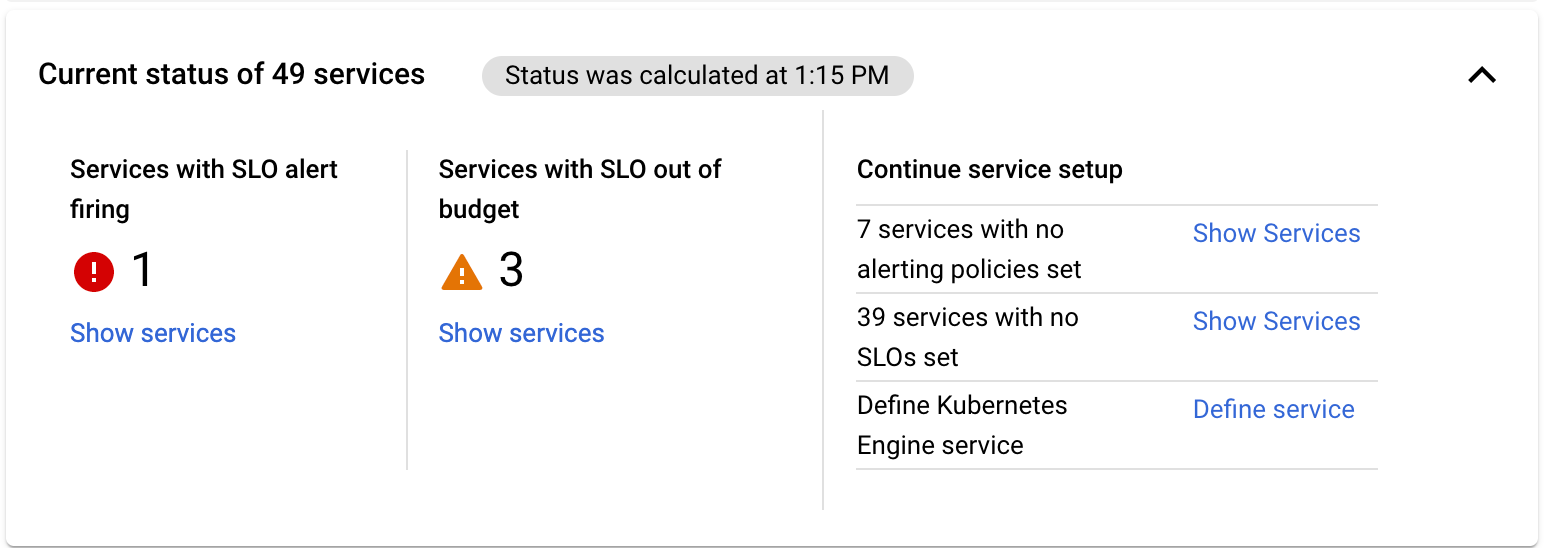
摘要資訊卡上顯示的資訊包括:
- 找到的服務數量。
- 指示摘要資訊收集時間的時間戳記。
- 啟動服務水準目標警告的服務數量。
- 超出服務等級目標預算的服務數量。
- 提供其他設定選項的服務。
如果有服務觸發服務水準目標警報或用盡錯誤預算,摘要資訊卡會顯示計數,並提供「顯示服務」選項。點選「Show services」(顯示服務) 即可篩選商品目錄表格,只顯示受影響的服務。
如果有未定義服務水準目標或快訊政策的服務,摘要資訊卡會說明這些服務,並提供「Show Services」選項。按一下「Show Services」,即可篩選商品目錄表格,只顯示這些服務。摘要資訊卡隨後會提供「瞭解詳情」選項,說明 SLO 或快訊政策。
如果您有沒有關聯自訂服務的 GKE 實體,摘要資訊卡會提供「Define Service」選項。詳情請參閱「定義微服務」。
商品目錄表
「服務總覽」商品目錄表格會為每項服務新增一列,如以下螢幕截圖所示:

庫存表格會針對表格中列出的每項服務提供下列資訊:
名稱:服務的顯示名稱。
按一下服務名稱,即可開啟該服務的資訊主頁。詳情請參閱「使用微服務資訊主頁」。
Type:下列任一值:
Istio:自動偵測到的 Istio on Google Kubernetes Engine 或 Cloud Service Mesh 服務。App Engine:自動偵測到的 App Engine 服務。Custom:GKE 服務。
超出錯誤預算的服務水準目標:超出預算的服務水準目標與服務水準目標總數的比率。我們也會為超出預算的服務等級目標加上徽章,讓這些服務在表格中更顯眼。
已觸發快訊的服務等級目標:已觸發的警告政策與警告政策總數的比率。我們也會為設有觸發政策的服務加上徽章,讓這些服務在表格中更顯眼。
標籤:服務相關資訊。顯示的資訊類型會因服務類型而異。
more_vert「更多選項」:列出您可以對服務進行的變更。選項會因服務類型而異:
- 編輯顯示名稱:適用於所有服務類型。
- 刪除服務:僅適用於自訂服務。
根據預設,商品目錄表會納入專案中的所有服務,但您可以篩選表格來減少項目數量。您可以依據「服務摘要」一節的說明,從摘要資訊卡的選項篩選表格,也可以直接篩選表格。
篩選廣告空間表
您可以透過下列方式篩選廣告空間表格:
按一下「Supported Services」清單中的其中一個服務類型項目。
如「服務摘要」一節所述,只要點選摘要資訊卡中的「顯示服務」選項即可。
在商品目錄表格中手動新增篩選器。
如要手動在廣告空間表格中新增篩選器,請按照下列步驟操作:
按一下 filter_list「篩選器」。系統會顯示篩選器選項清單:
- 名稱:依服務水準目標名稱篩選。
- 類型:依服務水準目標類型篩選。
- 標籤:依服務標籤的值篩選。
- 服務水準目標數量:依設定的服務水準目標數量進行篩選。
- 服務水準目標警告政策數量:依據已設定的以服務水準目標為準警告政策數量進行篩選。
從篩選器清單中選擇其中一個選項。所選選項會顯示在篩選列中。
完成篩選器的方式會因所選選項而異:
如果選取「類型」,系統會列出可用的服務類型。從清單中選取類型。
如果選取「名稱」或「標籤」,請按一下篩選列中文字旁邊的圖示,然後開始輸入。系統會在清單中提供相符的值。從清單中選取所需值。
如果選取「SLO 計數」或「SLO 警示政策計數」,系統會列出可供選擇的比較運算子。
- 選取運算子。
- 按一下運算子旁邊的按鈕,然後輸入比較值。
完成的篩選器會由篩選器方塊取代。舉例來說,下列方塊篩選器會篩選已設定 2 個以下以服務等級目標為準的快訊政策的服務:

如要新增多項篩選條件,請重複上述步驟。新增一個篩選器後,篩選器選項選單也會顯示 OR 選項,用於評估篩選器。根據預設,服務必須符合所有篩選條件的邏輯 AND,才能顯示在資料表中。
如要移除篩選器,請按一下篩選器方塊上的 close。
後續步驟
如要瞭解服務設定工作,請參閱以下內容:
如要瞭解各服務的資訊主頁,請參閱「使用微服務資訊主頁」。