本文說明如何設定及使用 Ops Agent 指標接收器,從 Compute Engine 上的 Prometheus 收集指標。本文也會說明可供您試用接收器的範例。
Google Kubernetes Engine 使用者可透過 Google Cloud Managed Service for Prometheus 收集 Prometheus 指標。Compute Engine 使用者可透過 Ops Agent Prometheus 接收器,享有相同功能。
您可以透過 Cloud Monitoring 提供的所有工具 (包括 PromQL),查看及分析 Prometheus 接收器收集的資料。 舉例來說,您可以按照「Google Cloud Monitoring 的控制台」一文所述,使用 Metrics Explorer 查詢資料。您也可以建立 Cloud Monitoring 資訊主頁和快訊政策,監控 Prometheus 指標。建議您使用 PromQL 做為 Prometheus 指標的查詢語言。
您也可以在 Cloud Monitoring 以外的介面中查看 Prometheus 指標,例如 Prometheus UI 和 Grafana。
選擇合適的接收器
決定使用 Prometheus 接收器前,請先確認您使用的應用程式是否已整合作業套件代理程式。如要瞭解作業套件代理程式的現有整合服務,請參閱「監控第三方應用程式」。如果已有整合方案,建議使用該方案。詳情請參閱「選擇現有的整合服務」。
如果符合下列條件,建議使用 Ops Agent Prometheus 接收器:
您有使用 Prometheus 的經驗、依賴 Prometheus 標準,並瞭解擷取間隔和基數等因素如何影響費用。詳情請參閱「選擇 Prometheus 接收器」一文。
您監控的軟體不屬於現有的作業套件代理程式整合。
現有整合項目
作業套件代理程式提供多種第三方應用程式的整合功能。這些整合項目可為您提供下列功能:
- 應用程式的一組所選
workload.googleapis.com指標 - 用來顯示指標的資訊主頁。
透過現有整合功能擷取的指標,會根據代理程式收集的指標量 (以位元組為單位) 計費。如要瞭解這項定價,請參閱「根據擷取的位元組數計費的指標」。指標的數量和類型會事先得知,您可以利用這些資訊估算費用。
舉例來說,如果您使用 Apache 網路伺服器 (httpd) 整合,Ops Agent 會收集 5 個純量指標,每個資料點算做 8 個位元組。如果保留 Ops Agent 預設的 60 秒取樣頻率,每天擷取的位元組數為 57,600 * 主機數:
- 8 (位元組) * 1440 (每天的分鐘數) * 5 (指標) * n (主機),或
- 57,600 * n (主機)
如要進一步瞭解如何估算費用,請參閱依據擷取的位元組數計費示例。
Prometheus 接收器
使用作業套件代理程式收集 Prometheus 指標時,請注意下列事項:
應用程式發出的指標數量和基數由您控管。沒有精選指標集。您擷取的資料量取決於 Prometheus 應用程式和作業套件代理程式 Prometheus 接收器的設定。
指標會以
prometheus.googleapis.com指標的形式擷取至 Cloud Monitoring。擷取至 Cloud Monitoring 時,這些指標會歸類為「自訂」指標類型,並適用於自訂指標的配額和限制。您必須根據擷取的指標組合和業務需求,設計及建立所需的 Cloud Monitoring 資訊主頁。如要瞭解如何建立資訊主頁,請參閱「資訊主頁和圖表」一文。
指標擷取費用是根據擷取的樣本數計費。如要估算使用 Prometheus 接收器的費用,您必須判斷在一個帳單週期內可能收集的樣本數。預估值是依據下列因素計算得出:
- 純量指標數量;每個值都是一個樣本
- 分布指標數量;每個直方圖會計為 (2 + 直方圖中的值區數量) 個樣本
- 各項指標的取樣頻率
- 指標取樣的主機數量
如要進一步瞭解如何計算樣本數量和估算費用,請參閱根據擷取的樣本計費示例。
必要條件
如要使用 Prometheus 接收器收集 Prometheus 指標,請安裝作業套件代理程式 2.25.0 以上版本。
作業套件代理程式接收器需要發出 Prometheus 指標的端點。因此,應用程式必須直接提供這類端點,或使用 Prometheus 程式庫或匯出工具公開端點。許多程式庫和語言架構 (例如 Spring 和 DropWizard),或是應用程式 (例如 StatsD、DogStatsD 和 Graphite) 會發出非 Prometheus 指標,但可以使用 Prometheus 用戶端程式庫或匯出工具發出 Prometheus 樣式的指標。舉例來說,如要發出 Prometheus 指標:
- Spring 使用者可以運用 Spring Metrics 程式庫。
- StatsD 使用者可以採用
statsd_exporter套件。 - Graphite 使用者可以採用
graphite_exporter套件。
應用程式發出 Prometheus 指標時 (直接發出或使用程式庫/匯出工具),作業套件代理程式可透過設定的 Prometheus 接收器收集指標。
設定作業套件代理程式
作業套件代理程式設定模型通常需要定義下列項目:
- 接收器:決定要收集哪些指標。
- 處理器:說明 Ops Agent 如何修改指標。
- 管道:將接收器和處理器連結至服務。
擷取 Prometheus 指標的設定略有不同,不涉及任何處理器。
Prometheus 指標的設定
設定作業套件代理程式來擷取 Prometheus 指標,與一般設定不同,如下所示:
您不會為 Prometheus 指標建立作業套件代理程式處理器。Prometheus 接收器支援 Prometheus
scrape_config規格指定的所有設定選項,包括重新標記選項。系統會使用 Prometheus 接收器中指定的抓取設定
relabel_configs和metric_relabel_configs區段,完成所有指標處理作業,而非使用作業套件代理程式處理器。詳情請參閱「重新標記:修改要擷取的資料」。您只能根據 Prometheus 接收器定義 Prometheus 管道。您未指定任何處理器。此外,您也無法在 Prometheus 指標的管道中使用任何非 Prometheus 接收器。
接收器設定的大部分內容都是擷取設定選項的規格。為簡潔起見,省略這些選項後,以下顯示使用 Prometheus 接收器的作業套件代理程式設定結構。您要指定 RECEIVER_ID 和 PIPELINE_ID 的值。
metrics:
  receivers:
    RECEIVER_ID:
      type: prometheus
      config:
        scrape_configs:
          [... omitted for brevity ...]

  service:
    pipelines:
      PIPELINE_ID:
        receivers: [RECEIVER_ID]
下一節將詳細說明 Prometheus 接收器。如需接收器和管道的實用範例,請參閱新增 Ops Agent 接收器和管道。
Prometheus 接收器
如要指定 Prometheus 指標的接收器,請建立 prometheus 類型的指標接收器,並指定一組 scrape_config 選項。接收器支援所有 Prometheus scrape_config 選項,但下列選項除外:
- 服務探索部分,
*_sd_config。 honor_labels設定。
因此,您可以複製現有的擷取設定,並用於 Ops Agent,幾乎不必修改。
Prometheus 接收器的完整結構如下所示:
metrics:
  receivers:
    prom_application:
      type: prometheus
      config:
        scrape_configs:
          - job_name: 'STRING' # must be unique across all Prometheus receivers
            scrape_interval: # duration, like 10m or 15s
            scrape_timeout:  # duration, like 10m or 15s
            metrics_path: # resource path for metrics, default = /metrics
            honor_timestamps: # boolean, default = false
            scheme: # http or https, default = http
            params:
              - STRING: STRING
            basic_auth:
              username: STRING
              password: SECRET
              password_file: STRING
            authorization:
              type: STRING # default = Bearer
              credentials: SECRET
              credentials_file: FILENAME

            oauth2: OAUTH2 # See Prometheus oauth2
            follow_redirects: # boolean, default = true
            enable_http2: # boolean, default = true
            tls_config: TLS_CONFIG # See Prometheus tls_config
            proxy_url: STRING

            static_configs:
              STATIC_CONFIG # See Prometheus static_config
            relabel_configs:
              RELABEL_CONFIG # See Prometheus relabel_config
            metric_relabel_configs:
              METRIC_RELABEL_CONFIGS # See Prometheus metric_relabel_configs
如需重新標記設定的範例,請參閱「其他接收器設定」。
範例:設定 Prometheus 適用的作業套件代理程式
本節將舉例說明如何設定作業套件代理程式,從應用程式收集 Prometheus 指標。這個範例使用 Prometheus 社群提供的 JSON Exporter (json_exporter),該工具會在通訊埠 7979 公開 Prometheus 指標。
設定範例需要下列資源,您可能需要安裝這些資源:
gitcurlmakepython3- Go 語言,1.19 以上版本
建立或設定應用程式
如要取得並執行 JSON 匯出工具,請按照下列步驟操作:
複製
json_exporter存放區,然後執行下列指令來查看匯出工具:git clone https://github.com/prometheus-community/json_exporter.git cd json_exporter git checkout v0.5.0
執行下列指令來建構匯出工具:
make build
執行下列指令,啟動 Python HTTP 伺服器:
python3 -m http.server 8000 &
執行下列指令,啟動 JSON 匯出工具:
./json_exporter --config.file examples/config.yml &
查詢 JSON 匯出工具,確認該工具正在執行,並在通訊埠 7979 上公開指標:
curl "http://localhost:7979/probe?module=default&target=http://localhost:8000/examples/data.json"
如果查詢成功,您會看到類似下列內容的輸出:
# HELP example_global_value Example of a top-level global value scrape in the json
# TYPE example_global_value untyped
example_global_value{environment="beta",location="planet-mars"} 1234
# HELP example_value_active Example of sub-level value scrapes from a json
# TYPE example_value_active untyped
example_value_active{environment="beta",id="id-A"} 1
example_value_active{environment="beta",id="id-C"} 1
# HELP example_value_boolean Example of sub-level value scrapes from a json
# TYPE example_value_boolean untyped
example_value_boolean{environment="beta",id="id-A"} 1
example_value_boolean{environment="beta",id="id-C"} 0
# HELP example_value_count Example of sub-level value scrapes from a json
# TYPE example_value_count untyped
example_value_count{environment="beta",id="id-A"} 1
example_value_count{environment="beta",id="id-C"} 3
在這個輸出內容中,
example_value_active等字串是指標名稱,標籤和值則位於大括號中。資料值會遵循設定的標籤。
新增作業套件代理程式接收器和管道
如要設定 Ops Agent 從 JSON Exporter 應用程式擷取指標,請修改代理程式設定,加入 Prometheus 接收器和管道。如要查看 JSON 匯出工具範例,請按照下列步驟操作:
編輯 Ops Agent 設定檔
/etc/google-cloud-ops-agent/config.yaml,並新增下列 Prometheus 接收器和管道項目:metrics: receivers: prometheus: type: prometheus config: scrape_configs: - job_name: 'json_exporter' scrape_interval: 10s metrics_path: /probe params: module: [default] target: [http://localhost:8000/examples/data.json] static_configs: - targets: ['localhost:7979'] service: pipelines: prometheus_pipeline: receivers: - prometheus如果這個檔案中已有其他設定項目,請將 Prometheus 接收器和管道新增至現有的
metrics和service項目。詳情請參閱「指標設定」。如需接收器中重新標記設定的範例,請參閱「其他接收器設定」。
重新啟動作業套件代理程式
如要套用設定變更,請重新啟動 Ops Agent。
Linux
如要重新啟動代理程式,請在執行個體上執行下列指令:
sudo service google-cloud-ops-agent restart
如要確認代理程式已重新啟動,請執行下列指令,並驗證「指標代理程式」和「Logging 代理程式」元件是否已啟動:
sudo systemctl status google-cloud-ops-agent"*"
Windows
使用遠端桌面協定或類似工具連線至執行個體,並登入 Windows。
以滑鼠右鍵按一下 PowerShell 圖示,然後選取「以系統管理員身分執行」,開啟具有管理員權限的 PowerShell 終端機。
如要重新啟動代理程式,請執行下列 PowerShell 指令:
Restart-Service google-cloud-ops-agent -Force
如要確認代理程式已重新啟動,請執行下列指令,並驗證「指標代理程式」和「Logging 代理程式」元件是否已啟動:
Get-Service google-cloud-ops-agent*
Cloud Monitoring 中的 Prometheus 指標
您可以搭配使用 Cloud Monitoring 提供的工具與 Prometheus 接收器收集的資料。舉例來說,您可以使用 Metrics Explorer 繪製資料圖表,如「Google Cloud Monitoring 的控制台」一文所述。以下各節說明 Cloud Monitoring 中可透過 Metrics Explorer 使用的查詢工具:
您可以為指標建立 Cloud Monitoring 資訊主頁和快訊政策。如要瞭解資訊主頁和可使用的圖表類型,請參閱「資訊主頁和圖表」。如要瞭解快訊政策,請參閱使用快訊政策。
您也可以在其他介面 (例如 Prometheus UI 和 Grafana) 中查看指標。如要瞭解如何設定這些介面,請參閱 Google Cloud Managed Service for Prometheus 說明文件的下列章節:
使用 PromQL
建議使用 PromQL 查詢語言,查詢透過 Prometheus 接收器擷取的指標。
如要驗證 Prometheus 資料是否已擷取,最簡單的方法是使用 Google Cloud 控制台中的 Cloud Monitoring Metrics Explorer 頁面:
-
前往 Google Cloud 控制台的 leaderboard「Metrics Explorer」頁面:
如果您是使用搜尋列尋找這個頁面,請選取子標題為「Monitoring」的結果。
在查詢建構工具窗格的工具列中,選取名稱為 code MQL 或 code PromQL 的按鈕。
確認已在「Language」(語言) 切換按鈕中選取「PromQL」。語言切換按鈕位於同一工具列,可供你設定查詢格式。
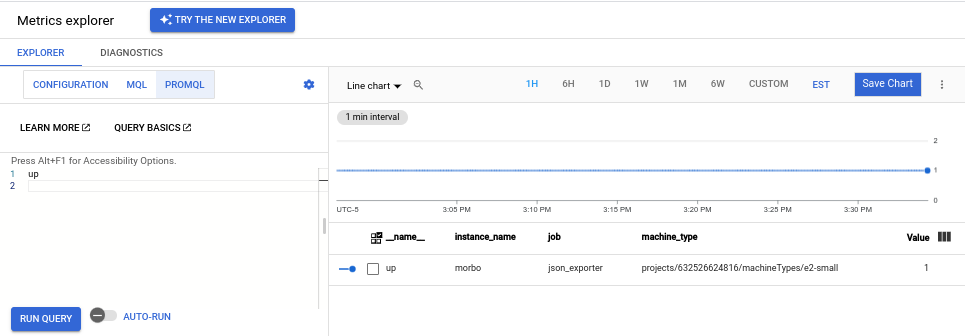
在編輯器中輸入以下查詢,然後點選「執行查詢」:
up
如果系統正在擷取資料,您會看到類似下方的圖表:
如果您執行 JSON Exporter 範例,也可以發出下列查詢:
依名稱查詢特定匯出指標的所有資料,例如:
example_value_count
下圖顯示
example_value_count的圖表,包括 JSON 匯出應用程式定義的標籤,以及 Ops Agent 新增的標籤: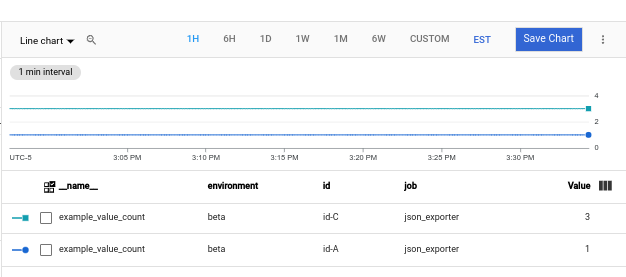
查詢特定命名空間中匯出指標的資料。
namespace標籤的值是 Compute Engine 執行個體 ID,也就是指派給 VM 的長數字,例如5671897148133813325。查詢如下所示:example_value_count{namespace="INSTANCE_ID"}查詢符合特定規則運算式的資料。JSON Exporter 會發出含有
id標籤的指標,標籤值包括id-A、id-B、id-C。如要篩選出任何具有符合此模式的id標籤的指標,請使用下列查詢:example_value_count{id=~"id.*"}
如要進一步瞭解如何在 Metrics Explorer 和 Cloud Monitoring 圖表中使用 PromQL,請參閱「在 Cloud Monitoring 中使用 PromQL」。
在 Cloud Monitoring 中查看指標用量和診斷資訊
Cloud Monitoring 的「指標管理」頁面提供相關資訊,可協助您控管可計費指標的支出金額,同時不影響可觀測性。「指標管理」頁面會回報下列資訊:
- 以位元組和樣本為準的計費方式,在指標網域和個別指標的擷取量。
- 指標的標籤和基數相關資料。
- 每個指標的讀取次數。
- 在警告政策和自訂資訊主頁中使用指標。
- 指標寫入錯誤率。
您也可以使用「指標管理」頁面排除不必要的指標,藉此省下擷取這些指標的費用。
如要查看「指標管理」頁面,請按照下列步驟操作:
-
前往 Google Cloud 控制台的 「指標管理」頁面:
如果您是使用搜尋列尋找這個頁面,請選取子標題為「Monitoring」的結果。
- 在工具列中選取時間範圍。根據預設,「指標管理」頁面會顯示前一天收集到的指標資訊。
如要進一步瞭解「指標管理」頁面,請參閱「查看及管理指標用量」。
重新標記:修改要擷取的資料
您可以在抓取目標之前,使用重新標記功能修改抓取目標或其指標的標籤集。如果重新標記設定中有多個步驟,系統會按照設定檔中的順序套用這些步驟。
作業套件代理程式會建立一組中繼標籤 (以字串 __meta_ 為前置字元的標籤)。這些中繼標籤會記錄執行作業套件代理程式的 Compute Engine 執行個體相關資訊。以 __ 字串為前置字元的標籤 (包括中繼標籤) 僅在重新標記期間提供。您可以透過重新標記,在擷取的標籤中擷取這些標籤的值。
指標重新標記會套用至樣本,這是擷取前的最後一個步驟。您可以透過指標重新標記,捨棄不需要擷取的時間序列;捨棄這些時間序列可減少擷取的樣本數量,進而降低成本。
如要進一步瞭解重新標記,請參閱 Prometheus 說明文件中的 relabel_config 和 metric_relabel_configs。
重新標記期間可用的 Compute Engine 中繼標籤
作業套件代理程式抓取指標時,會納入一組元標籤,這些標籤的值取決於代理程式執行的 Compute Engine VM 設定。您可以使用這些標籤和 Prometheus 接收器的 relabel_configs 區段,將額外中繼資料新增至指標,瞭解指標的擷取來源 VM。如需範例,請參閱「其他接收器設定」。
您可以在目標上使用下列中繼標籤,並在 relabel_configs 區段中套用:
__meta_gce_instance_id:Compute Engine 執行個體 (本機) 的數值 ID__meta_gce_instance_name:Compute Engine 執行個體的名稱 (本機);作業套件代理程式會自動將這個值放在指標的可變動instance_name標籤中。__meta_gce_machine_type:執行個體機器類型的完整或部分網址;Ops Agent 會自動將這個值放在指標的可變動machine_type標籤中。__meta_gce_metadata_NAME:例項的每個中繼資料項目__meta_gce_network:執行個體的網路網址__meta_gce_private_ip:執行個體的私人 IP 位址__meta_gce_interface_ipv4_NAME:每個具名介面的 IPv4 位址__meta_gce_project:執行個體執行的專案 (本機) Google Cloud__meta_gce_public_ip:執行個體的公開 IP 位址 (如有)__meta_gce_tags:以半形逗號分隔的執行個體標記清單__meta_gce_zone:執行個體執行的 Compute Engine 區域網址
Ops Agent 啟動時,系統會設定這些標籤的值。如果您修改值,則必須重新啟動 Ops Agent 才能重新整理值。
其他接收器設定
本節提供範例,說明如何使用 Prometheus 接收器的 relabel_configs 和 metric_relabel_configs 區段,修改擷取的指標數量和結構。本節也包含 JSON 匯出工具範例的修改版接收器,該接收器使用重新標記選項。
新增 VM 中繼資料
您可以使用 relabel_configs 區段,為指標新增標籤。
舉例來說,下列範例使用 Ops Agent 提供的 __meta_gce_zone 中繼標籤,建立在重新標記後仍會保留的指標標籤 zone,因為 zone 沒有 __ 前置字元。
如需可用中繼標籤的清單,請參閱重新標記期間可用的 Compute Engine 中繼標籤。預設作業套件代理程式設定會為您重新標記部分中繼標籤。
relabel_configs:
  - source_labels: [__meta_gce_zone]
    regex: '(.+)'
    replacement: '${1}'
    target_label: zone
範例:設定作業套件代理程式以收集 Prometheus 指標中顯示的 Prometheus 接收器,包含新增的標籤。
捨棄指標
您可以使用 metrics_relabel_configs 區段捨棄不想擷取的指標,這種模式有助於控制成本。舉例來說,您可以使用下列模式捨棄名稱符合 METRIC_NAME_REGEX_1 或 METRIC_NAME_REGEX_2 的任何指標:
metric_relabel_configs:
  - source_labels: [ __name__ ]
    regex: 'METRIC_NAME_REGEX_1'
    action: drop
  - source_labels: [ __name__ ]
    regex: 'METRIC_NAME_REGEX_2'
    action: drop
新增靜態標籤
您可以使用 metrics_relabel_configs 區段,將靜態標籤新增至 Prometheus 接收器擷取的所有指標。您可以使用下列模式,將標籤 staticLabel1 和 staticLabel2 新增至所有擷取的指標:
metric_relabel_configs:
  - source_labels: [ __address__ ]
    action: replace
    replacement: 'STATIC_VALUE_1'
    target_label: staticLabel1
  - source_labels: [ __address__ ]
    action: replace
    replacement: 'STATIC_VALUE_2'
    target_label: staticLabel2
下列 JSON 匯出工具範例的 Prometheus 接收器版本會使用這些設定模式執行下列操作:
- 從作業套件代理程式提供的
__meta_gce_zone中繼標籤值,設定zone標籤。 - 捨棄匯出工具的
example_global_value指標。 - 為所有擷取的指標新增
staticLabel標籤,並將值設為「A static value」。
metrics:
  receivers:
    prometheus:
        type: prometheus
        config:
          scrape_configs:
            - job_name: 'json_exporter'
              scrape_interval: 10s
              metrics_path: /probe
              params:
                module: [default]
                target: [http://localhost:8000/examples/data.json]
              static_configs:
                - targets: ['localhost:7979']
              relabel_configs:
                - source_labels: [__meta_gce_zone]
                  regex: '(.+)'
                  replacement: '${1}'
                  target_label: zone
              metric_relabel_configs:
                - source_labels: [ __name__ ]
                  regex: 'example_global_value'
                  action: drop
                - source_labels: [ __address__ ]
                  action: replace
                  replacement: 'A static value'
                  target_label: staticLabel