Qu'est-ce que la surveillance des applications ?
Application Monitoring vous permet de surveiller les ressources et l'infrastructure du point de vue d'une application. En d'autres termes, vous ne commencez pas une investigation en recherchant vos ressources et en déterminant celles qui sont utilisées par votre application. Au lieu de cela, vous commencez votre enquête avec votre application, puis vous recherchez des informations sur les ressources et l'infrastructure qu'elle utilise. Les tableaux de bord générés par la surveillance des applications pour votre application vous permettent de comprendre l'état opérationnel de votre application, ainsi que de ses services et charges de travail.
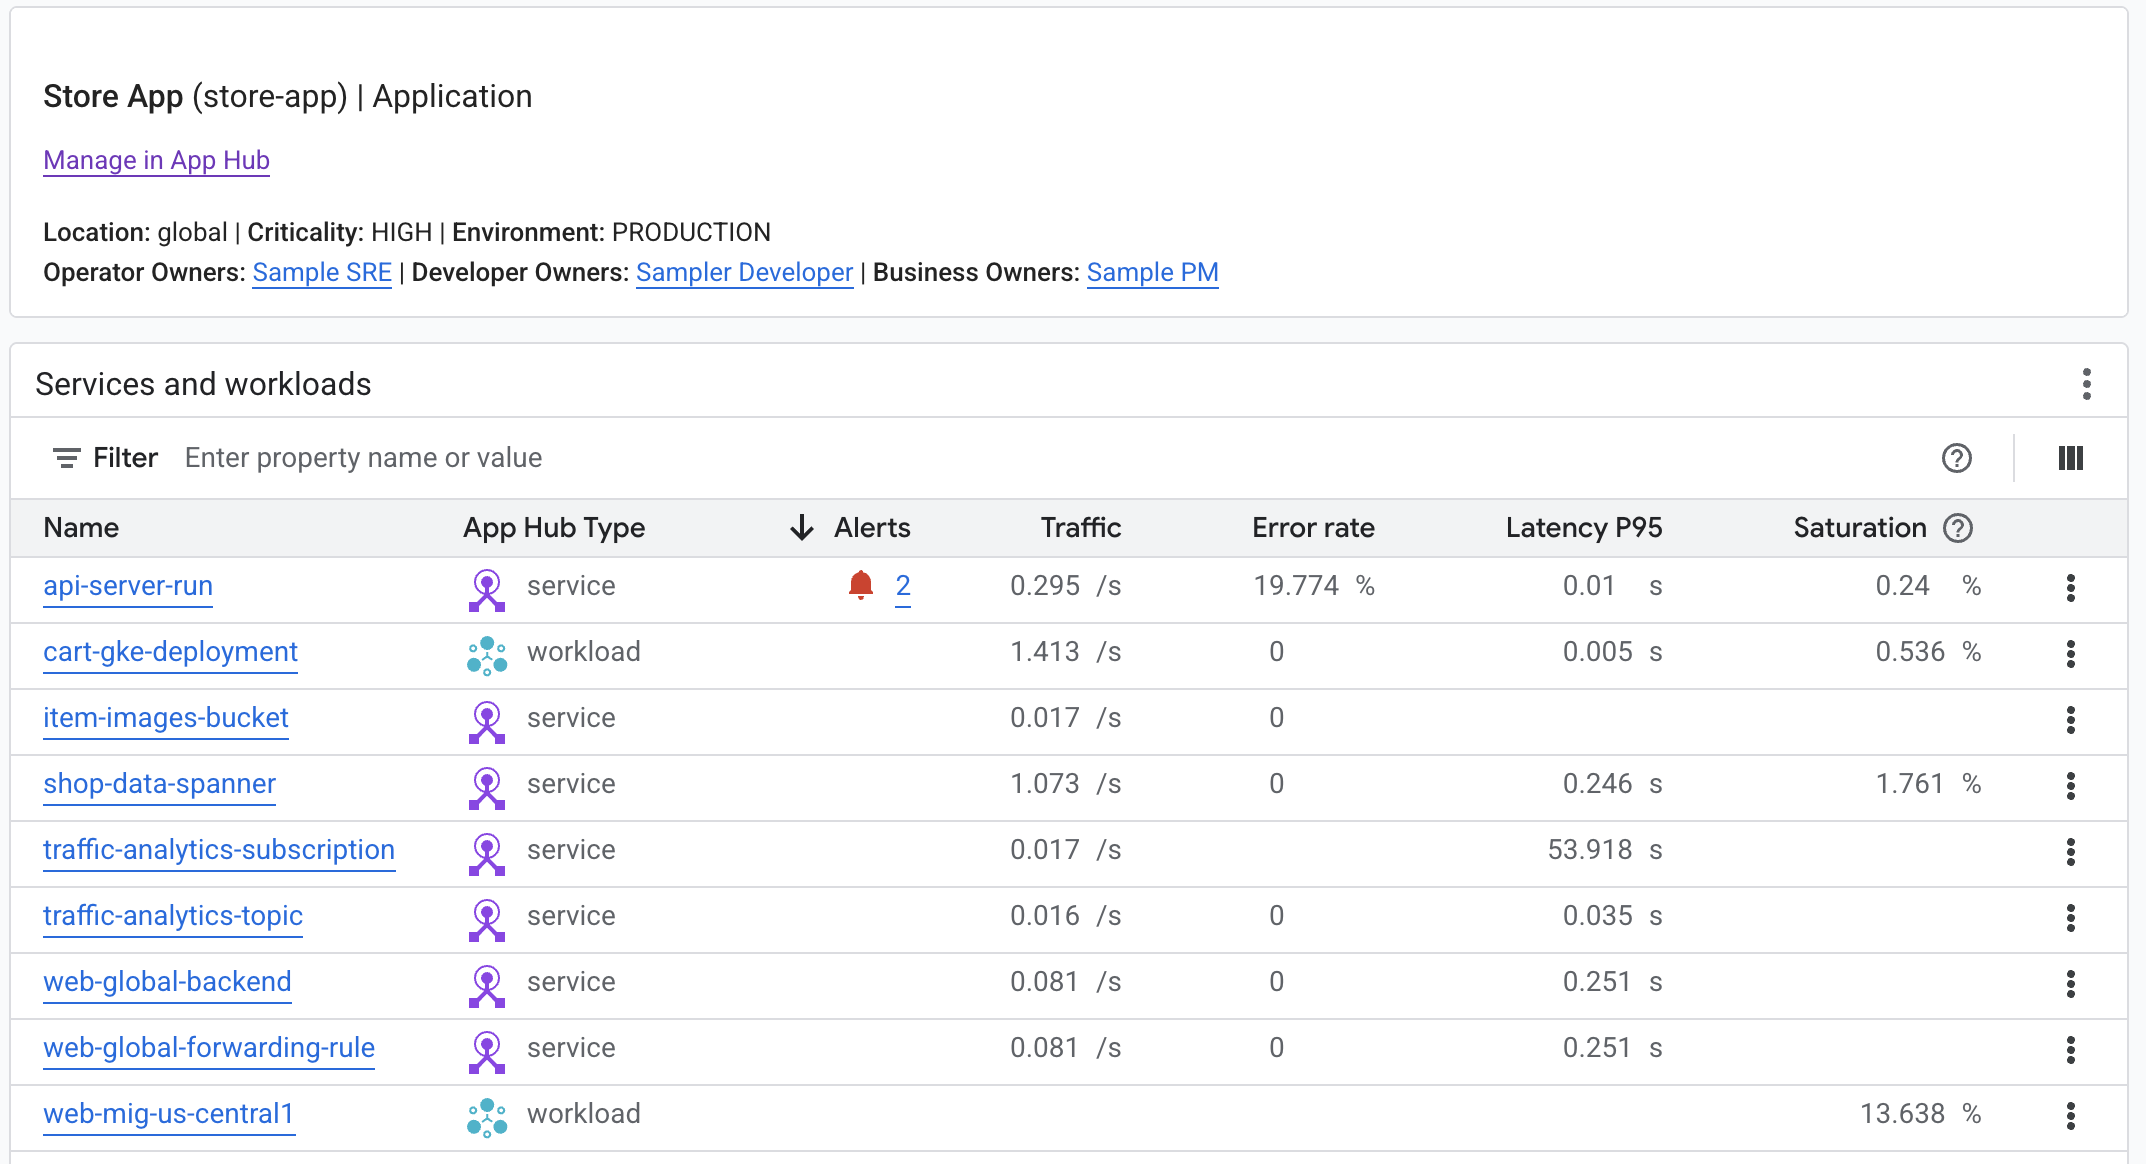
Par exemple, la capture d'écran suivante montre les informations récapitulatives fournies par Application Monitoring pour une application spécifique :
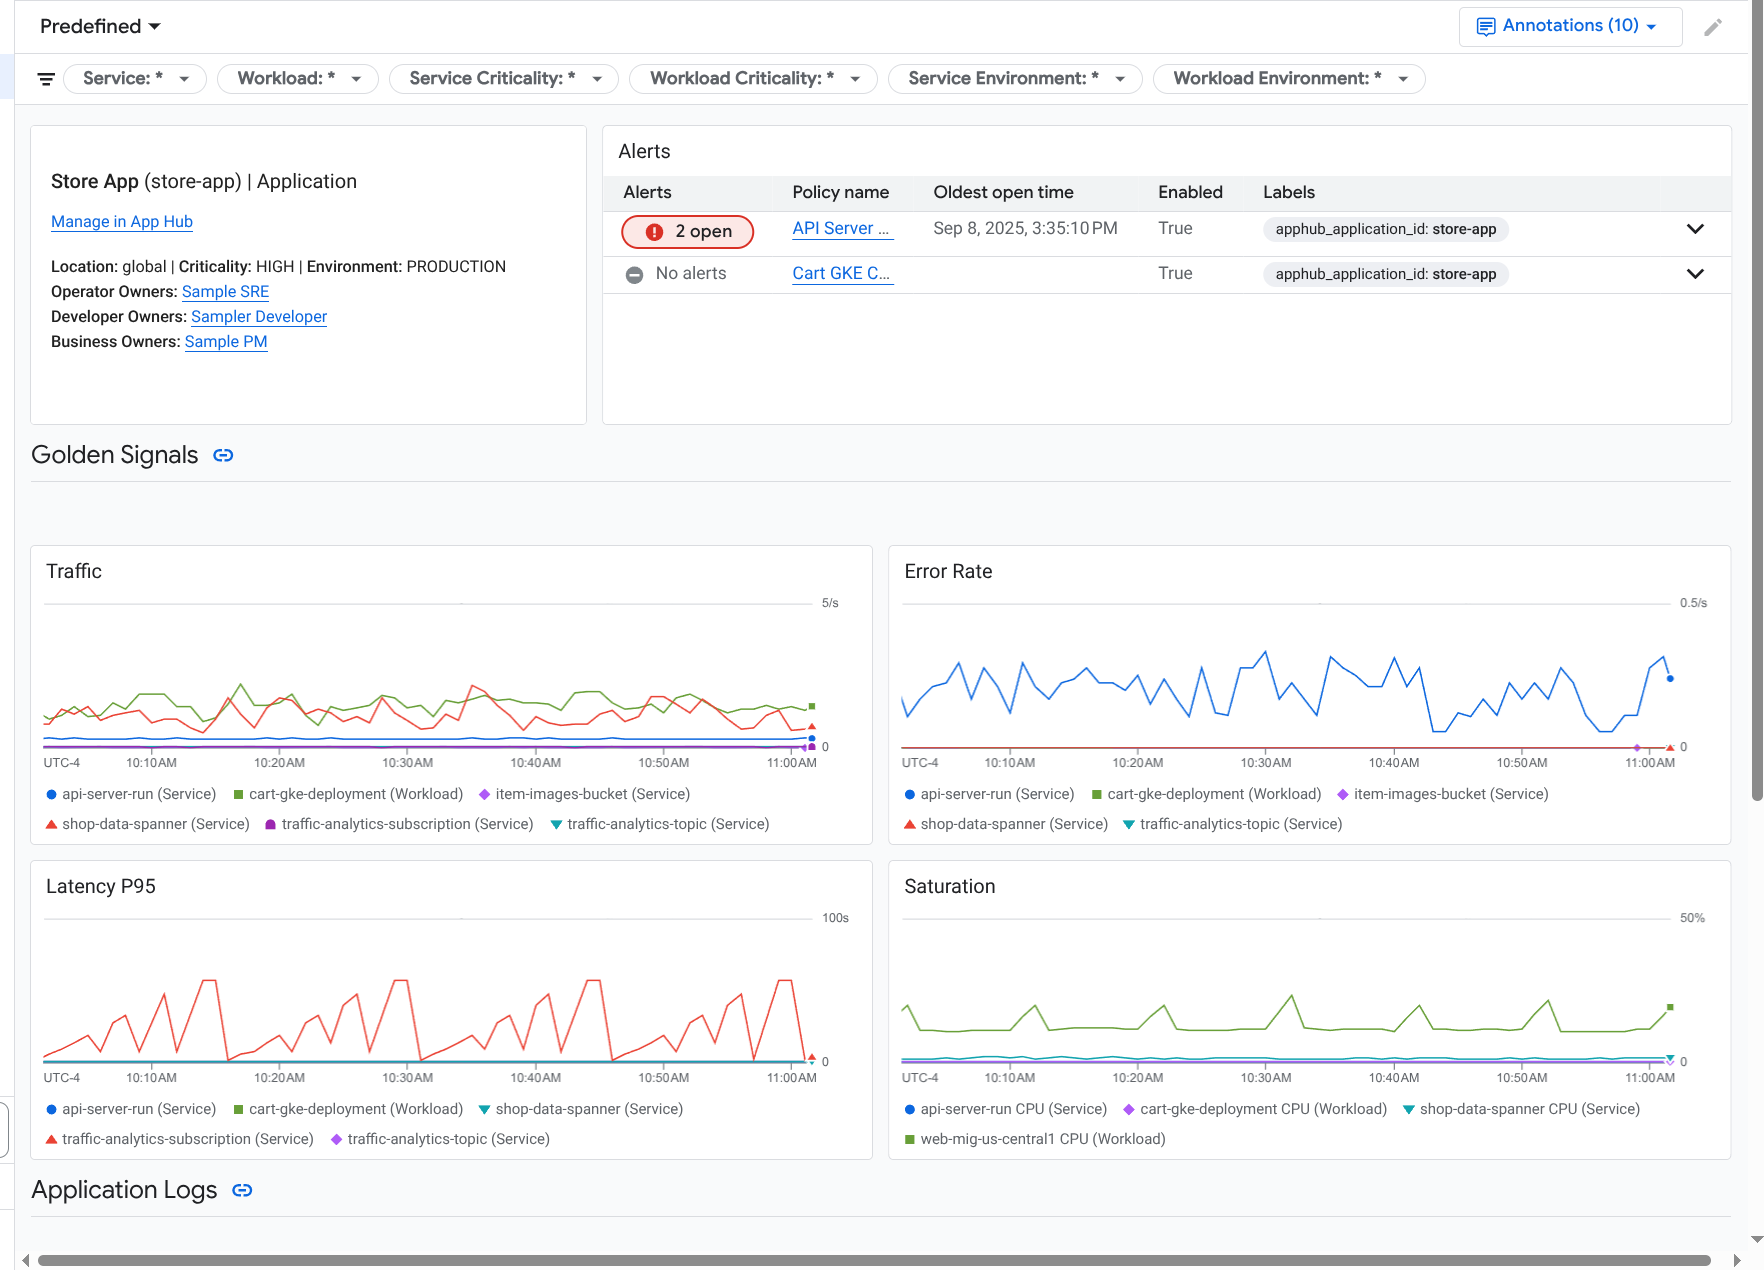
Pour cette même application, Application Monitoring crée également un tableau de bord qui affiche des informations plus détaillées, comme les signaux d'or, les données de journaux et les informations sur les incidents ouverts :
Pour utiliser la surveillance des applications, vous devez créer votre application et enregistrer des services et des charges de travail dans l'application, puis configurer le champ d'application de l'observabilité. Pour créer une application et y enregistrer des services et des charges de travail, vous pouvez utiliser App Hub ou déployer votre application à l'aide d'Application Design Center.
Pourquoi adopter la surveillance des applications ?
L'utilisation de la surveillance des applications peut vous faire gagner du temps et vous faciliter la tâche. Par exemple, supposons que vous utilisiez App Design Center pour vous aider à concevoir et à déployer votre application. Ensuite, vous utilisez App Hub pour organiser et gérer cette application, et la surveillance des applications pour comprendre ses performances et diagnostiquer les échecs :
- Tableaux de bord des applications, des services et des charges de travail
- Propagation des libellés pour les services et les charges de travail d'une application App Hub.
- Filtrez la télémétrie par niveau de gravité et par environnement.
- Intégration parfaite avec l'Open Source
Lorsque votre application est déployée, le service Application Monitoring la détecte et crée automatiquement des tableaux de bord adaptés à votre environnement. Pour vous aider à examiner les incidents, ces tableaux de bord permettent d'effectuer des recherches et d'appliquer des filtres.
Les tableaux de bord créés par Application Monitoring affichent les éléments suivants :
- Informations telles que l'emplacement, la criticité et les propriétaires.
- Informations sur les incidents ouverts.
- Données de journaux et de métriques générées par l'infrastructure compatible. Les données de métriques incluent des signaux d'or, comme les taux d'erreur et le trafic, ainsi que certaines métriques.
Lorsque vos applications s'exécutent sur une infrastructure compatible, Google Cloud Observability ajoute des libellés spécifiques aux applications à vos données de télémétrie. Ces libellés identifient votre application App Hub. Vous pouvez utiliser ces libellés spécifiques aux applications lorsque vous interrogez vos données de télémétrie. Les pages Explorateur de journaux, Explorateur de métriques et Explorateur de traces vous permettent d'utiliser des libellés pour filtrer et agréger les données.
Premiers pas avec la surveillance des applications
Pour utiliser Application Monitoring, procédez comme suit :
Configurez le champ d'observabilité pour pouvoir afficher la télémétrie d'une application enregistrée auprès d'App Hub. Pour en savoir plus sur cette étape, consultez Configurer la surveillance des applications.
Associez des libellés spécifiques à l'application à vos règles d'alerte. Pour en savoir plus sur cette étape, consultez Associer une règle d'alerte à une application App Hub.
Si vous souhaitez que les données de métriques et de trace générées par votre application incluent des libellés d'application, instrumentez votre application avec OpenTelemetry ou utilisez Google Cloud Managed Service pour Prometheus. Pour en savoir plus, consultez Instrumenter une application pour Application Monitoring.
Ouvrez et explorez les tableaux de bord de surveillance des applications. Pour savoir comment afficher ces tableaux de bord, consultez Afficher la télémétrie des applications.