이 문서에서는 자체 배포 컬렉션을 사용하는 Managed Service for Prometheus 배포의 규칙과 알림 평가의 구성을 설명합니다.
다음 다이어그램은 두 Google Cloud 프로젝트에서 클러스터를 여러 개 사용하고 규칙과 알림 평가를 모두 사용하는 배포를 보여줍니다.
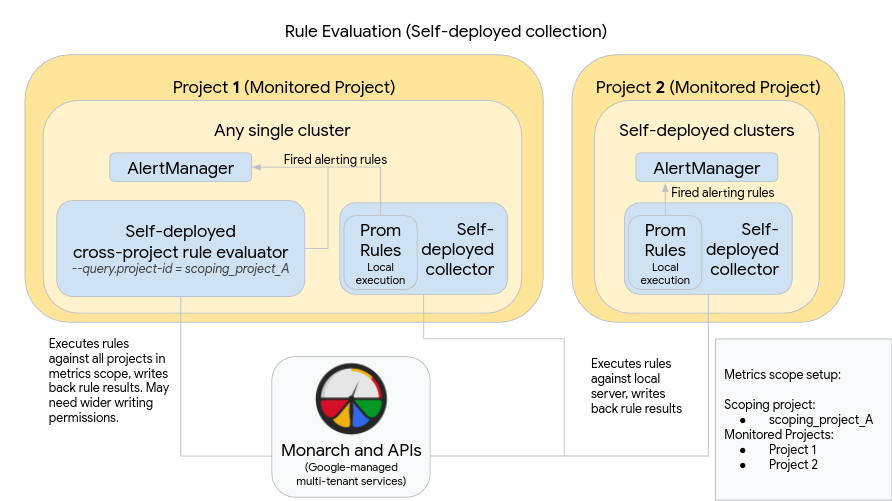
다이어그램과 같이 배포를 설정하고 사용하려면 다음 사항에 유의하세요.
규칙은 표준 Prometheus를 사용할 때와 마찬가지로 각 Managed Service for Prometheus 컬렉션 서버 내에 설치됩니다. 규칙 평가는 각 서버에 로컬로 저장된 데이터에 대해 실행됩니다. 서버는 모든 규칙의 대상 기간(일반적으로 1시간 이하)을 포함할 수 있는 충분히 긴 데이터를 보관하도록 구성됩니다. 규칙 결과는 평가 후 Monarch에 기록됩니다.
Prometheus AlertManager 인스턴스는 모든 단일 클러스터에 수동으로 배포됩니다. Prometheus 서버는 실행된 알림 규칙을 로컬 AlertManager 인스턴스로 전송하도록 구성 파일의 alertmanager_config 필드를 수정함으로써 구성됩니다. 음소거, 확인, 사고 관리 워크플로는 일반적으로 PagerDuty와 같은 타사 도구에서 처리됩니다.
Kubernetes 엔드포인트 리소스를 사용하여 여러 클러스터의 알림 관리를 단일 AlertManager 한 곳에서 제어할 수 있습니다.
Google Cloud 내에서 실행되는 단일 클러스터 하나가 측정항목 범위의 전역 규칙 평가 클러스터로 지정됩니다. 독립형 규칙 평가자는 클러스터에 배포되며 규칙은 표준 Prometheus 규칙 파일 형식으로 설치됩니다.
독립형 규칙 평가자는 프로젝트 1과 2가 포함된 scoping_project_A를 사용하도록 구성됩니다. scoping_project_A에 대해 실행된 규칙은 자동으로 프로젝트 1과 2로 팬아웃됩니다. 기본 서비스 계정에는 scoping_project_A에 대한 Monitoring 뷰어 권한이 부여되어야 합니다.
자체 배포된 전역 규칙 평가자를 사용하면 규칙에서 project_id, location, cluster, namespace 라벨을 보존하거나 집계하는지에 따라 예상치 못한 결과가 발생할 수 있습니다.
규칙에서 by(project_id) 절을 사용하여 project_id 라벨을 보존하는 경우 규칙 결과는 기본 시계열의 원래 project_id 값을 통해 Monarch에 다시 기록됩니다
이 시나리오에서는 기본 서비스 계정에 scoping_project_A의 각 모니터링 프로젝트에 대한 Monitoring 측정항목 작성자 권한이 있는지 확인해야 합니다. 새 모니터링 프로젝트를 scoping_project_A에 추가하는 경우 수동으로 서비스 계정에 새 권한도 추가해야 합니다.
규칙에서 by(project_id) 절을 사용하지 않고 project_id 라벨을 사용하는 경우 규칙 결과는 전역 규칙 평가자가 실행되는 클러스터의 project_id 값을 통해 Monarch에 다시 기록됩니다.
이 시나리오에서는 기본 서비스 계정을 추가로 수정할 필요가 없습니다.
규칙에서 by(location) 절을 사용하여 location 라벨을 보존하는 경우 규칙 결과는 기본 시계열이 시작하는 각 원본 Google Cloud 리전을 통해 Monarch에 다시 기록됩니다.
규칙에서 location 라벨을 보존하지 않는 경우 데이터는 전역 규칙 평가자가 실행 중인 클러스터의 위치에 다시 기록됩니다.
가능하면 규칙 평가 결과에 cluster 라벨과 namespace 라벨을 보존하는 것이 좋습니다. 그렇지 않으면 쿼리 성능이 저하되고 카디널리티 제한이 발생할 수 있습니다. 두 라벨 모두 제거하지 않는 것이 좋습니다.
[[["이해하기 쉬움","easyToUnderstand","thumb-up"],["문제가 해결됨","solvedMyProblem","thumb-up"],["기타","otherUp","thumb-up"]],[["이해하기 어려움","hardToUnderstand","thumb-down"],["잘못된 정보 또는 샘플 코드","incorrectInformationOrSampleCode","thumb-down"],["필요한 정보/샘플이 없음","missingTheInformationSamplesINeed","thumb-down"],["번역 문제","translationIssue","thumb-down"],["기타","otherDown","thumb-down"]],["최종 업데이트: 2025-09-04(UTC)"],[],[],null,["# Evaluation of rules and alerts with self-deployed collection\n\nThis document describes a configuration for rule and alert evaluation\nin a Managed Service for Prometheus deployment that uses\n[self-deployed collection](/stackdriver/docs/managed-prometheus/setup-unmanaged).\n\nThe following diagram illustrates a deployment that uses multiple clusters\nin two Google Cloud projects and uses both rule and alert evaluation:\n\nTo set up and use a deployment like the one in the diagram, note the\nfollowing:\n\n- Rules are installed within each Managed Service for Prometheus collection\n server, just as they are when using standard Prometheus. Rule evaluation\n executes against the data stored locally on each server. Servers are\n configured to retain data long enough to cover the lookback period of all\n rules, which is typically no more than 1 hour. Rule results are written\n to Monarch after evaluation.\n\n- A Prometheus AlertManager instance is manually deployed in every single\n cluster. Prometheus servers are configured by [editing the\n `alertmanager_config` field of the configuration file](/stackdriver/docs/managed-prometheus/rules-unmanaged#eval-rules-unmanaged) to send\n fired alerting rules to their local AlertManager instance. Silences,\n acknowledgements, and incident management workflows are typically\n handled in a third-party tool such as PagerDuty.\n\n You can centralize alert management across multiple clusters into a\n single AlertManager by using a Kubernetes [Endpoints resource](/stackdriver/docs/managed-prometheus/rules-unmanaged#eval-rules-unmanaged).\n- One single cluster running inside Google Cloud is designated as the\n global rule evaluation cluster for a metrics scope. The [standalone\n rule evaluator](/stackdriver/docs/managed-prometheus/rules-unmanaged#eval-rules-unmanaged) is deployed in that cluster and rules are\n installed using the standard Prometheus rule-file format.\n\n The standalone rule evaluator is configured to use scoping_project_A,\n which contains Projects 1 and 2. Rules executed against scoping_project_A\n automatically fan out to Projects 1 and 2. The underlying service account\n must be given the [Monitoring Viewer](/monitoring/access-control#mon_roles_desc) permissions\n for scoping_project_A.\n\n The rule evaluator is configured to send alerts to the local Prometheus\n Alertmanager by using the [`alertmanager_config` field of the configuration\n file](/stackdriver/docs/managed-prometheus/rules-unmanaged#eval-rules-unmanaged).\n\nUsing a self-deployed global rule evaluator may have unexpected\neffects, depending on whether you preserve or aggregate the `project_id`,\n`location`, `cluster`, and `namespace` labels in your rules:\n\n- If your rules preserve the `project_id` label (by using\n a `by(project_id)` clause), then rule results are written back to\n Monarch using the original `project_id` value of the underlying\n time series.\n\n In this scenario, you need to ensure the underlying service account\n has the [Monitoring Metric Writer](/monitoring/access-control#mon_roles_desc) permissions for each\n monitored project in scoping_project_A. If you add a new\n monitored project to scoping_project_A, then you must also manually\n add a new permission to the service account.\n- If your rules do not preserve the `project_id` label (by not using\n a `by(project_id)` clause), then rule results are written back to\n Monarch using the `project_id` value of the cluster where the\n global rule evaluator is running.\n\n In this scenario, you do not need to further modify the underlying\n service account.\n- If your rules preserve the `location` label (by using a `by(location)`\n clause), then rule results are written back to Monarch\n using each original Google Cloud region from which the underlying\n time series originated.\n\n If your rules do not preserve the `location` label, then data is written\n back to the location of the cluster where the global rule evaluator\n is running.\n\nWe strongly recommend preserving the `cluster` and `namespace` labels\nin rule evaluation results whenever possible. Otherwise, query performance\nmight decline and you might encounter cardinality limits. Removing both\nlabels is strongly discouraged."]]