템플릿을 사용하면 완성된 보고서에서 데이터를 시각화할 수 있습니다. 이러한 보고서를 '있는 그대로' 사용하거나 고유한 요구사항에 따라 맞춤설정하세요. 다른 사용자가 사용할 수 있는 나만의 자체 템플릿을 만들 수도 있습니다.
템플릿 갤러리
Google에서 만든 템플릿에 액세스하려면 템플릿 갤러리를 방문하세요. 다음 제품을 지원하는 템플릿이 포함되어 있습니다.
BigQuery
Google 애널리틱스
Google Ads
Google Sheets
YouTube 분석
Search Console
Display & Video 360
Search Ads 360
Apigee
참고 : Google 템플릿은 영어로만 제공되지만 데이터는 수집된 언어로 표시됩니다.
템플릿 작동 방식
템플릿은 보고서 URL에 /preview를 추가하여 만든 특별한 종류의 보고서입니다. 다른 보고서와 마찬가지로 보기 모드에서 템플릿과 상호작용할 수 있습니다. 하지만 템플릿을 수정하거나 공유하기 전에 수정 및 공유를 클릭하여 새 보고서에 템플릿을 복사해야 합니다.
템플릿의 데이터는 공유된 데이터 소스나, 템플릿에 있는 데이터 컨트롤에서 가져옵니다. 데이터 컨트롤을 사용하면 보고서에서 사용하고자 하는 데이터 세트를 선택할 수 있습니다. 공유된 데이터 소스를 기반으로 하는 템플릿인 경우 해당 템플릿을 내 데이터 소스로 교체하여 보고서와의 관련성을 높일 수 있습니다.
템플릿에서 내 데이터 보기
템플릿에서 내 데이터를 보려면 기본 데이터 소스를 액세스 권한이 있는 재사용 가능한 데이터 소스로 교체하거나, 삽입된 데이터 소스를 새로 만들어서 확인할 수 있습니다. 어떤 차이가 있나요?
기존 데이터 소스 선택하기
템플릿을 엽니다.
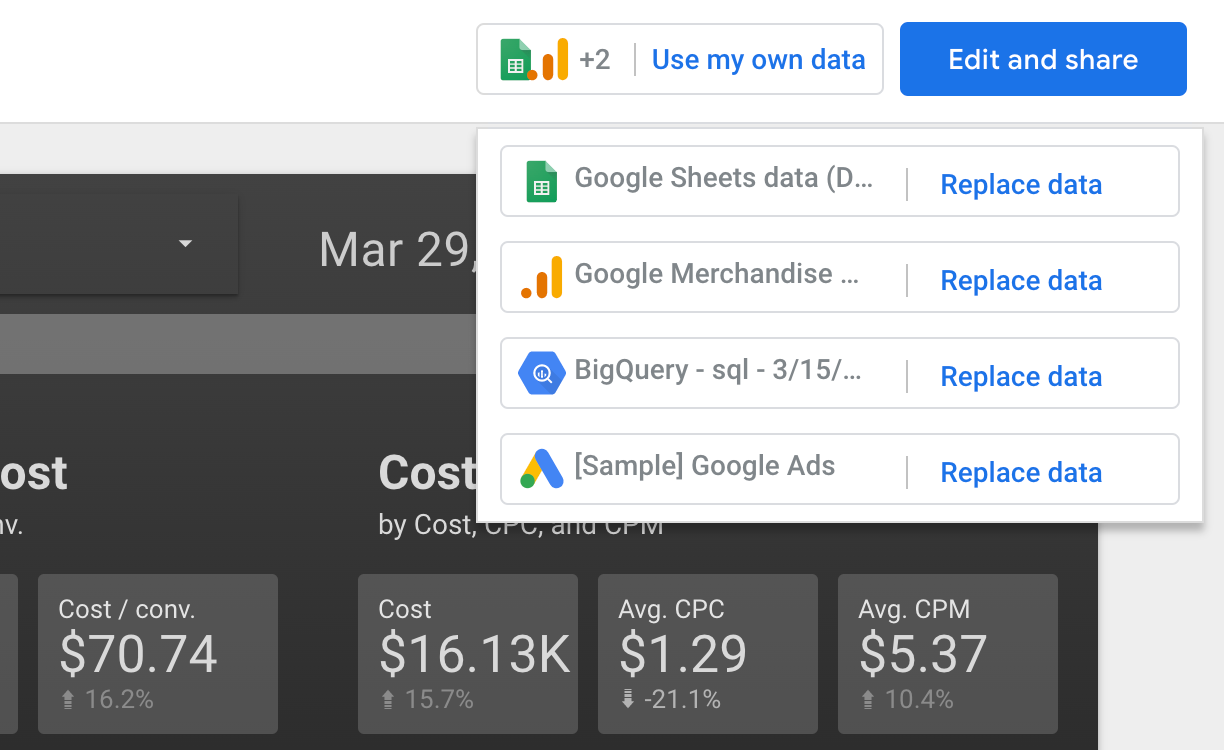
오른쪽 상단에서 자체 데이터 사용을 클릭한 다음 데이터 교체를 클릭합니다. 참고 : 템플릿에 데이터 소스가 여러 개인 경우 데이터 교체 버튼이 여러 개 표시됩니다. 교체하려는 각 데이터 소스를 대상으로 이 과정을 반복합니다.
왼쪽 상단에서 보고서에 데이터 추가를 클릭합니다.
왼쪽에서 내 데이터 소스를 클릭합니다.
데이터 소스를 선택하고 오른쪽 하단에서 추가를 클릭합니다.
새 데이터 소스 만들기
템플릿을 엽니다.
오른쪽 상단에서 자체 데이터 사용을 클릭합니다. 참고 : 템플릿에 데이터 소스가 여러 개인 경우 데이터 교체 버튼이 여러 개 표시됩니다. 교체하려는 각 데이터 소스를 대상으로 이 과정을 반복합니다.
[[["이해하기 쉬움","easyToUnderstand","thumb-up"],["문제가 해결됨","solvedMyProblem","thumb-up"],["기타","otherUp","thumb-up"]],[["이해하기 어려움","hardToUnderstand","thumb-down"],["잘못된 정보 또는 샘플 코드","incorrectInformationOrSampleCode","thumb-down"],["필요한 정보/샘플이 없음","missingTheInformationSamplesINeed","thumb-down"],["번역 문제","translationIssue","thumb-down"],["기타","otherDown","thumb-down"]],["최종 업데이트: 2025-07-31(UTC)"],[],[],null,["# Create a report from a template\n\nTemplates let you visualize your data in a finished report. Use these reports \"as is\" or customize them to fit your unique requirements. You can also create your own templates for others to use.\n\nTemplate gallery\n----------------\n\nVisit the [Template Gallery](https://lookerstudio.google.com/navigation/templates) to access templates built by Google. You'll find templates that support the following products:\n\n- BigQuery\n- Google Analytics\n- Google Ads\n- Google Sheets\n- YouTube Analytics\n- Search Console\n- Display \\& Video 360\n- Search Ads 360\n- Apigee\n\n\u003e **Note** : Even though Google templates are available only in English, your data will appear in the language in which it was collected.\n\nHow templates work\n------------------\n\nA template is a special kind of report, created by appending `/preview` to the report's URL. You can interact with a template in view mode just as you would any report. However, before you can modify or share the template, you must copy it to a new report by clicking **Edit and share**.\n\nThe data in a template comes either from a data source that's been shared with you, or from a [data control](/looker/docs/studio/data-control) placed on the template. Data controls let you select the data set you want to use in a report. If the template is based on a shared data source, you may want to replace that with your own data source to make the report more relevant to you.\n\nSee your data in a template\n---------------------------\n\nTo see your own data in a template you can either replace the default data source with a reusable data source to which you have access, or you can create a new embedded data source. [What's the difference?](/looker/docs/studio/embedded-data-sources)\n\n### Select an existing data source\n\n1. Open a template.\n2. In the upper right, click **Use my own data** , then click **Replace data** . \n **Note** : If the template has multiple data sources, you'll see multiple **Replace data** buttons. Repeat these instructions for each data source you want to replace.\n3. In the upper left, click **Add data to report**.\n4. On the left, click **My data sources**.\n5. Select the data source; then, in the lower right, click **Add**.\n\n### Create a new data source\n\n1. Open a template.\n2. In the upper right, click **Use my own data** . \n **Note** : If the template has multiple data sources, you'll see multiple **Replace data** buttons. Repeat these instructions for each data source you want to replace.\n3. Select the account or project configuration for the [data set](/looker/docs/studio/dataset) that you want to use, and then click **ADD**.\n\n\u003e ### Data source status\n\u003e\n\u003e An orange dot to the right of the Add data button means that you only have view access to the default data source. If you copy the template to your own report, then the report will have errors. We recommend replacing the data source with one to which you have full access.\n\u003e\n\u003e After replacing a data source in the template, a green dot to the right of the Add data button means that you have full access to the new data source.\n\u003e\nEdit and share a template\n-------------------------\n\nYou can save a template as your own report. In the upper right, click **Edit and share**. You can then modify the report and share it with others, just like any other report.\n\nCreate your own template\n------------------------\n\nAny report in Looker Studio can be a template: just view the report, and then edit the URL in the location bar by adding \" `/preview` \" at the end.\n\n**Example** :\n\nThis is the URL of the Looker Studio \"Instructions\" report, with \"/preview\" appended to turn it into a template:\n\n[https://lookerstudio.google.com/reporting/0B5FF6JBKbNJxOWItcWo2SVVVeGc/page/DjD/preview](https://lookerstudio.google.com/c/reporting/0B5FF6JBKbNJxOWItcWo2SVVVeGc/page/DjD/preview)\n\nSubmit a template to the gallery\n--------------------------------\n\nGot a Looker Studio report you'd like to share as a template for others to use? [Submit it to the report gallery](/looker/docs/studio/the-report-gallery).\n\nRelated resources\n-----------------\n\n- See featured reports, additional templates, data connectors, and community visualizations in the [Looker Studio Report Gallery](https://lookerstudio.google.com/gallery?category=marketing)\n- [Copy a report](/looker/docs/studio/copy-a-report)\n- [Add data to a report](/looker/docs/studio/add-data-to-a-report)"]]