Cloud Monitoring は、 Google Cloud プロダクトから指標、イベント、メタデータを収集します。Cloud Monitoring では、カスタム ダッシュボードと使用状況アラートを設定することもできます。
このドキュメントでは、指標の使用、カスタム指標ダッシュボードの学習、アラートの設定について説明します。
モニタリング対象リソース
Cloud Monitoring のモニタリング対象リソースは、仮想マシン、データベース、アプリケーションなどの論理エンティティまたは物理エンティティを表します。モニタリング対象リソースには、ダッシュボードを通じて調査、報告したり、アラートの作成に使用したりできる一意の指標セットが含まれています。各リソースには、リソースに関する追加情報を保持する Key-Value ペアである一連のリソースラベルもあります。リソースラベルは、リソースに関連付けられたすべての指標で使用できます。
Cloud Monitoring API を使用すると、次のリソースで Datastore モードの Firestore のパフォーマンスをモニタリングできます。
| 関連情報 | 説明 | サポートされているデータベース モード |
firestore.googleapis.com/Database(推奨) | project、location*、database_id の内訳を提供するモニタリング対象リソースタイプ。特定の名前なしで作成されたデータベースの場合、database_id ラベルは (default) になります。 |
両方のモードに適用されます。 |
datastore_request | Datastore プロジェクトのモニタリング対象リソースタイプ。データベースの内訳は提供されまん。 |
指標
Firestore には、Firestore ネイティブと Datastore モードの Firestore の 2 つのモードがあります。これらの 2 つのモードの機能の比較については、データベース モードを選択するをご覧ください。
Datastore モードの Firestore の指標の一覧については、Datastore モードの Firestore の指標をご覧ください。
サービス ランタイム指標
serviceruntime 指標は、プロジェクトのトラフィックの概要を示します。これらの指標は、ほとんどの Google Cloud API で使用できます。consumed_api モニタリング対象リソースタイプには、これらの一般的な指標が含まれています。これらの指標は 30 分ごとにサンプリングされるため、データが平滑化されます。
serviceruntime 指標の重要なリソースラベルは method です。このラベルは、呼び出された基盤となる RPC メソッドを表します。呼び出す SDK メソッドの名前は、基盤となる RPC メソッドの名前と同じであるとは限りません。その理由は、SDKが高レベルの API 抽象化を提供するためです。ただし、アプリケーションと Firestore の相互作用を理解しようとする場合は、RPC メソッドの名前に基づく指標を理解することが重要です。
特定の SDK メソッドの基盤となる RPC メソッドを知る必要がある場合は、API のドキュメントをご覧ください。
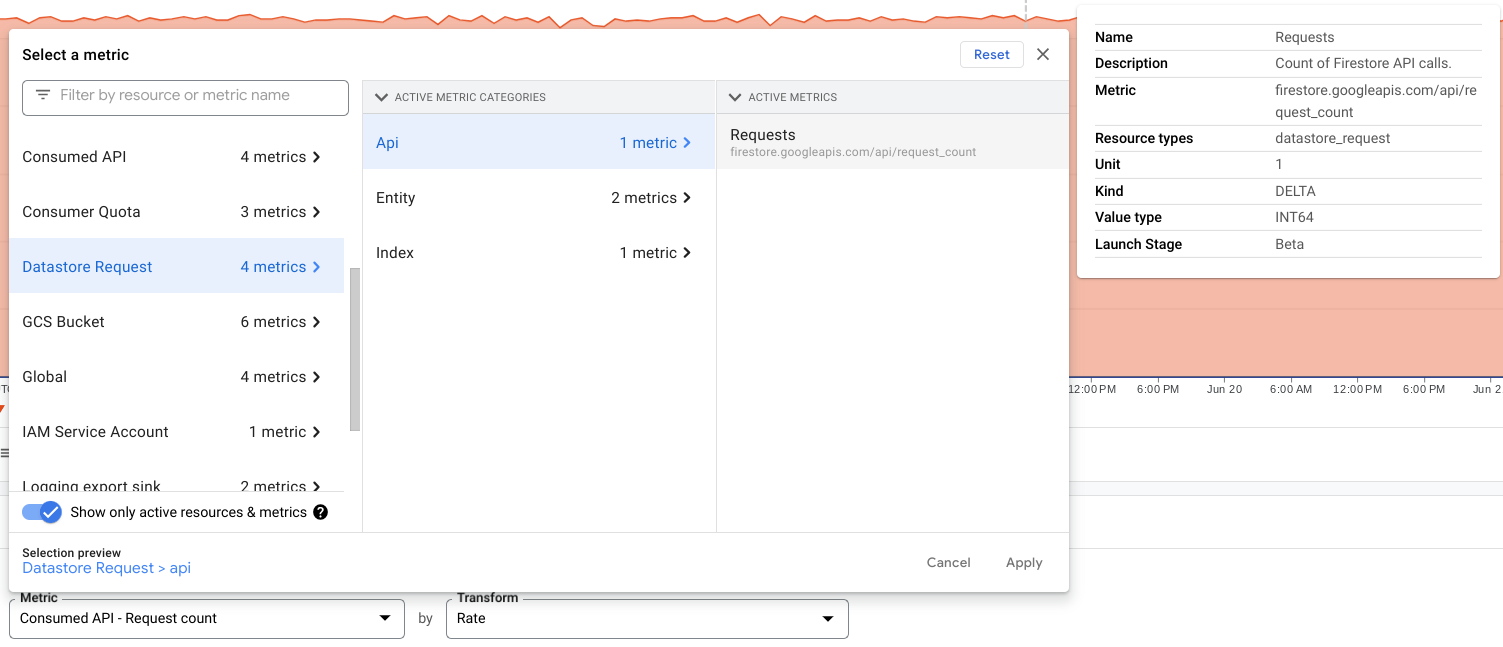
api/request_count
この指標は、プロトコル(http、gRPC などのリクエスト プロトコル)、レスポンス コード(HTTP レスポンス コード)、response_code_class(2xx、4xx などのレスポンス コード クラス)、grpc_status_code(数値 gRPC レスポンス コード)にわたる完了したリクエストの数を示します。この指標を使用して、API リクエスト全体をモニタリングし、エラー率を計算します。
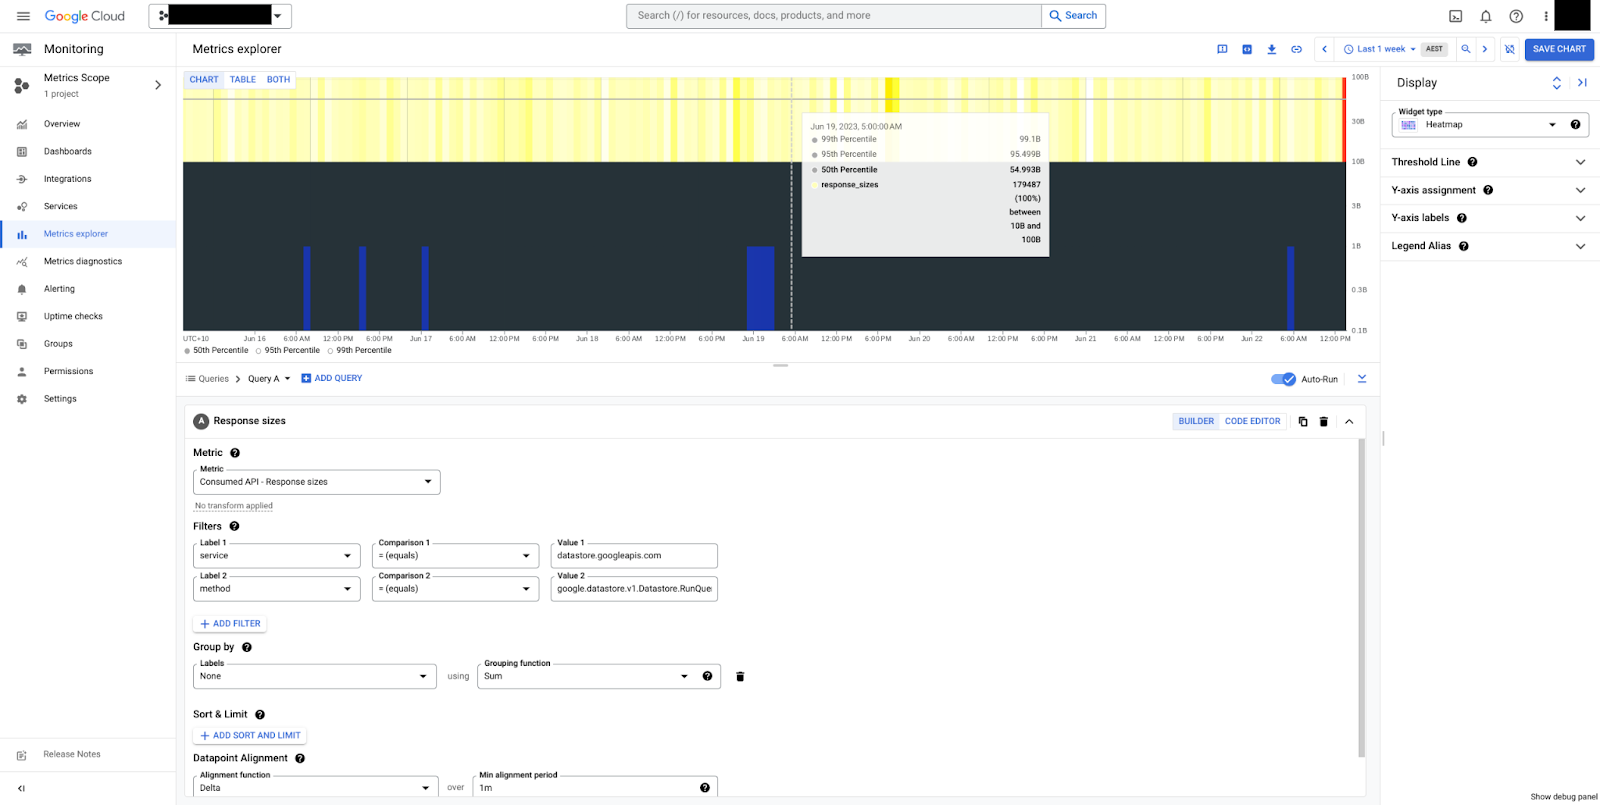
図 1 では、サービスとメソッドでグループ化された 2xx コードを返すリクエストを確認できます。2xx コードは、リクエストが成功したことを示す HTTP ステータス コードです。
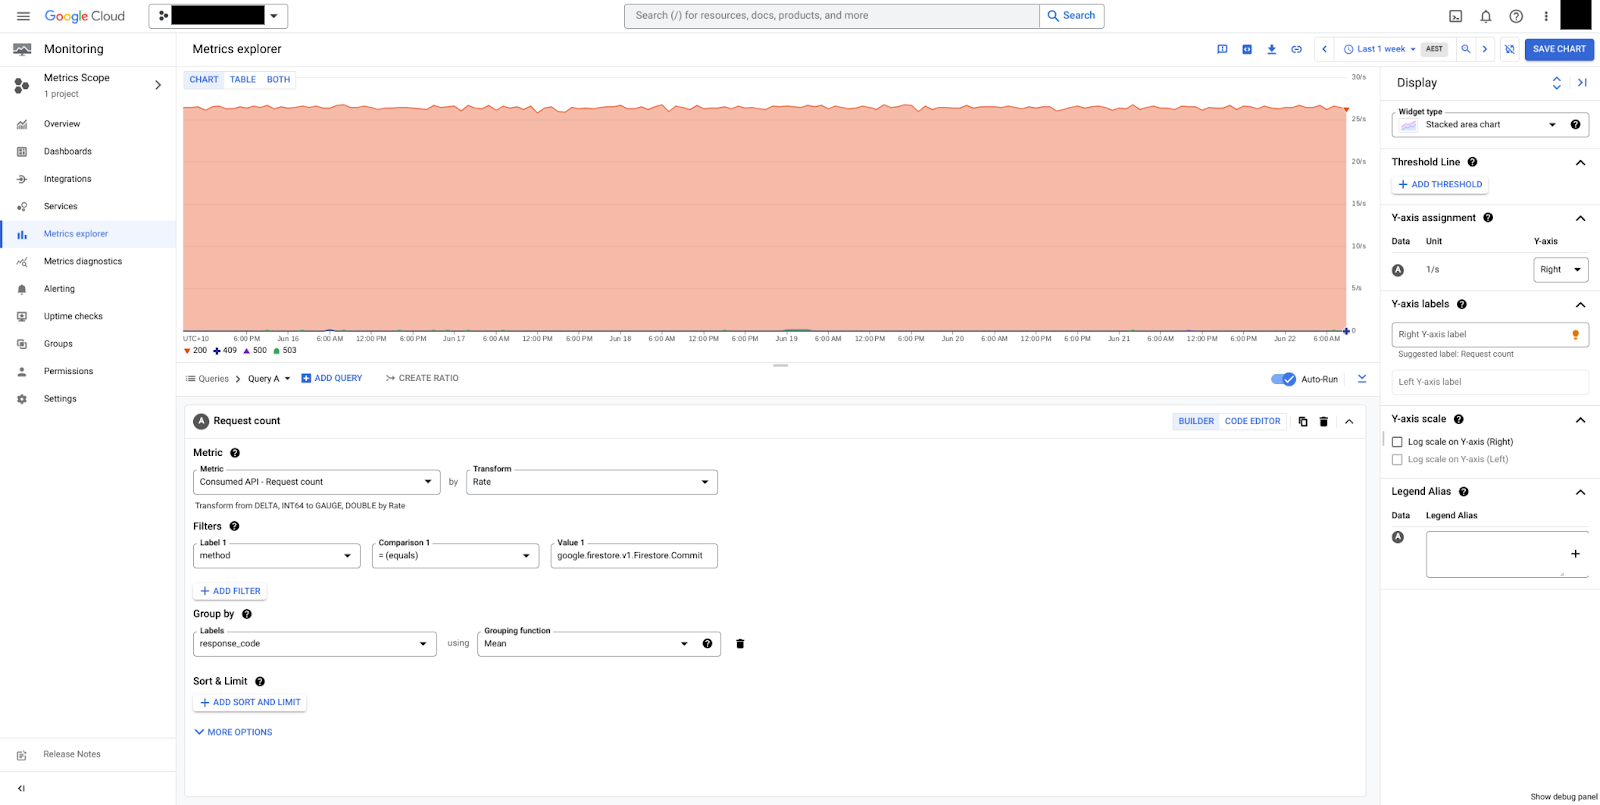
図 2 に、response_code でグループ化されたコミットを示します。この例では、HTTP 200 レスポンスのみが表示されます。これは、データベースが正常であることを意味します。
次のサービス ランタイム指標を使用して、データベースをモニタリングします。
datastore_request リソースタイプの api/request_count
api/request_count 指標は、datastore_request リソースタイプで api_method と response_code の内訳でも使用できます。この指標を使用すると、サンプリング期間が短くなるため、スパイクを検出できます。
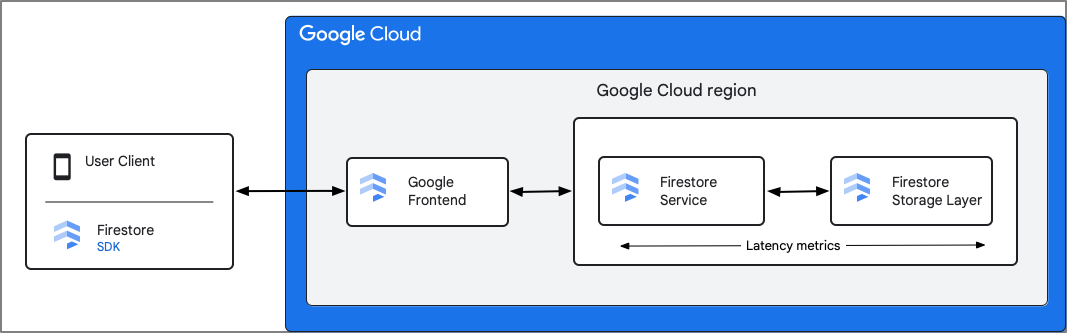
api/request_latencies
api/request_latencies 指標は、完了したすべてのリクエストのレイテンシ分布を示します。
Firestore は、Firestore Service コンポーネントから指標を記録します。レイテンシ指標には、Firestore がリクエストを受信してから Firestore がレスポンスの送信を完了するまでの時間(ストレージ レイヤとのやり取りを含む)が含まれます。そのため、クライアントと Firestore サービス間のラウンドトリップ レイテンシ(rtt)はこれらの指標に含まれません。
api/request_sizes と api/response_sizes
api/request_sizes 指標と api/response_sizes 指標は、それぞれペイロード サイズ(バイト単位)に関する分析情報を提供します。これらは、大量のデータまたは範囲が広すぎるクエリを送信し、大きなペイロードを返す書き込みワークロードを理解するのに役立ちます。
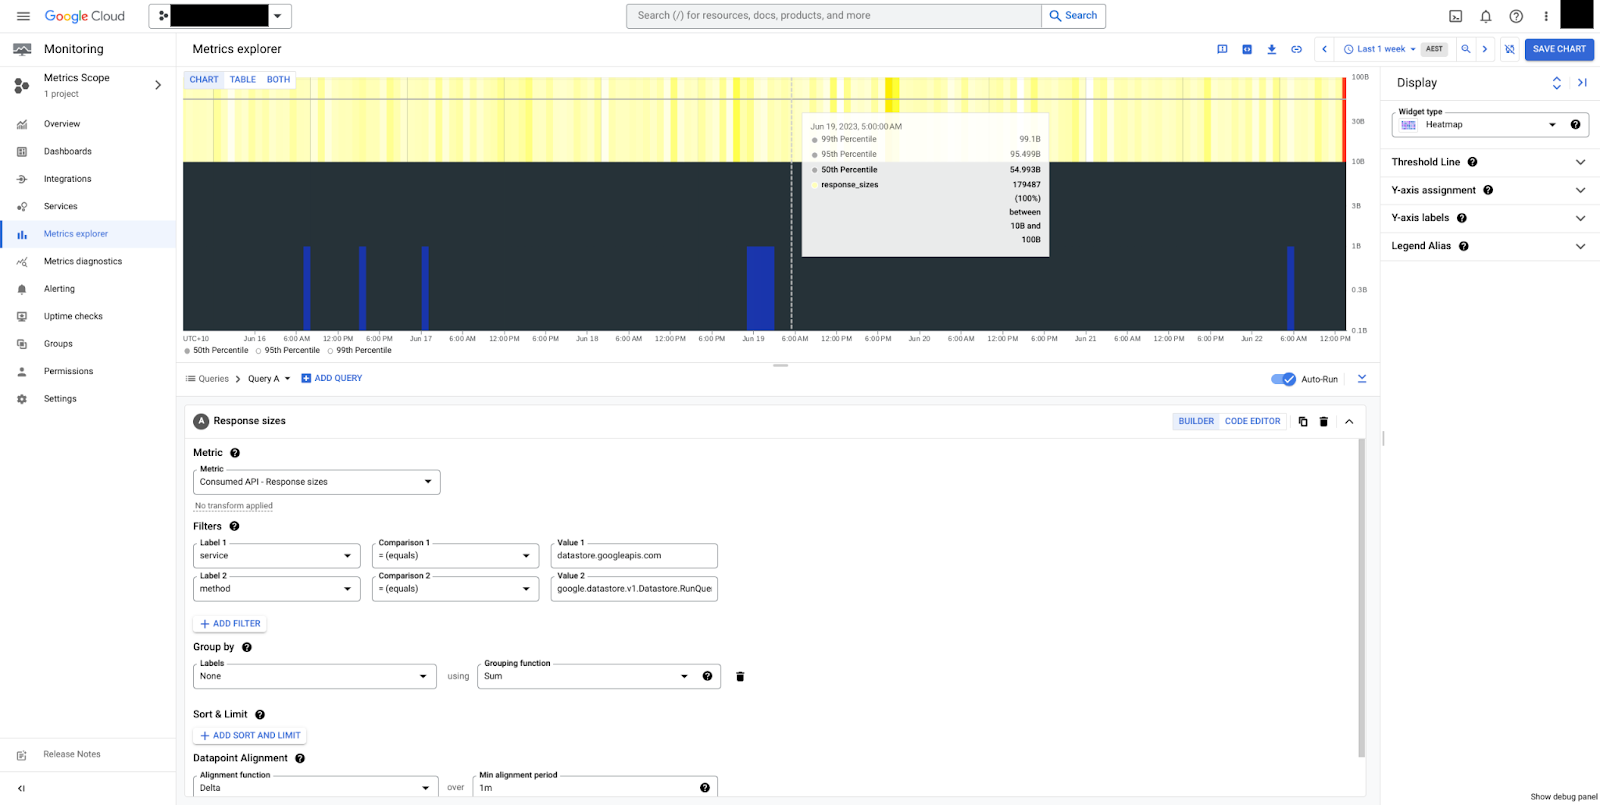
図 5 は、RunQuery メソッドのレスポンス サイズのヒートマップを示しています。サイズは安定していて、中央値は 50 バイト、全体では 10 ~ 100 バイトの間であることがわかります。ペイロード サイズは常に非圧縮バイト単位で測定され、伝送制御オーバーヘッドは含まれません。
エンティティ オペレーションの指標
これらの指標は、Firestore データベースに対する読み取り(ルックアップとクエリ)と書き込みのペイロード サイズの分布をバイト単位で示します。値はペイロードの合計サイズを表します。たとえば、クエリによって返された結果などです。これらの指標は、api/request_sizes や api/response_sizes の指標と似ていますが、主な違いはエンティティ オペレーションの指標ではサンプリングがより細かく、内訳は大まかになることです。
たとえば、エンティティ オペレーション指標は datastore_request モニタリング対象リソースを使用するため、サービスやメソッドの内訳はありません。
entity/read_sizes: タイプ別にグループ化された読み取りエンティティのサイズの分布entity/write_sizes: オペレーションによってグループ化された、書き込まれたエンティティのサイズ分布。
インデックス指標
インデックスの書き込みレートは、インデックスのファンアウト率を把握するために document/write_ops_count 指標と比較できます。
index/write_count: インデックスの書き込み数。
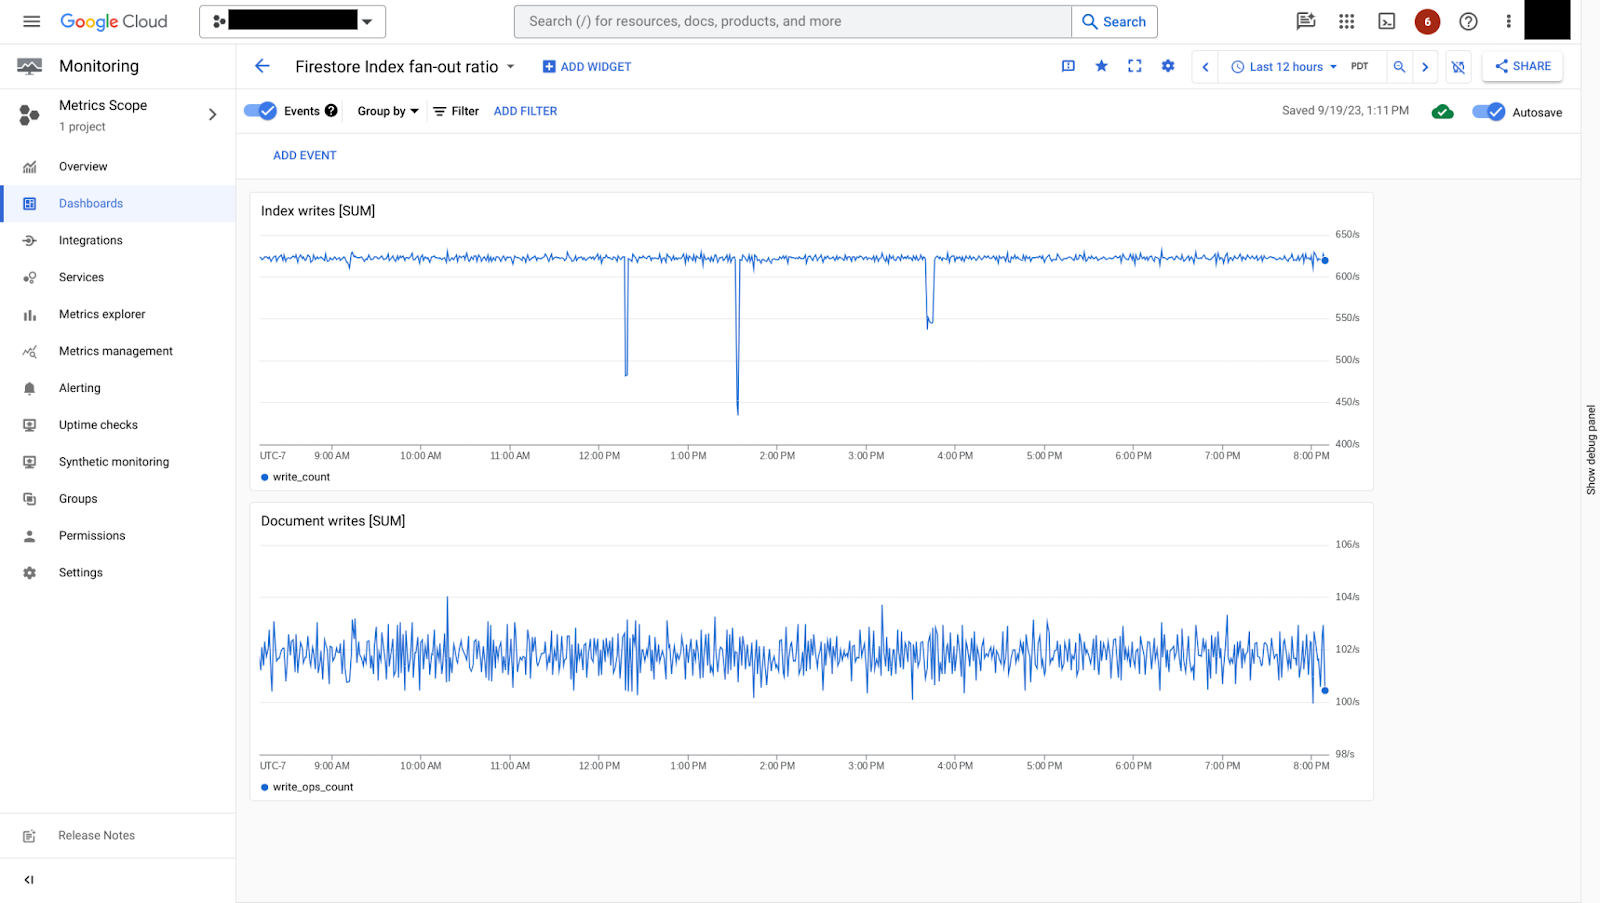
図 7 は、インデックスの書き込みレートとドキュメントの書き込みレートを比較する方法を示しています。この例では、ドキュメントの書き込みごとに約 6 つのインデックス書き込みがあります。これは、比較的小さいインデックス ファンアウトレートです。
TTL 指標
TTL 指標は、Firestore ネイティブ モードと Datastore モードの Firestore の両方のデータベースで使用できます。これらの指標を使用して、適用された TTL ポリシーの効果をモニタリングします。
entity/ttl_deletion_count: TTL サービスによって削除されたエンティティの合計数。entity/ttl_expiration_to_deletion_delays: TTL があるエンティティが期限切れになってから、実際に削除されるまでの経過時間。TTL の削除で遅延が 24 時間以上になる場合は、サポートにお問い合わせください。
次のステップ
- Cloud Monitoring ダッシュボードを使用して指標を表示する方法を確認する。