このページでは、Query Insights ダッシュボードを使用し、クエリのパフォーマンスを検出して分析する方法について説明します。
Query Insights の概要
Query Insights ダッシュボードを使用して、指標関連のクエリをモニタリングします。指標に基づいて、最も頻繁に使用されるクエリと、最適化が必要になる可能性のあるレイテンシの高いクエリを特定できます。Query Insights ダッシュボードは、次のことに役立ちます。
- クエリ パフォーマンスの最適化: レイテンシが高く、最適化が必要になる可能性があるクエリを特定します。
- クエリ費用管理: 費用のかかるクエリを特定し、最適化して費用を削減します。
- クエリ統計のモニタリング: クエリ統計の推移をトラッキングします。
Query Insights のデータ
Query Insights には、次の API メソッドのデータが含まれます。
これらのメソッドを使用するクエリに関するデータは、特定のプロジェクト、データベース、10 分から 30 日の期間で表示できます。構造が同等のクエリのデータは、単一の正規化されたクエリとしてキャプチャされます。
Query Insights は、クエリに関する次の情報を返します。
| 正規化されたクエリテキスト | テキストで表されるクエリ構造。 |
| 実行回数 | 選択した期間内の実行数。 |
| エラー件数 | 選択した時間枠内のエラーの数。 |
| 平均実行時間(ミリ秒) | データベースがクエリを処理するのにかかった平均時間(ミリ秒単位)。 |
| 返された結果の平均数 | 検索によって返された結果の数。結果には、エンティティ、種類 ID、射影、集計されたバケットが含まれます。 |
| スキャンされたエンティティの平均数 | クエリでスキャンされたエンティティの数。 |
| スキャンされたインデックス エントリの平均数 | クエリの実行のために検査されたインデックス エントリの数。 |
| 負荷(平均実行時間別) | 平均レイテンシに基づいて上位のクエリをフィルタリングするのに役立つデータ。 |
| 負荷(課金対象の読み取りオペレーションの合計数) | 課金対象の読み取りオペレーションの合計数に基づいて上位のクエリをフィルタリングするのに役立つデータ。 |
データの粒度と保持
データの粒度は、指定した期間によって異なります。
- 過去 4 日以内の場合、10 分単位の粒度
- 過去 30 日以内の場合、1 時間単位の粒度
Query Insights の最大データ保持期間は 30 日です。10 分のデータは 4 日間保存され、1 時間のデータは 30 日間保存されます。
制限事項
- Query Insights のデータには 1 ~ 2 時間の遅延があります。
料金
Query Insights に追加料金は発生しません。
必要なロール
クエリ分析情報ダッシュボードを表示するために必要な権限を取得するには、プロジェクトに対する Datastore 閲覧者 (roles/datastore.viewer)IAM ロールを付与するよう管理者に依頼してください。ロールの付与については、プロジェクト、フォルダ、組織に対するアクセス権の管理をご覧ください。
この事前定義ロールには、クエリ分析情報ダッシュボードを表示するために必要な datastore.insights.get 権限が含まれています。
カスタムロールや他の事前定義ロールを使用して、この権限を取得することもできます。
Query Insights を表示
Datastore モードの Firestore データベースのクエリ分析情報を表示するには、 Google Cloud コンソールでデータベースの [クエリ分析情報] ペインを開きます。
Google Cloud コンソールで、[データベース] ページに移動します。
データベースのリストからデータベースを選択します。
ナビゲーション メニューで [Query Insights] をクリックします。
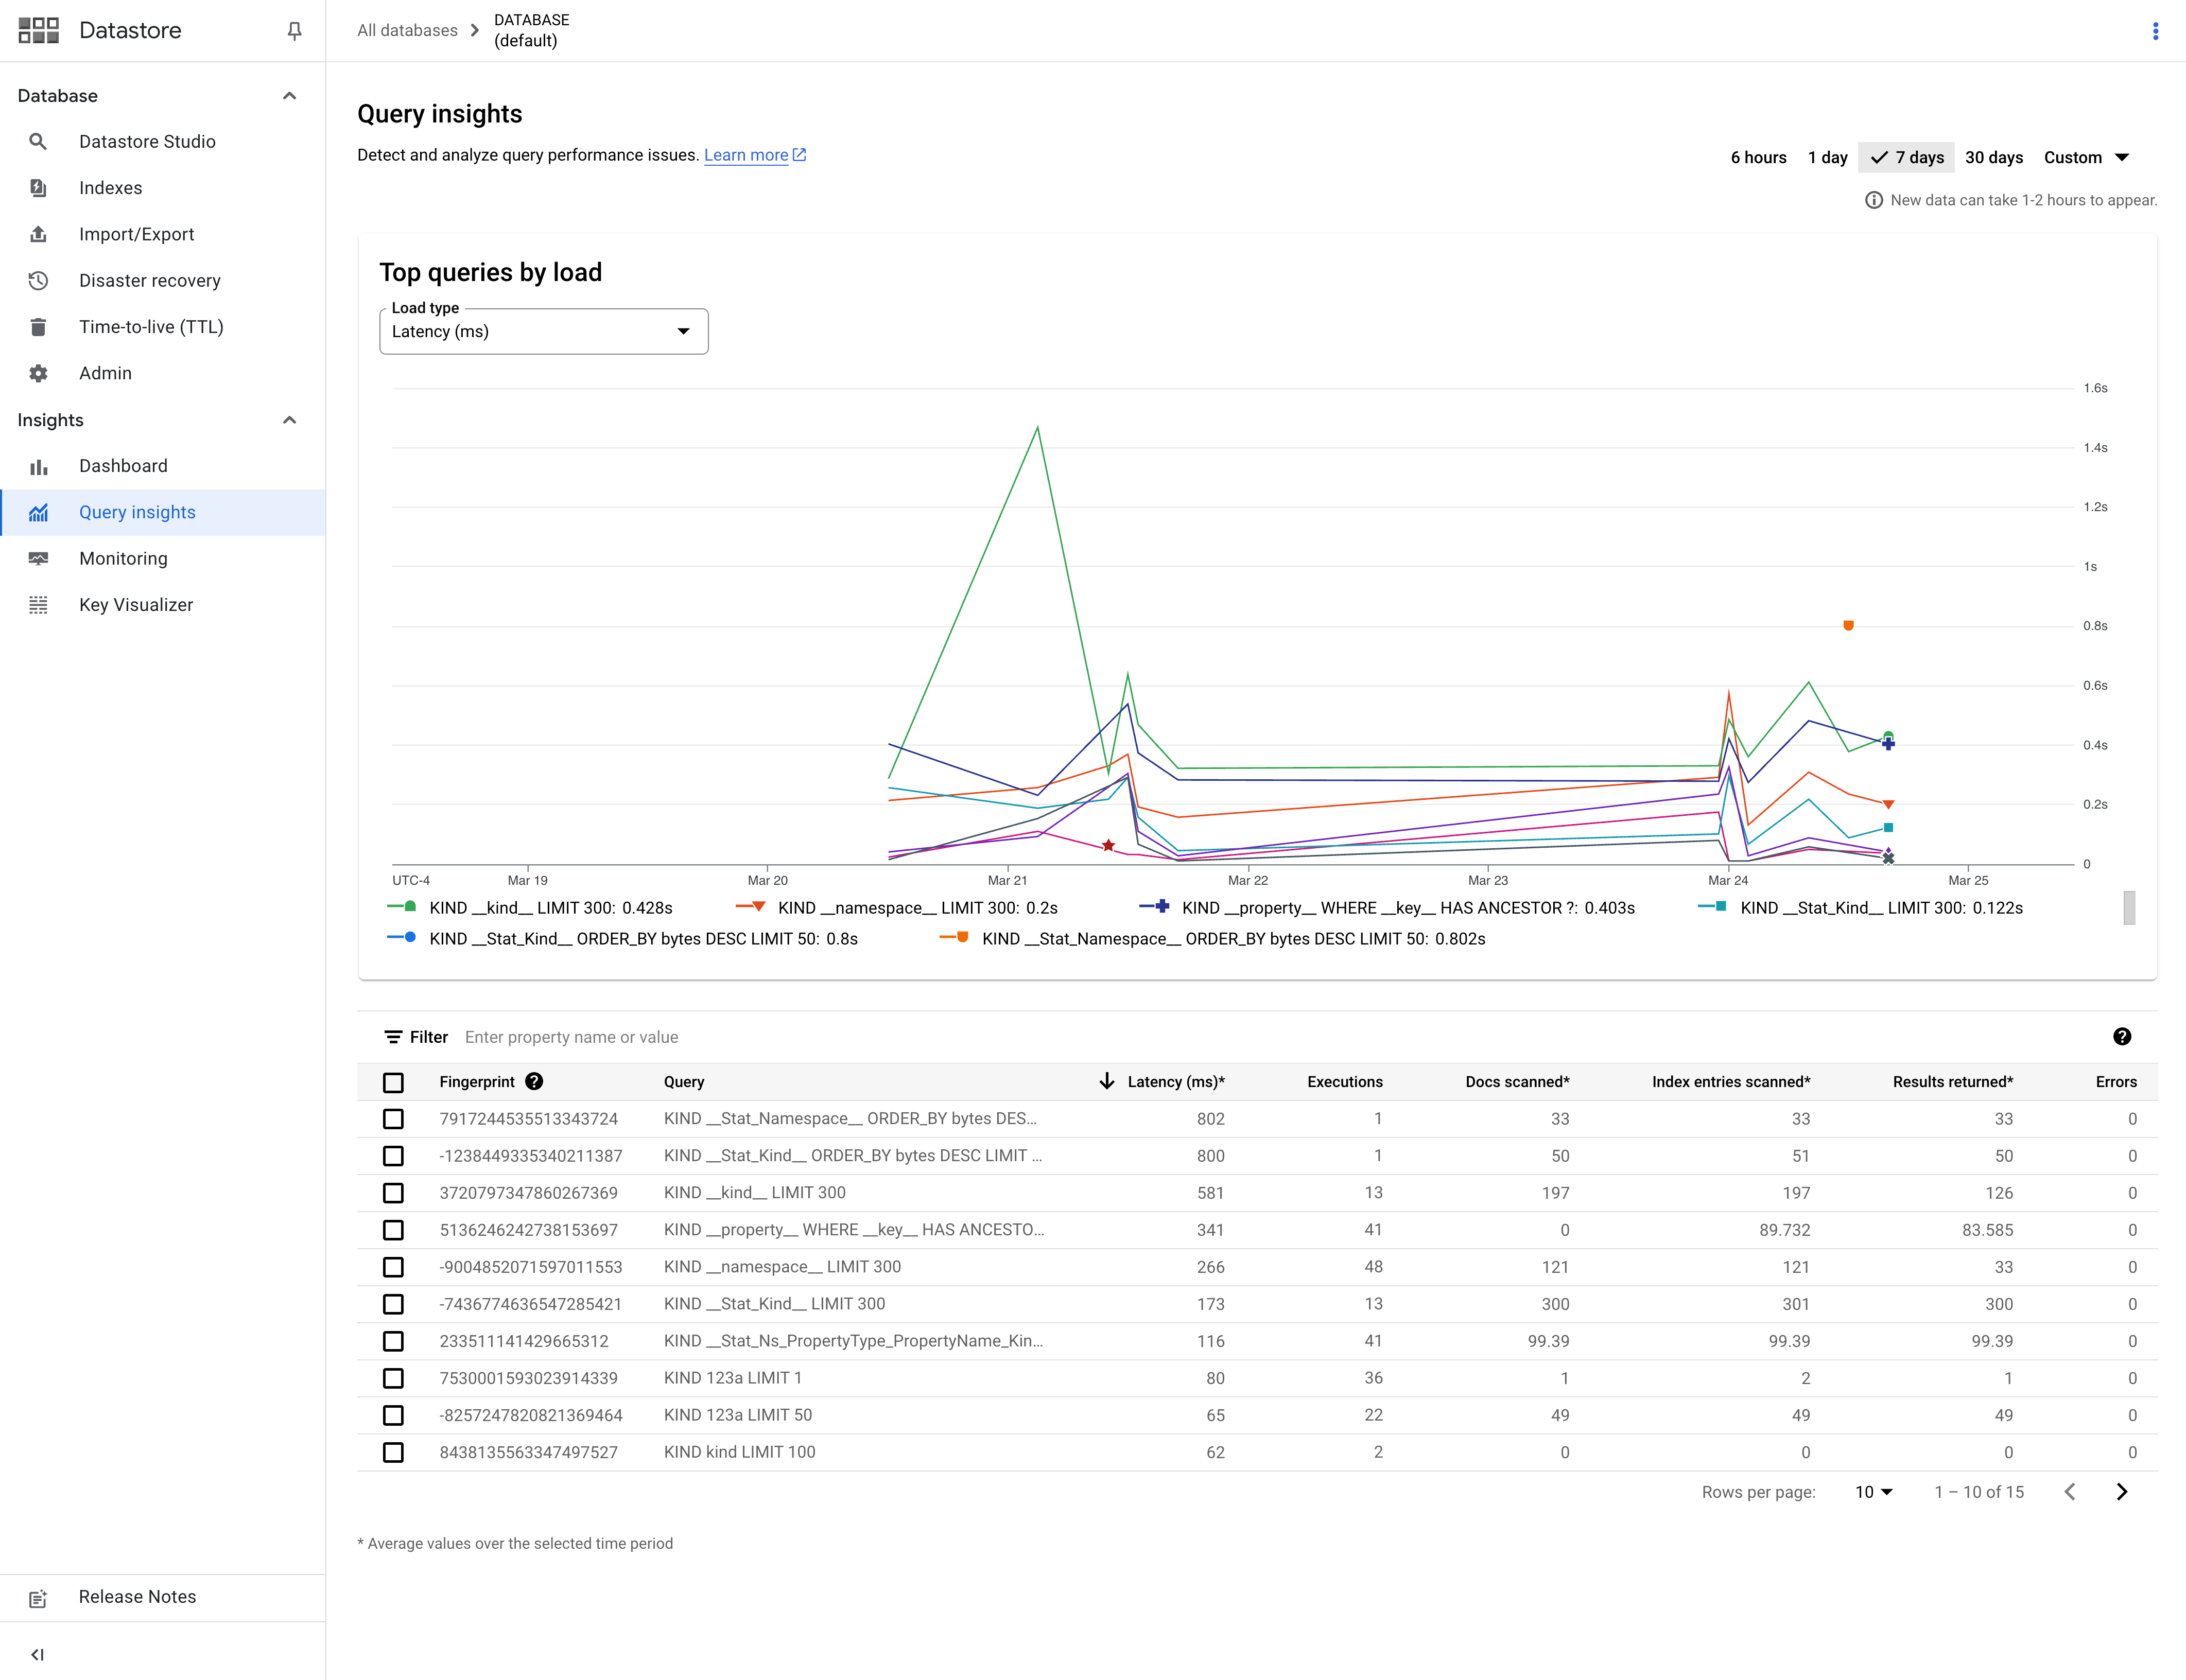
[読み込みのタイプ] プルダウンを使用して、レイテンシまたは読み取りオペレーションの数で上位のクエリを見つけます。
次のステップ
- クエリの説明を使用してクエリのパフォーマンスを向上させる
- 使用量のモニタリング