This page provides information to help you monitor and debug Dataproc jobs and understand Dataproc job error messages.
Job monitoring and debugging
Use the Google Cloud CLI, Dataproc REST API, and Google Cloud console to analyze and debug Dataproc jobs.
gcloud CLI
To examine a running job's status:
gcloud dataproc jobs describe job-id \
    --region=region
To view job driver output, see View job output.
REST API
Call jobs.get to examine a job's JobStatus.State, JobStatus.Substate, JobStatus.details, and YarnApplication fields.
Console
To view job driver output, see View job output.
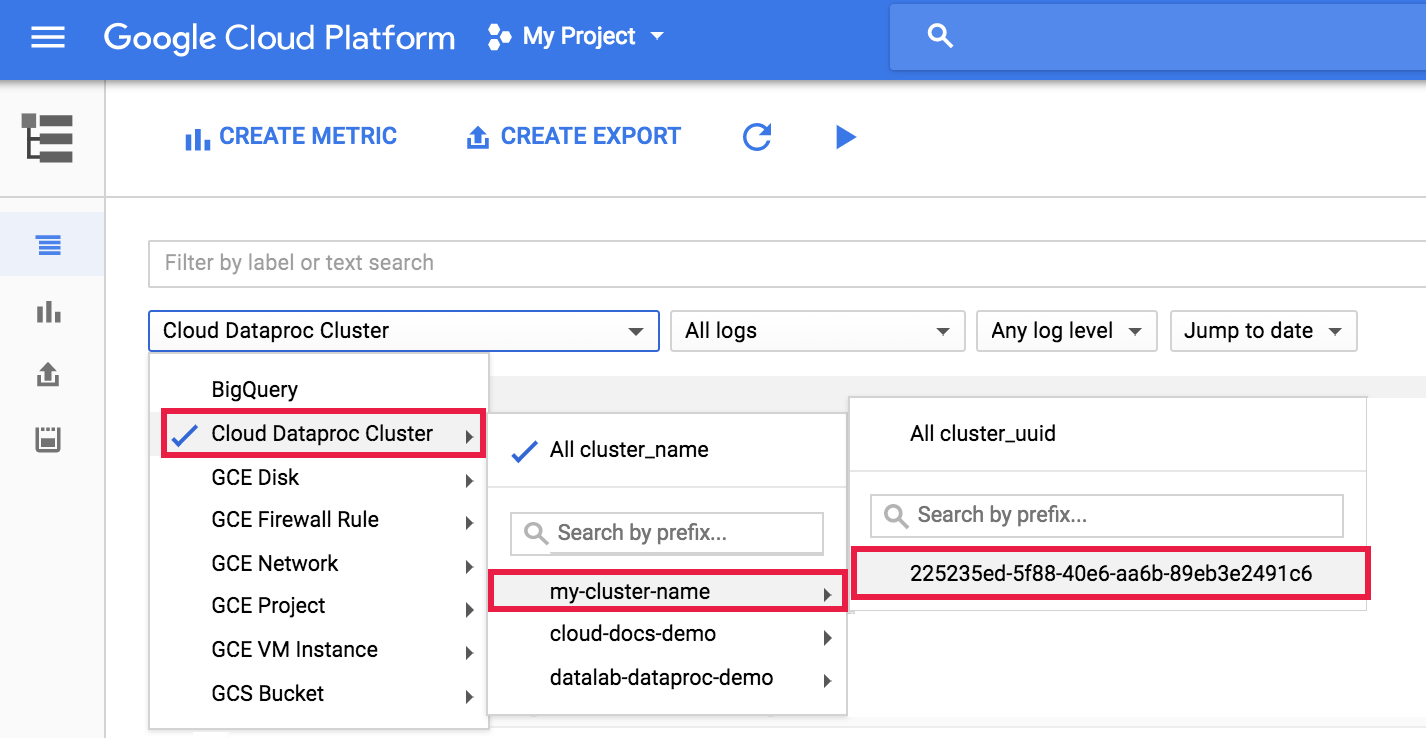
To view the dataproc agent log in Logging, select Dataproc Cluster→Cluster Name→Cluster UUID from the Logs Explorer cluster selector.

Then use the logs selector to select google.dataproc.agent logs.

View job logs in Logging
If a job fails, you can access job logs in Logging.
Determine who submitted a job
Looking up the details of a job will show who submitted that job in the submittedBy
field. For example, this job output shows user@domain submitted the example
job to a cluster.
...
placement:
  clusterName: cluster-name
  clusterUuid: cluster-uuid
reference:
  jobId: job-uuid
  projectId: project
status:
  state: DONE
  stateStartTime: '2018-11-01T00:53:37.599Z'
statusHistory:
- state: PENDING
  stateStartTime: '2018-11-01T00:33:41.387Z'
- state: SETUP_DONE
  stateStartTime: '2018-11-01T00:33:41.765Z'
- details: Agent reported job success
  state: RUNNING
  stateStartTime: '2018-11-01T00:33:42.146Z'
submittedBy: user@domain
Error messages
Task was not acquired
This indicates that the Dataproc agent on the master node was unable to acquire the task from the control plane. This often happens due to out-of-memory (OOM) or network issues. If the job ran successfully previously and you have no t changed network configuration settings, OOM is the most likely cause, often the result of the submission of many concurrently running jobs or jobs whose drivers consume significant memory (for example, jobs that load large datasets into memory).
No agent on master node(s) found to be active
This indicates that the Dataproc agent on the master node is not active and cannot accept new jobs. This often happens due to out-of-memory (OOM) or network issues, or if the master node VM is unhealthy. If the job ran successfully previously and you have not changed network configuration settings, OOM is the most likely cause, which often results from the submission of many concurrently running jobs or jobs whose drivers consume significant memory (jobs that load large datasets into memory).
To help resolve the problem, you can try the following actions:
- Restart the job.
- Connect using SSH to the cluster master node, and then determine what job or other resource is using the most memory.
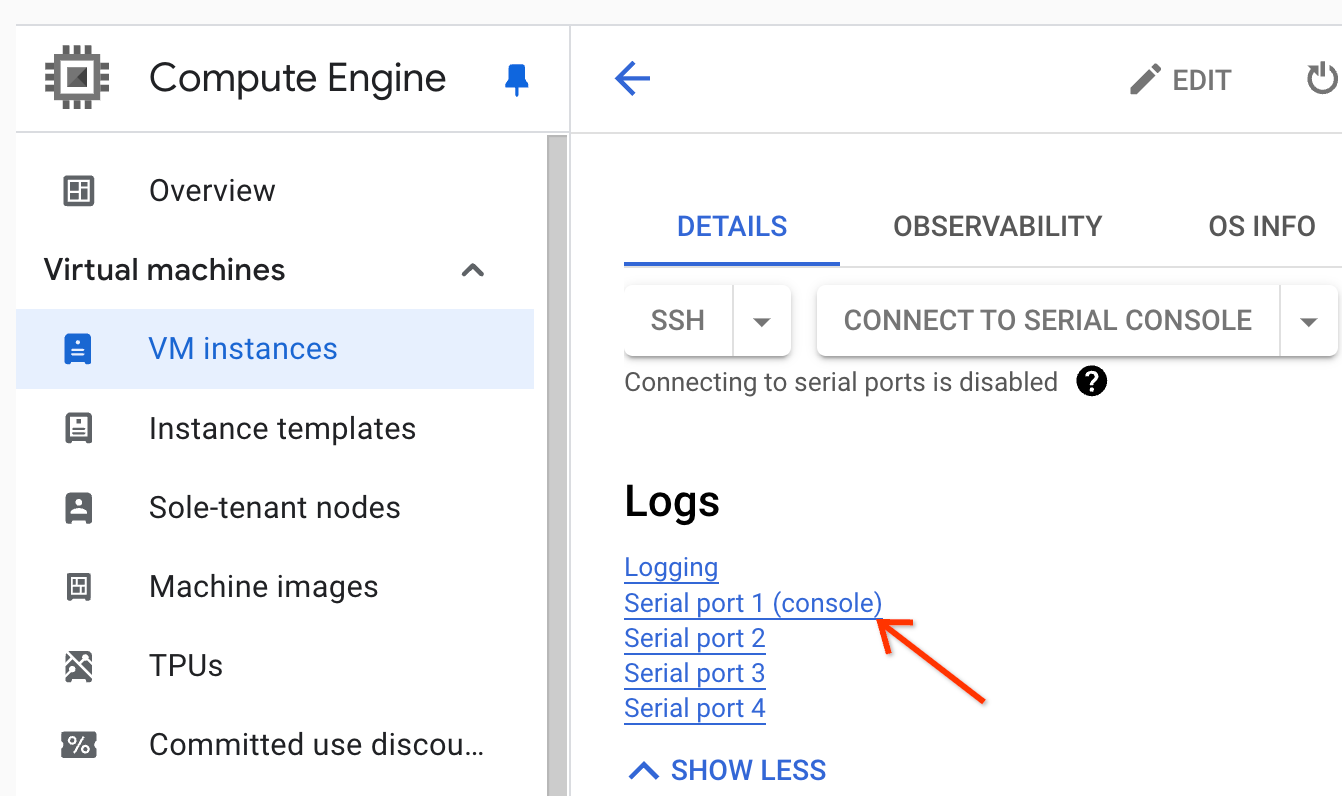
If you can't sign in to the master node, you can check the serial port (console) logs.

Generate a diagnostic bundle, which contains the syslog and other data.
Task not found
This error indicates that the cluster was deleted while a job was running. You can perform the following actions to identify the principal that performed the deletion and confirm that cluster deletion occurred when a job was running:
View the Dataproc audit logs to identify the principal that performed the delete operation.
Use Logging or the gcloud CLI to check that the YARN application's last known state was RUNNING:
- Use the following filter in Logging:
resource.type="cloud_dataproc_cluster"
resource.labels.cluster_name="CLUSTER_NAME"
resource.labels.cluster_uuid="CLUSTER_UUID"
"YARN_APPLICATION_ID State change from"
- Run
gcloud dataproc jobs describe job-id --region=REGION, then checkyarnApplications: > STATEin the output.
If the principal that deleted the cluster is the Dataproc service agent service account, check if the cluster was configured with an auto-delete duration that is less than the job duration.
To avoid Task not found errors, use automation to make sure that clusters are not deleted
before all running jobs have completed.
No space left on device
Dataproc writes HDFS and scratch data to disk. This error message indicates that the cluster was created with insufficient disk space. To analyze and avoid this error:
Check the cluster primary disk size listed under the Configuration tab on the Cluster details page in the Google Cloud console. The recommended minimum disk size is
1000 GBfor clusters using then1-standard-4machine-type and2 TBfor clusters using then1-standard-32machine-type.If the cluster disk size is less than the recommended size, recreate the cluster with at least the recommended disk size.
If disk size is the recommended size or greater, use SSH to connect to the cluster master VM, and then run
df -hon the master VM to check disk utilization to determine if additional disk space is needed.
