This page describes how to view and use the dashboard associated with a service.
Each service in your project has its own dashboard. The dashboard gives you observability into many aspects of the service and how it is performing, including logs, performance metrics, and the status of alerting policies.
You can bring up the dashboard for a service as follows:
For an existing service, click the name of the service in the inventory table on the Services Overview page. For more information, see Viewing your microservices.
After successfully defining a new custom service, click View service dashboard. See Defining a service for more information.
Dashboard structure
The per-service dashboards in Cloud Monitoring have the same general structure.
For all service types, the dashboard includes the following:
- Service details: provides identifying information for the service.
- Alerting information: describes how your alerting policies are behaving.
- Current SLO status: describes how your services are performing against their service-level objectives (SLOs).
- Logging information: displays recent log entries in Cloud Logging for this service.
For GKE-based services, the dashboard also includes the following:
- Metrics: displays charts for a selection of metrics related to your service.
- Entity details: lists information about the GKE entity on which the service is based.
Service details
The Service details pane displays the ID, type, and labels associated with the service. The following screenshot shows an example from an App Engine service:

Alerts timeline
The Alerts timeline pane shows the history of any SLO-based alerting policies that have recently fired. When an alerting policy fires, it raises an incident. The following screenshot shows the incidents raised in the last day:

The colored bands show the duration of the incident. To see more information about an incident, hover over the colored band. A card appears that identifies the alerting policy, indicates when the alerting policy fired, and shows the current status of the incident. Clicking View incident on the card takes you to the Incident details page in Cloud Monitoring. For more information about the incident details page, see Incident.
The default display period is one hour. To change the display period, select a different value in the Time Span selector.
To remove the alerting timeline from the display, click schedule Hide timeline.
Current SLO status
The Current status pane shows the status of each SLO defined for the service. The following screenshot shows the current status of a service with two SLOs:

Each SLO appears as a row in a table with the following columns:
- Status indicates if the service is meeting the SLO or not.
- Objective briefly describes the performance goal of the SLO.
- Type describes the service-level indicator (SLI) used in the SLO.
- Alerts firing displays the ratio of firing alerting policies to the total count of alerting policies.
- Error budget shows the percentage of the error budget remaining.
- more_vert More options shows configuration changes you can make to the service, like creating an alerting policy.
- expand_more Show more expands the current row to show more details about the performance of the SLO.
The Current status pane also includes a Create an SLO button. A service can have multiple SLOs. For information on creating SLOs, see Creating an SLO.
Status details
Clicking expand_more Show more expands the status row to show more details about the SLO:
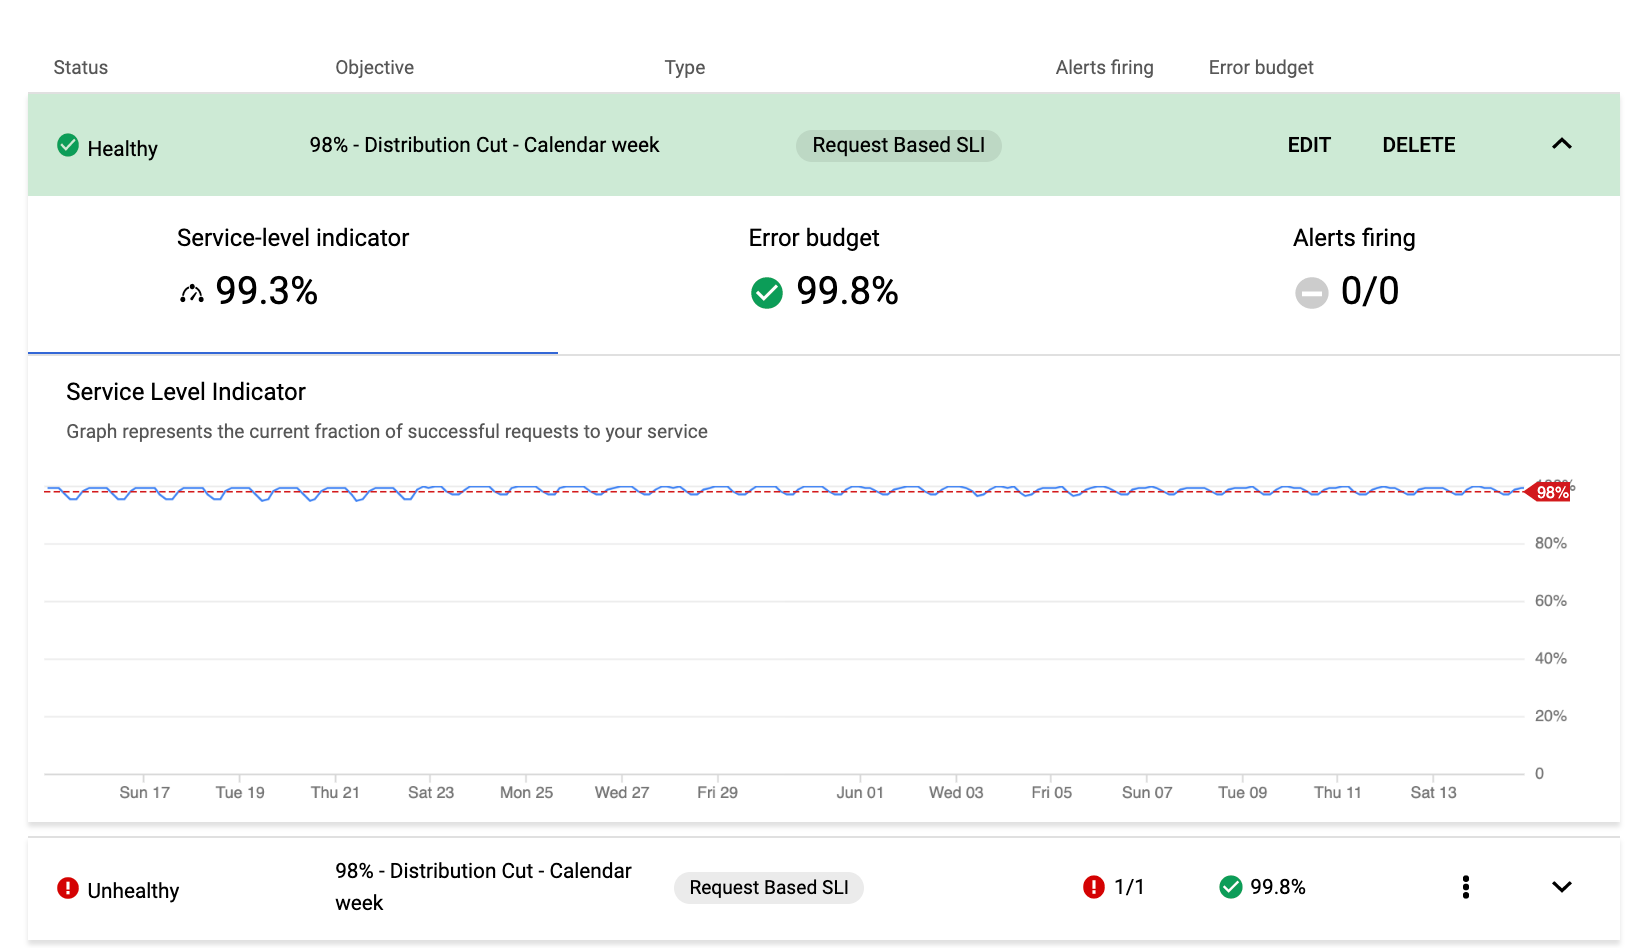
After you click expand_more Show more, the original entry is replaced by a color-coded bar that shows the status the SLO. The bar includes the display name and type of the SLO, and includes Edit and Delete buttons for changing or deleting the SLO configuration.
To return to the status summary view, click expand_less Show less.
The expanded details also includes status indicators for the following:
- Current value of the service-level indicator.
- Status and value of remaining error budget.
- Status of any alerting policies for this SLO.
These indicators are tabs, and selecting each tab changes the rest of the details display. By default, the Service-level indicator tab is selected, which presents a chart of the performance of the SLI over time against the SLO threshold. The previous screenshot includes that chart.
Error-budget tab
Click the Error budget tab to see a chart showing the consumption of the error budget over time.
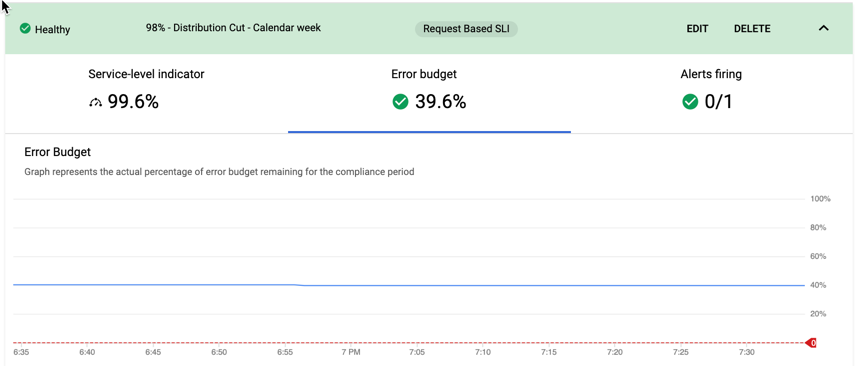
For each compliance period that the SLI doesn't meet the performance threshold for the SLO, some of the error budget is consumed. The details depend on the types of the SLO and the compliance period; see Error budgets and Trajectory of error budgets for more information.
When the error budget for the compliance period is exhausted, your service is failing to meet the SLO.
Alerts tab
Click the Alerts firing tab to see the number of open incidents and status of the alerting policy, and to define additional alerting policies:

Click View policy to go to the Policy details page for the alerting policy associated with this SLO.
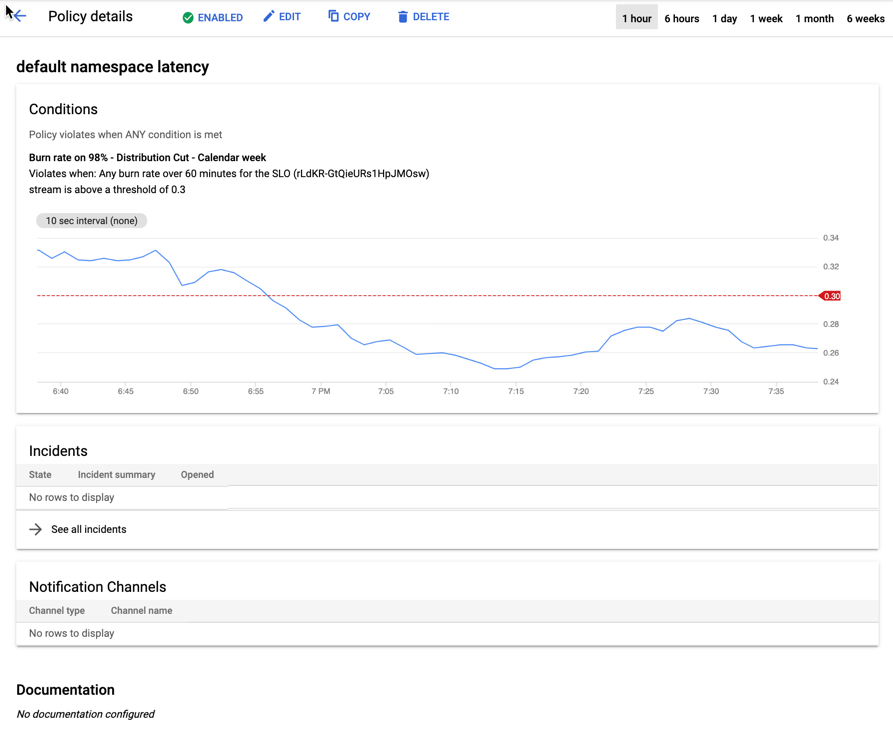
The Policy details displays a chart that shows you the rate at which your service is consuming its error budget. When you create an alerting policy, you set a threshold based on the size of the error budget and the length of the compliance period. The threshold is an estimate of the rate at which the error budget can be consumed without exhausting it before the end of the compliance period, and the alerting policy warns you when you exceed that rate.
For more information on how these alerting policies work, see Alerting on your burn rate; for information on creating an alerting policy, see Creating an alerting policy.
Logs
The Logs pane shows the log entries written by this service to Cloud Logging. The following screenshot shows an example:
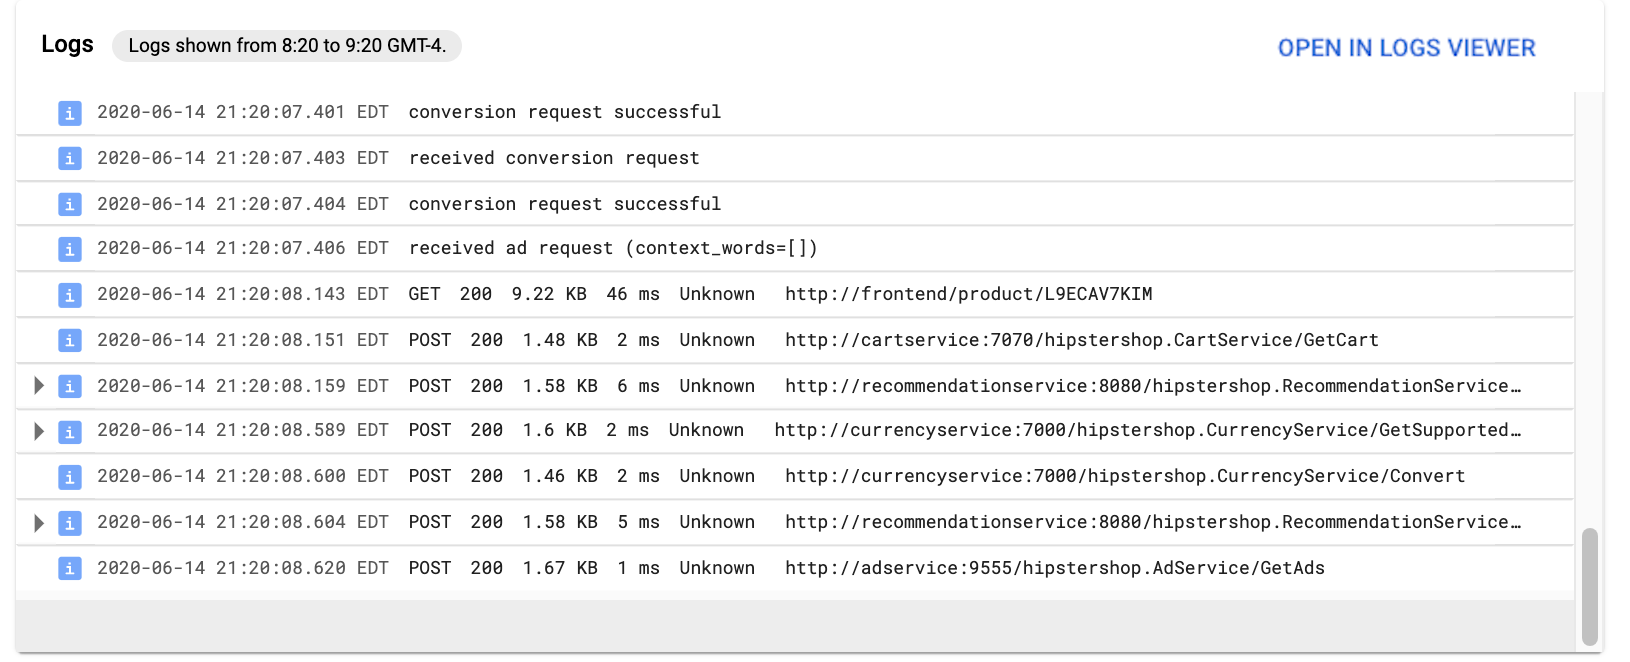
To analyze log entries, click Open in Logs Explorer, part of Cloud Logging. For more information, see View logs by using the Logs Explorer.
Metrics
For GKE-based services only.
The Metrics pane shows charts for a selection of the metrics written by the service. The set of available metrics depends on the type of entity the service represents. The following screenshot shows the default charts for a service based on a Kubernetes cluster:
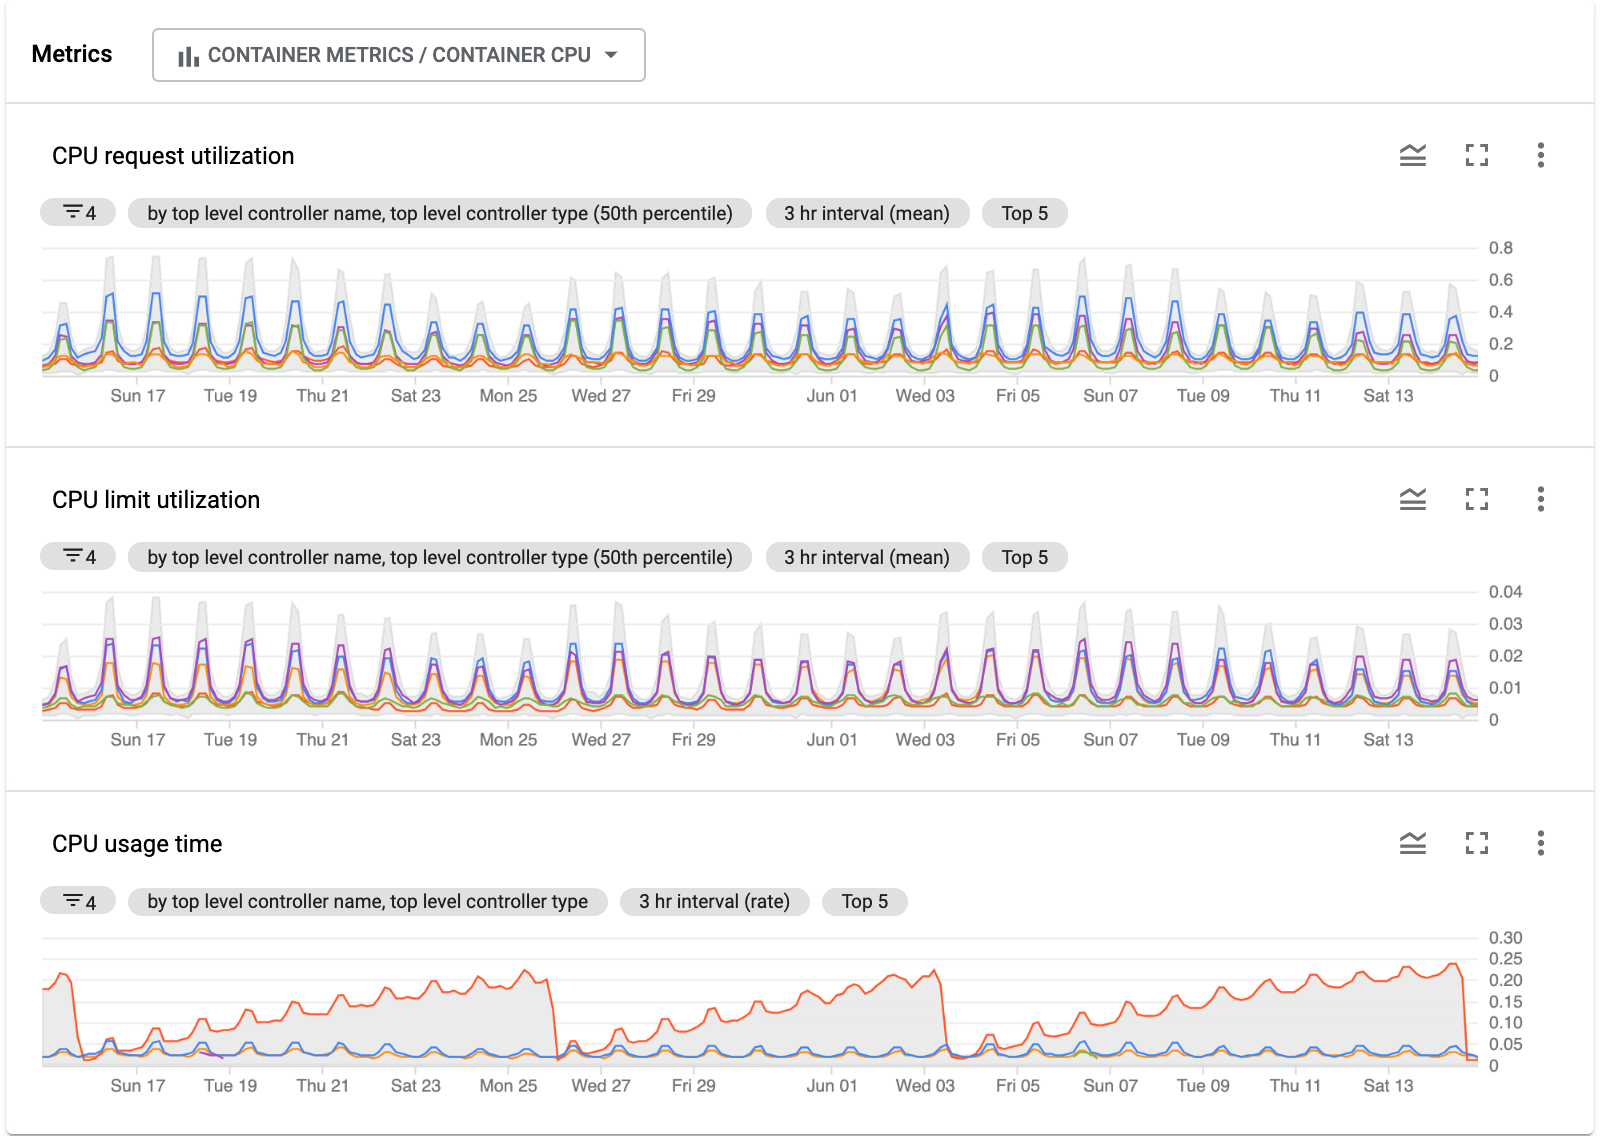
Each chart has a toolbar with the following buttons:
- legend_toggle Legend toggle displays a legend below the chart. For information on chart legends, see Configure legends.
- fullscreen Full screen displays the chart in full-screen mode.
- more_vert More options displays a menu with the following
choices:
- Download PNG saves an image of the chart in PNG format.
- View in Metrics Explorer opens the chart in Metrics Explorer, where you can change the data displayed by the chart and the display characteristics of the chart. For more information, see Metrics Explorer.
For general information on Monitoring charts, see Add dashboard widgets.
Other charts
For a cluster, the Metrics panel shows charts for CPU consumption in the cluster by default. You can view a different set of charts by selecting a different set of metrics from the metrics menu. The following screenshot shows the menu for a cluster-based service:
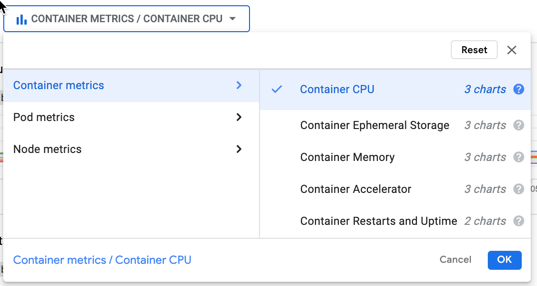
This menu shows the categories of metrics available for this service: container, pod, and network. Each of these categories contains a number of metric types with charts available on this pane.
The Metrics pane for the example service initially shows the charts for the container's CPU consumption, but there are also charts for the container's ephemeral storage, memory, and other metrics. Additionally, charts are available for pod and node metrics.
Click help Help for details about the metrics available on the charts. The chart choices on this menu correspond to metric types from the list of Kubernetes metrics.
Entity details
For GKE-based services only.
The Kubernetes entity details pane shows information about the GKE entities associated with this service. The information displayed depends on the type of entity the service represents. The following screenshot shows some of the entities in a service based on a Kubernetes cluster:

Each row in the table also has a more_vert More options button that brings up a menu of other ways to view information about this entity:
- View the Google Kubernetes Engine dashboard. For more information on this dashboard, see GKE dashboards in the Google Kubernetes Engine documentation.
- View the log entries written by this service in the Logs Explorer. For more information, see View logs by using the Logs Explorer.
