This document introduces microservices and describes the types of microservices supported by Cloud Monitoring.
The term microservice means different things to different people. For some, the microservice corresponds with the "boxes" drawn on the whiteboard when talking about system architecture. Others refer to a more formal definition that describes a network-addressable endpoint with functionality determined by its external-facing API that can be developed, deployed, and operated independently from other microservices in the system. Still others base their understanding on the microservice concept provided by their development platform, like the App Engine services or the Cloud Service Mesh service.
Our goal is not to force a definition of microservice upon you. Instead, we want to help you monitor your systems at scale during your digital transformation by providing service-oriented monitoring tools to support you and your architecture. We want to work with you to adopt best practices for monitoring systems without changing a single line of code.
To help you monitor your microservices, Cloud Monitoring does the following:
- Auto-detects microservices when possible
- Provides a guided experience for defining Google Kubernetes Engine- and Cloud Run-based microservices
- Offers a fully custom solution for maximum flexibility
Auto-discovered microservices
Some modern development frameworks offer opinionated concepts of a microservice. In architectures that use such frameworks, Cloud Monitoring automatically detects when services are deployed, updated, or deleted. Monitoring accomplishes this detection through constant analysis of the metadata stream produced by a project.
Cloud Monitoring can automatically detect microservices built using the following development frameworks:
App Engine: App Engine has a strong notion of microservice, called an App Engine service (and formerly a module). Each service is distinguished by its own
app.yamlconfiguration file.Cloud Service Mesh: Cloud Monitoring supports service meshes built atop a single GKE cluster. In this configuration, a Cloud Service Mesh service corresponds directly to a GKE service. All Cloud Service Mesh services, both user-managed and system-managed, are automatically detected.
Dashboards for auto-discovered microservices
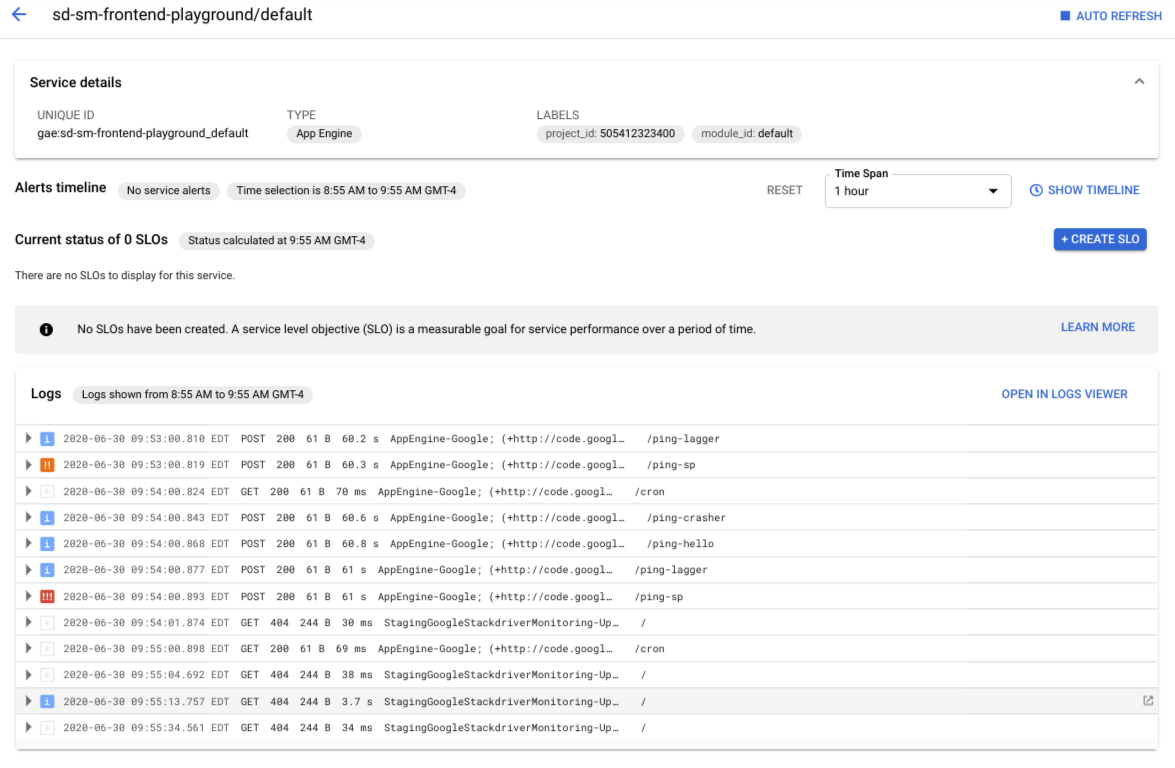
A service dashboard is automatically created for all auto-discovered microservices. The dashboard contains the metadata details of the service, the alert timeline, the status of your service-level objectives (SLOs), and logs related to the service. Each of these components is described in more detail in Using microservice dashboards.

GKE, Cloud Run and custom services
Cloud Monitoring can identify potential or candidate services for the following types:
- GKE namespaces
- GKE services
- GKE workloads
- Cloud Run services
However, there may be many such candidates, and you don't necessarily want to create SLOs on all of them. Monitoring creates a list of candidate services, and you identify the services you want to treat as Monitoring services by selecting them from the list. Monitoring then creates the service infrastructure for you.
When no existing service type accommodates an application for which you want to create SLOs, you can define a custom service.
For more information about identifying candidate services and creating custom services, see Defining a microservice.
