如果您建立自訂服務,也必須為這些服務建立服務等級目標 (SLO)。自訂服務沒有預先定義的服務等級目標。
您也可以為自動偵測到的服務建立自訂 SLO,但這種做法較不常見。
服務水準目標是以評估效能的指標為基礎,並做為服務水準指標 (SLI)。如果是自訂服務等級目標,您必須指明要在服務水準指標 (SLI) 中使用的指標。
如果您並未建立自訂 SLO,可以略過這個頁面。
合適指標類型的特徵
您可以為服務建立下列兩種 SLO:
- 以要求為準的服務等級目標。
- 時間範圍式服務等級目標。
服務等級目標是根據您選擇做為服務等級指標的指標類型而定。指標類型中的值會根據彼此的關聯性分類。這項分類稱為「指標種類」,可能的值有三種:GAUGE、DELTA, 和 CUMULATIVE。詳情請參閱 MetricKind。
如果是以要求為準的服務等級目標,服務水準指標代表良好要求與要求總數的比率。SLI 的指標種類必須為 DELTA 或 CUMULATIVE。您無法在以要求為準的 SLI 中使用 GAUGE 指標。
如果是以時間範圍為依據的 SLO,SLI 代表特定時間範圍內良好結果的數量。可接受的指標類型取決於您建構 SLI 的方式。不過,如果您使用以要求為準的 SLI,則 SLI 的指標類型必須為 DELTA 或 CUMULATIVE。您無法在以要求為準的 SLI 中使用 GAUGE 指標。詳情請參閱「以視窗為基礎的 SLI 結構」。
如要進一步瞭解 SLO 類型,請參閱服務監控概念。
您可以使用 Cloud Monitoring 提供的指標類型,也可以使用您建立的自訂指標類型。在這兩種情況下,這些值都適合用於您要建立的 SLI。
不適合的指標類型
考慮將指標類型做為 SLI 時,請避免使用高基數指標類型。基數說明可與指標類型建立關聯的時間序列數量,且與指標標籤可採用的值細微程度有關。如要瞭解基數,請參閱基數:時間序列和標籤。
如果指標類型含有標籤,且標籤會採用時間戳記等值,則很可能具有極高的基數,不適合做為 SLI 使用。高基數指標通常是使用者定義的指標,但設計時未避免基數問題。包括使用者定義的記錄指標和自訂指標。
尋找合適的指標類型
您可以在多個位置找到指標類型資訊,包括指標種類:
在 Metrics Explorer 等工具中使用的指標選取器,會顯示醒目顯示指標類型的懸浮資訊卡。這項工具適用於自訂和內建指標。
舉例來說,以下螢幕截圖顯示指標類型
loadbalancing.googleapis.com/https/request_count的懸浮資訊卡,如指標探索器所示: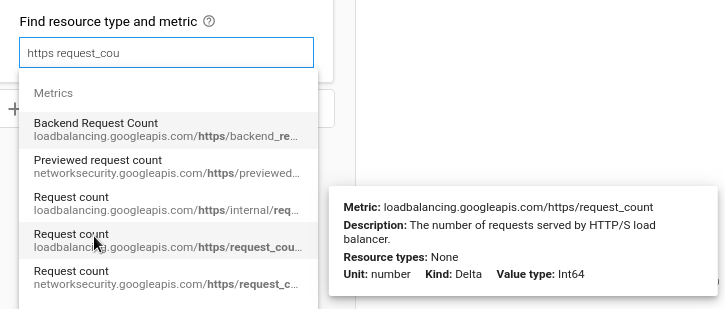
您也可以使用指標探索工具設定指標,模擬 SLO API 的運作方式,並取得該設定的 JSON 表示法。這個 JSON 可用於手動建立 SLI。
「指標清單」頁面包含各項服務的表格,詳細列出與服務相關聯的指標類型。這些表格包含所有內建指標類型,但不顯示自訂指標類型。
舉例來說,以下螢幕截圖顯示指標類型
loadbalancing.googleapis.com/https/request_count的項目,如負載平衡指標清單所示。這些項目通常比 Metrics Explorer 中的懸停資訊卡提供更多詳細資料。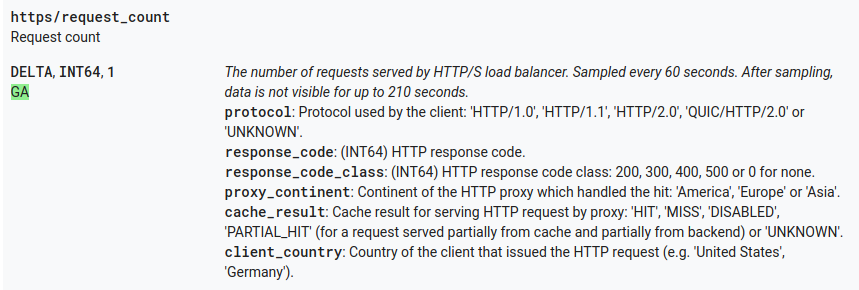
建構 SLI
服務監控會以特定方式處理指標資料,您可以在 Metrics Explorer 中複製這些方式。本頁面假設您熟悉如何使用 Metrics Explorer。如需更多資訊,請參閱「Metrics Explorer」。
如要根據時間序列比率建立應要求產生的 SLI,您需要兩個時間序列:一個代表所有要求,另一個代表良好 (或不良) 要求。這類 SLI 的結構如下:
  "requestBased": {
    "goodTotalRatio": {
      "totalServiceFilter": TO_BE_IDENTIFIED,
      "goodServiceFilter": TO_BE_IDENTIFIED,
    }
  }
如要取得 goodServiceFilter 欄位的值,請按照下列步驟操作:
選取受監控的資源類型和指標類型。請注意,指標種類必須是
DELTA或CUMULATIVE。結果可能包含許多不同的時間序列。舉例來說,選取
http_lb_rule資源類型和loadbalancing.googleapis.com/https/request_count指標類型。使用「篩選器」欄位,將標籤
response_code_class設為200。 這個篩選器會移除含有這個標籤其他值的任何時間序列。但仍可能有多個相符的時間序列。選擇
sum匯總工具,建立單一時間序列。「指標探索器」頁面上的圖表會顯示產生的時間序列。按一下圖表上方的「更多選項」圖示 more_vert,然後從選單中選取「以 JSON 格式查看」。
擷取的 JSON 如下所示:
"dataSets": [
  {
    "timeSeriesFilter": {
      "filter": "metric.type="loadbalancing.googleapis.com/https/request_count" resource.type="http_lb_rule" metric.label."response_code_class"="200""
      "perSeriesAligner": "ALIGN_RATE",
      "crossSeriesReducer": "REDUCE_SUM",
      "secondaryCrossSeriesReducer": "REDUCE_NONE",
      "minAlignmentPeriod": "60s",
      "groupByFields": [],
      "unitOverride": "1"
    },
    "targetAxis": "Y1",
    "plotType": "LINE"
  }
],
您感興趣的部分是嵌入 dataSets 物件的 filter 欄位值:
"filter": "metric.type="loadbalancing.googleapis.com/https/request_count" resource.type="http_lb_rule" metric.label."response_code_class"="200""
如要建構 SLI 結構,請按照下列步驟操作:
將這個值插入 SLI 結構中,做為
goodServiceFilter欄位的值。此外,請將這個值插入 SLI 結構做為
totalServiceFilter的值,但隨後移除篩選條件的標籤部分metric.label.\"response_code_class\"=\"200\"。
產生的服務水準指標如下:
  "requestBased": {
    "goodTotalRatio": {
      "totalServiceFilter": "metric.type="loadbalancing.googleapis.com/https/request_count" resource.type="http_lb_rule"",
      "goodServiceFilter": "metric.type="loadbalancing.googleapis.com/https/request_count" resource.type="http_lb_rule" metric.label."response_code_class"="200"",
    }
  }
接著,您可以將這項 SLI 插入 SLO,例如:
{
   "serviceLevelIndicator": {
      "requestBased": {
        "goodTotalRatio": {
          "totalServiceFilter": "metric.type="loadbalancing.googleapis.com/https/request_count" resource.type="http_lb_rule"",
          "goodServiceFilter": "metric.type="loadbalancing.googleapis.com/https/request_count" resource.type="http_lb_rule" metric.label."response_code_class"="200"",
        }
     }
   },
   "goal": 0.98,
   "calendarPeriod": "WEEK",
   "displayName": "98% Successful requests in a calendar week"
}
如要使用這個 JSON 建立 SLO,請參閱「建立 SLO」。