If you create custom services, then you must also create service-level objectives (SLOs) for them. There are no predefined SLOs for custom services.
You can also create custom SLOs for automatically detected services, but that is less common.
SLOs are built on top of metrics that measure performance and are used as service-level indicators (SLIs). For custom SLOs, you must identify the metrics you want to use in your SLIs.
If you are not creating custom SLOs, you can skip this page.
Characteristics of suitable metric types
There are two types of SLOs you can create for your services:
- Request-based SLOs.
- Windows-based SLOs.
SLOs are based on the metric types you choose as SLIs. The values in metrics
types are classified by how they are related to each other. This classification
is called the metric kind, and it has three possible values, GAUGE,
DELTA, and CUMULATIVE. For more information, see
MetricKind.
For request-based SLOs, your SLI represents a ratio of good requests
to total requests. The metric kind of your SLI must be
DELTA or CUMULATIVE. You can't use GAUGE metrics
in request-based SLIs.
For windows-based SLOs, your SLI represents a count of good outcomes in
a given period. The acceptable metric kinds depend on how you structure
the SLIs. However, if you use a request-based SLI, then the metric kind of your
SLI must be DELTA or CUMULATIVE. You can't use GAUGE metrics
in request-based SLIs.
For more information, see Structures for windows-based
SLIs.
For more information on the types of SLOs, see Concepts in service monitoring.
You can use metric types provided by Cloud Monitoring, or you can use custom metric types you've created. In both cases, the values are suitable for the SLI you want to create.
Unsuitable metric types
When considering a metric type for use as an SLI, avoid high-cardinality metric types. Cardinality describes the number of possible time series that can be associated with the metric type, and it is related to the granularity of the values that metric labels can take. For a discussion of cardinality, see Cardinality: time series and labels.
Metric types with labels that take values like timestamps are likely to have very high cardinality and are poor choices for use as SLIs. High-cardinality metrics are often user-defined metrics that have not been designed to avoid cardinality issues. These can include user-defined log-based metrics and custom metrics.
Finding suitable metric types
The information about metric types, including the metric kind, can be found in multiple places:
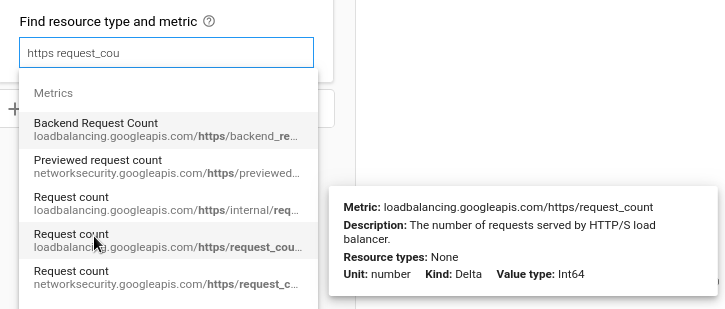
The metrics selector used in tools like Metrics Explorer displays a hover-card for the highlighted metric type. This tool works for custom and built-in metrics.
For example, the following screenshot shows the hover-card for the metric type
loadbalancing.googleapis.com/https/request_countas seen in Metrics Explorer:
With Metrics Explorer, you can also configure the metric to mimic what the SLO API does, and you can get a JSON representation of that configuration. This JSON is useful in creating an SLI manually.
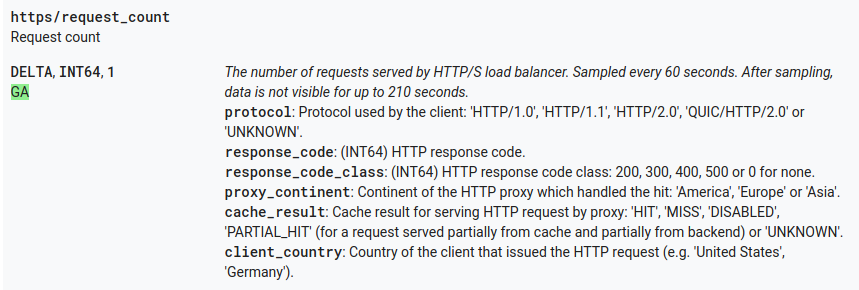
The pages in the Metrics list contain tables for each service that detail the metric types associated with the services. These tables include all the built-in metric types, but don't show custom metric types.
For example, the following screenshot shows the entry for the metric type
loadbalancing.googleapis.com/https/request_countas seen in the list of loadbalancing metrics. These entries often provide more detail than the hover-cards in Metrics Explorer.
Building the SLI
For service monitoring, metric data is processed in specific ways, which you can replicate in Metrics Explorer. This page assumes you are familiar with using Metrics Explorer. If you need more information, see Metrics Explorer.
To build a request-based SLI based on a time-series ratio, you need two time series: one that represents all requests, and one that represents good (or bad) requests. This type of SLI has the following structure:
  "requestBased": {
    "goodTotalRatio": {
      "totalServiceFilter": TO_BE_IDENTIFIED,
      "goodServiceFilter": TO_BE_IDENTIFIED,
    }
  }
To get the value for the goodServiceFilter field:
Select the monitored-resource type and metric type. Remember that the metric kind must be
DELTAorCUMULATIVE. The result might include many different time series.For example, select the
http_lb_ruleresource type and theloadbalancing.googleapis.com/https/request_countmetric type.Use the Filter field to set the label
response_code_classto200. This filter removes any time series with other values for this label. There still might be multiple time series that match.Choose the
sumaggregator to create a single time series. The chart on the Metrics Explorer page displays the resulting time series.Click More Options more_vert above the chart, and select View as JSON from the menu.
The retrieved JSON looks something like the following:
"dataSets": [
  {
    "timeSeriesFilter": {
      "filter": "metric.type="loadbalancing.googleapis.com/https/request_count" resource.type="http_lb_rule" metric.label."response_code_class"="200""
      "perSeriesAligner": "ALIGN_RATE",
      "crossSeriesReducer": "REDUCE_SUM",
      "secondaryCrossSeriesReducer": "REDUCE_NONE",
      "minAlignmentPeriod": "60s",
      "groupByFields": [],
      "unitOverride": "1"
    },
    "targetAxis": "Y1",
    "plotType": "LINE"
  }
],
The piece you are interested in is the value of the filter field embedded
in the dataSets object:
"filter": "metric.type="loadbalancing.googleapis.com/https/request_count" resource.type="http_lb_rule" metric.label."response_code_class"="200""
To build out the SLI structure:
Insert this value into the SLI structure as the value of the
goodServiceFilterfield.Also insert this value into the SLI structure as the value of the
totalServiceFilter, but then remove the label part of the filter,metric.label.\"response_code_class\"=\"200\".
The resulting service-level indicator follows:
  "requestBased": {
    "goodTotalRatio": {
      "totalServiceFilter": "metric.type="loadbalancing.googleapis.com/https/request_count" resource.type="http_lb_rule"",
      "goodServiceFilter": "metric.type="loadbalancing.googleapis.com/https/request_count" resource.type="http_lb_rule" metric.label."response_code_class"="200"",
    }
  }
You can then insert this SLI into an SLO, for example:
{
   "serviceLevelIndicator": {
      "requestBased": {
        "goodTotalRatio": {
          "totalServiceFilter": "metric.type="loadbalancing.googleapis.com/https/request_count" resource.type="http_lb_rule"",
          "goodServiceFilter": "metric.type="loadbalancing.googleapis.com/https/request_count" resource.type="http_lb_rule" metric.label."response_code_class"="200"",
        }
     }
   },
   "goal": 0.98,
   "calendarPeriod": "WEEK",
   "displayName": "98% Successful requests in a calendar week"
}
You can use this JSON to create an SLO, as described in Creating an
SLO.
