This document describes how you might set up an environment that mixes self-deployed collectors with managed collectors, across different Google Cloud projects and clusters.
We strongly recommend using managed collection for all Kubernetes environments; doing so practically eliminates the overhead of running Prometheus collectors within your cluster. You can run managed and self-deployed collectors within the same cluster. We recommend using a consistent approach to monitoring, but you might choose to mix deployment methods for some specific use cases, such as hosting a push gateway, as illustrated in this document.
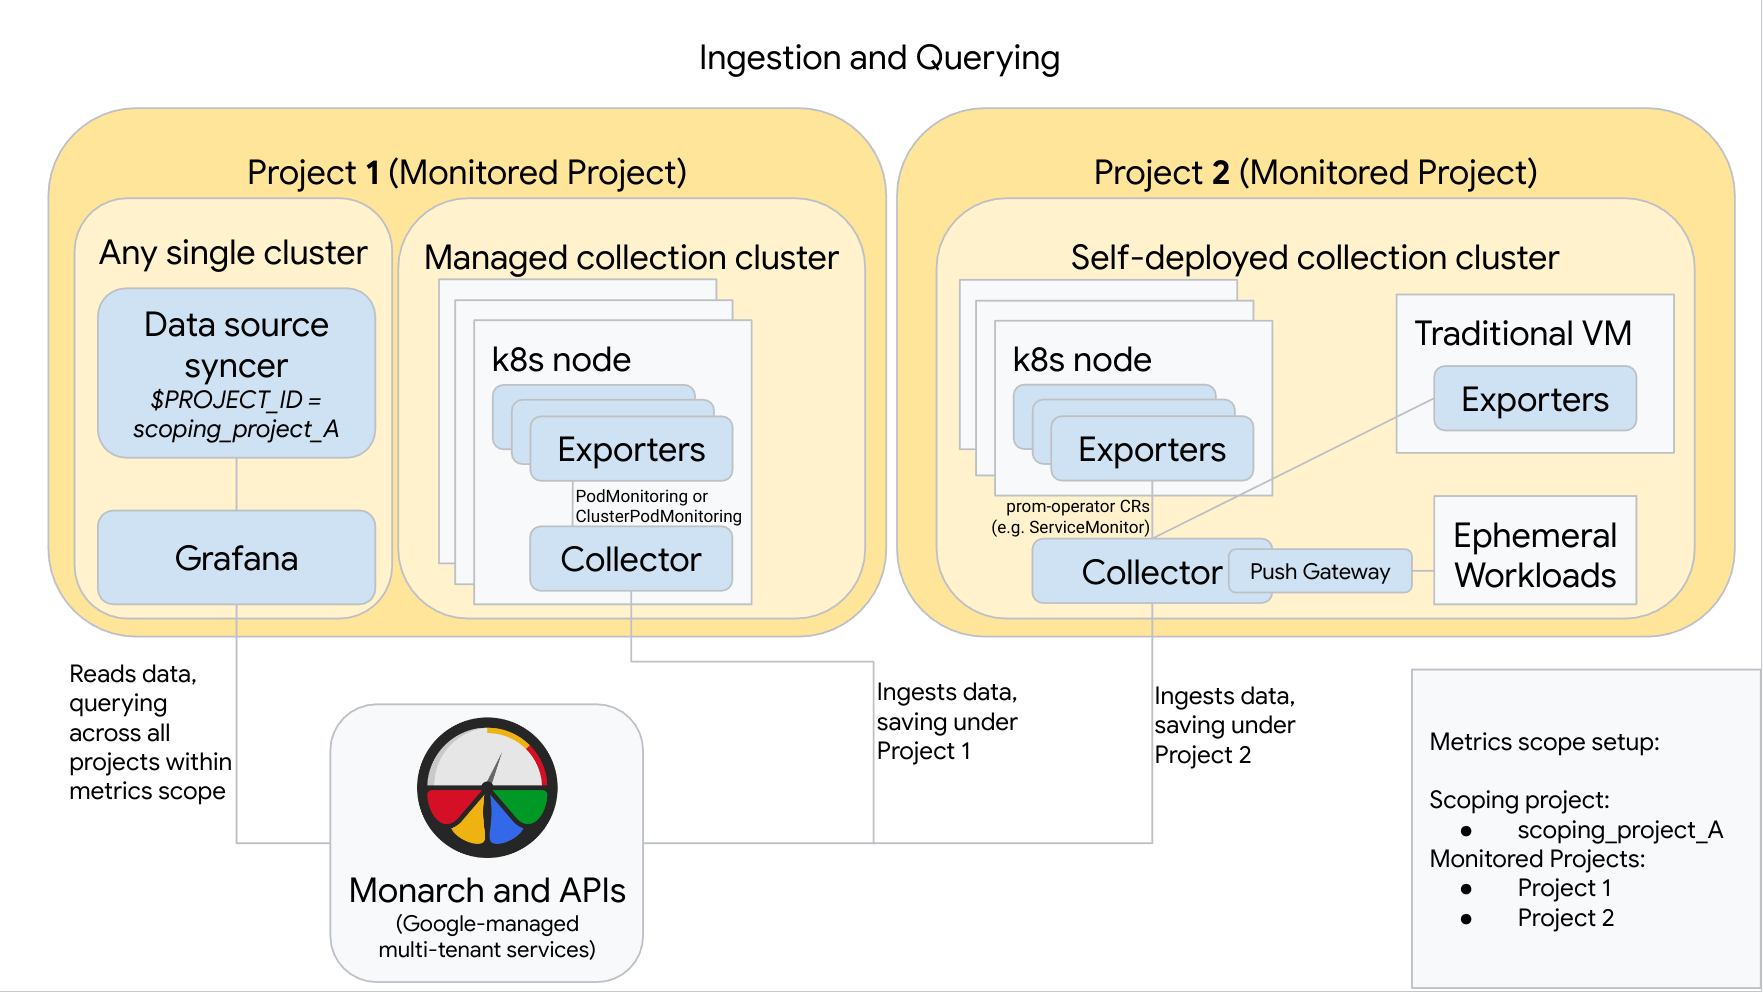
The following diagram illustrates a configuration that uses two Google Cloud projects, three clusters, and mixes managed and self-deployed collection. If you use only managed or self-deployed collection, then the diagram is still applicable; just ignore the collection style you aren't using:
To set up and use a configuration like the one in the diagram, note the following:
You must install any necessary exporters in your clusters. Google Cloud Managed Service for Prometheus does not install any exporters on your behalf.
Project 1 has a cluster running managed collection, which runs as a node agent. Collectors are configured with PodMonitoring resources to scrape targets within a namespace and with ClusterPodMonitoring resources to scrape targets across a cluster. PodMonitorings must be applied in every namespace in which you want to collect metrics. ClusterPodMonitorings are applied once per cluster.
All data collected in Project 1 is saved in Monarch under Project 1. This data is stored by default in the Google Cloud region from which it emitted.
Project 2 has a cluster running self-deployed collection using prometheus-operator and running as a standalone service. This cluster is configured to use prometheus-operator PodMonitors or ServiceMonitors to scrape exporters on pods or VMs.
Project 2 also hosts a push gateway sidecar to gather metrics from ephemeral workloads.
All data collected in Project 2 is saved in Monarch under Project 2. This data is stored by default in the Google Cloud region from which it emitted.
Project 1 also has a cluster running Grafana and the data source syncer. In this example, these components are hosted in a standalone cluster, but they can be hosted in any single cluster.
The data source syncer is configured to use scoping_project_A, and its underlying service account has Monitoring Viewer permissions for scoping_project_A.
When a user issues queries from Grafana, Monarch expands scoping_project_A into its constituent monitored projects and returns results for both Project 1 and Project 2 across all Google Cloud regions. All metrics retain their original
project_idandlocation(Google Cloud region) labels for grouping and filtering purposes.
If your cluster is not running inside Google Cloud, you must manually
configure the project_id and location labels. For information about setting
these values, see Run Managed Service for Prometheus outside of
Google Cloud.
Do not federate when using Managed Service for Prometheus. To reduce cardinality and cost by "rolling up" data before sending it to Monarch, use local aggregation instead. For more information, see Configure local aggregation.