This document outlines the steps to instrument a LangGraph ReAct Agent with OpenTelemetry, enabling collecting telemetry from the agent. User prompts and agent responses and choices are included in the telemetry as attributes attached to spans. Agent responses are also included in the log entries that are correlated with spans containing generative AI events. The instructions in this document apply when the agent uses Langchain's ChatVertexAI to call a Gemini model.
Instrument your generative AI application to collect telemetry
To instrument your generative AI application to collect log, metric, and trace data, do the following:
- Install OpenTelemetry packages
- Configure OpenTelemetry to collect and send telemetry
- Trace the invocation of the generative AI agent
Install OpenTelemetry packages
Add the following OpenTelemetry instrumentation and exporter packages:
pip install 'opentelemetry-instrumentation-vertexai>=2.0b0' \
  'opentelemetry-instrumentation-sqlite3' \
  'opentelemetry-exporter-gcp-logging' \
  'opentelemetry-exporter-gcp-monitoring' \
  'opentelemetry-exporter-otlp-proto-grpc'
Log and metric data is sent to your Google Cloud project by using the
Cloud Logging API or the Cloud Monitoring API. The
opentelemetry-exporter-gcp-logging and
opentelemetry-exporter-gcp-monitoring libraries invoke
endpoints in those APIs.
Trace data is sent to Google Cloud by using the
Telemetry (OTLP) API, which implements the
OpenTelemetry OTLP Protocol.
The opentelemetry-exporter-otlp-proto-grpc library
invokes the Telemetry (OTLP) API endpoint.
Your trace data is stored in a format that is generally consistent with the proto files defined by the OpenTelemetry OTLP Protocol. However, fields might be converted from an OpenTelemetry-specific data type to a JSON data type before storage. To learn more about the storage format, see Schema for trace data.
Configure OpenTelemetry to collect and send telemetry
Within the initialization code of your LangGraph agent, configure OpenTelemetry to capture and send telemetry to your Google Cloud project:
To view the full sample, click more_vert More, and then select View on GitHub.
Trace the invocation of the generative AI agent
To trace the execution of the LangGraph agent invocation, create a custom span around the agent invocation:
To view the full sample, click more_vert More, and then select View on GitHub.
You might want to include the previous code in key places in your application code.
To learn more about adding custom spans and metrics, see Add custom traces and metrics to your app.
Run the sample
This sample is a LangGraph agent instrumented with OpenTelemetry to send traces and logs with generative AI prompts and responses, and metrics to your Google Cloud project.
LangGraph agent persona
The LangGraph agent is defined as a SQL expert that has full access to an ephemeral SQLite database. The agent is implemented with the LangGraph prebuilt ReAct Agent and accesses the database, which is initially empty, using the SQLDatabaseToolkit.
Before you begin
- Sign in to your Google Cloud account. If you're new to Google Cloud, create an account to evaluate how our products perform in real-world scenarios. New customers also get $300 in free credits to run, test, and deploy workloads.
-
Install the Google Cloud CLI.
-
If you're using an external identity provider (IdP), you must first sign in to the gcloud CLI with your federated identity.
-
To initialize the gcloud CLI, run the following command:
gcloud init -
Create or select a Google Cloud project.
Roles required to select or create a project
- Select a project: Selecting a project doesn't require a specific IAM role—you can select any project that you've been granted a role on.
-
Create a project: To create a project, you need the Project Creator
(
roles/resourcemanager.projectCreator), which contains theresourcemanager.projects.createpermission. Learn how to grant roles.
-
Create a Google Cloud project:
gcloud projects create PROJECT_ID
Replace
PROJECT_IDwith a name for the Google Cloud project you are creating. -
Select the Google Cloud project that you created:
gcloud config set project PROJECT_ID
Replace
PROJECT_IDwith your Google Cloud project name.
-
Verify that billing is enabled for your Google Cloud project.
-
Enable the Vertex AI, Telemetry, Cloud Logging, Cloud Monitoring, and Cloud Trace APIs:
Roles required to enable APIs
To enable APIs, you need the Service Usage Admin IAM role (
roles/serviceusage.serviceUsageAdmin), which contains theserviceusage.services.enablepermission. Learn how to grant roles.gcloud services enable aiplatform.googleapis.com
telemetry.googleapis.com logging.googleapis.com monitoring.googleapis.com cloudtrace.googleapis.com -
Install the Google Cloud CLI.
-
If you're using an external identity provider (IdP), you must first sign in to the gcloud CLI with your federated identity.
-
To initialize the gcloud CLI, run the following command:
gcloud init -
Create or select a Google Cloud project.
Roles required to select or create a project
- Select a project: Selecting a project doesn't require a specific IAM role—you can select any project that you've been granted a role on.
-
Create a project: To create a project, you need the Project Creator
(
roles/resourcemanager.projectCreator), which contains theresourcemanager.projects.createpermission. Learn how to grant roles.
-
Create a Google Cloud project:
gcloud projects create PROJECT_ID
Replace
PROJECT_IDwith a name for the Google Cloud project you are creating. -
Select the Google Cloud project that you created:
gcloud config set project PROJECT_ID
Replace
PROJECT_IDwith your Google Cloud project name.
-
Verify that billing is enabled for your Google Cloud project.
-
Enable the Vertex AI, Telemetry, Cloud Logging, Cloud Monitoring, and Cloud Trace APIs:
Roles required to enable APIs
To enable APIs, you need the Service Usage Admin IAM role (
roles/serviceusage.serviceUsageAdmin), which contains theserviceusage.services.enablepermission. Learn how to grant roles.gcloud services enable aiplatform.googleapis.com
telemetry.googleapis.com logging.googleapis.com monitoring.googleapis.com cloudtrace.googleapis.com If you run the sample in the Cloud Shell, on Google Cloud resources, or on a local development environment, then the permissions listed in this section are sufficient. For production applications, typically a service account provides the credentials to write log, metric, and trace data.
To get the permissions that you need to for the sample application to write log, metric, and trace data, ask your administrator to grant you the following IAM roles on your project:
-
Cloud Telemetry Traces Writer (
roles/telemetry.tracesWriter) -
Logs Writer (
roles/logging.logWriter) -
Monitoring Metric Writer (
roles/monitoring.metricWriter) -
Vertex AI User (
roles/aiplatform.user)
-
Cloud Telemetry Traces Writer (
Run sample
To run the sample, do the following:
In the Cloud Shell, issue the following command:
git clone https://github.com/GoogleCloudPlatform/opentelemetry-operations-python.gitGo to the sample directory:
cd opentelemetry-operations-python/samples/langgraph-sql-agentConfigure environment variables:
# Capture GenAI prompts and responses
export OTEL_INSTRUMENTATION_GENAI_CAPTURE_MESSAGE_CONTENT=true
# Capture application logs automatically
export OTEL_PYTHON_LOGGING_AUTO_INSTRUMENTATION_ENABLED=true
Create a virtual environment and run the sample:
python -m venv venv/
source venv/bin/activate
pip install -r requirements.txt
python main.py
The application displays a message similar to the following:
Starting agent using ephemeral SQLite DB.To create a database, enter a value at the Talk to the SQL agent >> prompt, and then press Enter.
The actions taken by the agent are then displayed on your Cloud Shell.
The following illustrates sample interactions between a user and the application:
Talk to the SQL agent >> Create a new table to hold weather data.
👤 User: Create a new table to hold weather data.
🤖 Agent: I need to know what columns the table should have. What information about the weather do you want to store? For example, I could include columns for date, location, temperature, humidity, and precipitation.

Talk to the SQL agent >> Create a new table to hold weather data. Include date, location, temperature, humidity, and precipitation.
👤 User: Create a new table to hold weather data. Include date, location, temperature, humidity, and precipitation.
🤖 Agent

CREATE TABLE weather (
  date DATE,
  location VARCHAR(255),
  temperature REAL,
  humidity REAL,
  precipitation REAL
);
To exit, enter
Ctrl-C.
The actions performed by generative AI agents aren't deterministic, so you might see a different response for the same prompt.
View the traces, metrics, and logs
This section describes how can view generative AI events.
Before you begin
To get the permissions that you need to view your log, metric, and trace data, ask your administrator to grant you the following IAM roles on your project:
-
Logs Viewer (
roles/logging.viewer) -
Monitoring Viewer (
roles/monitoring.viewer) -
Cloud Trace User (
roles/cloudtrace.user)
For more information about granting roles, see Manage access to projects, folders, and organizations.
You might also be able to get the required permissions through custom roles or other predefined roles.
View telemetry
To view the generative AI events, use the Trace Explorer page:
-
In the Google Cloud console, go to the Trace explorer page:
You can also find this page by using the search bar.
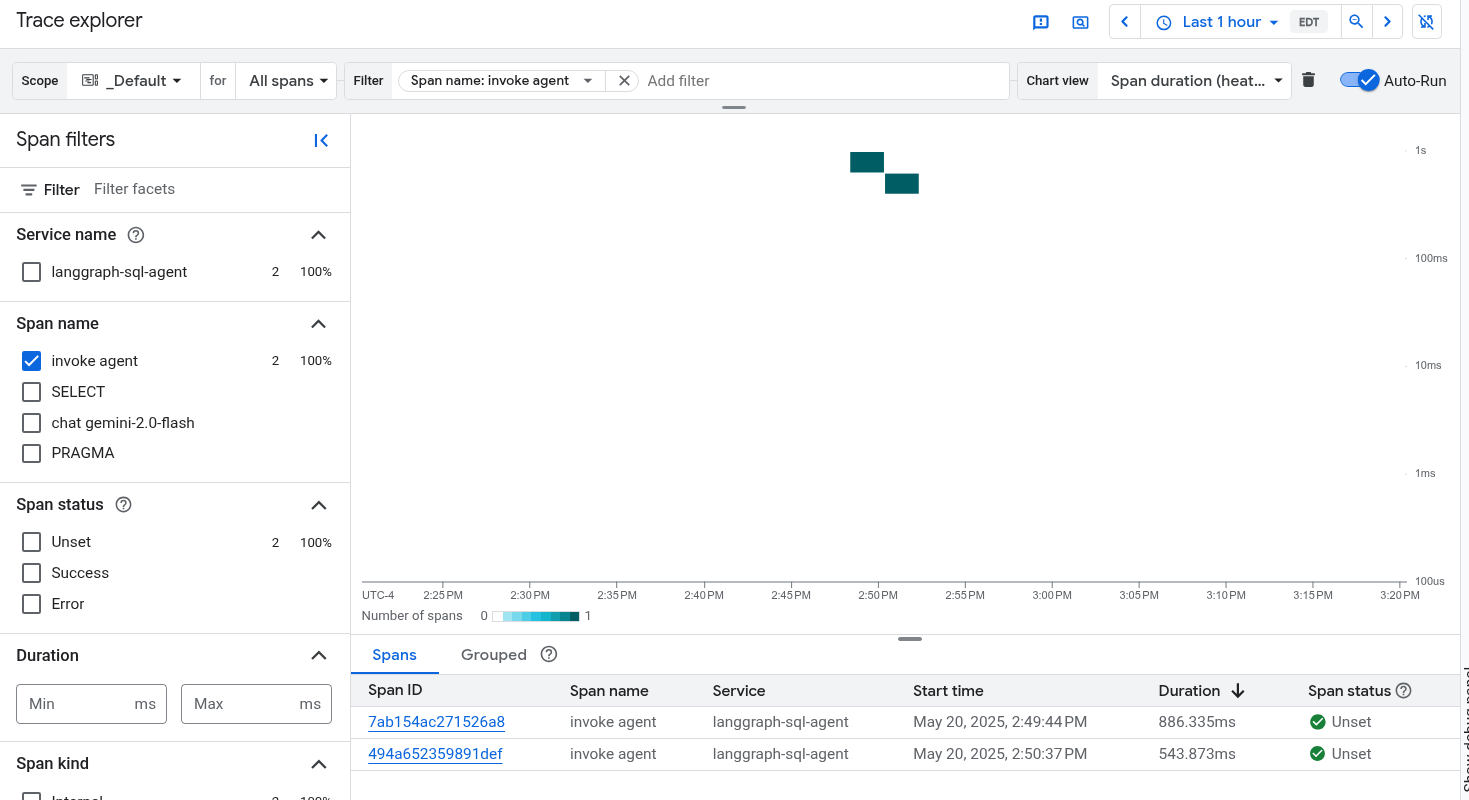
In the toolbar, select Add filter, select Span name, and then select
invoke agent.The Run sample section included an example execution where two prompts are sent to application. The following illustrates the Trace Explorer page after filtering the data:
If you've never used Cloud Trace before, then Google Cloud Observability needs to create a database to store your trace data. The creation of the database can take a few minutes and during that period, no trace data is available to view.
To explore your span and log data, in the Spans table, select a span.
The Details page opens. This page displays the associated trace and its spans. The table on the page displays detailed information for the span you selected. This information includes the following:
The GenAI tab displays events for generative AI agents. To learn more about these events, see View generative AI events.
The following screenshot illustrates a trace, where one span has the name
invoke_agent. That span invokes Gemini. The Gemini span includes generative AI events: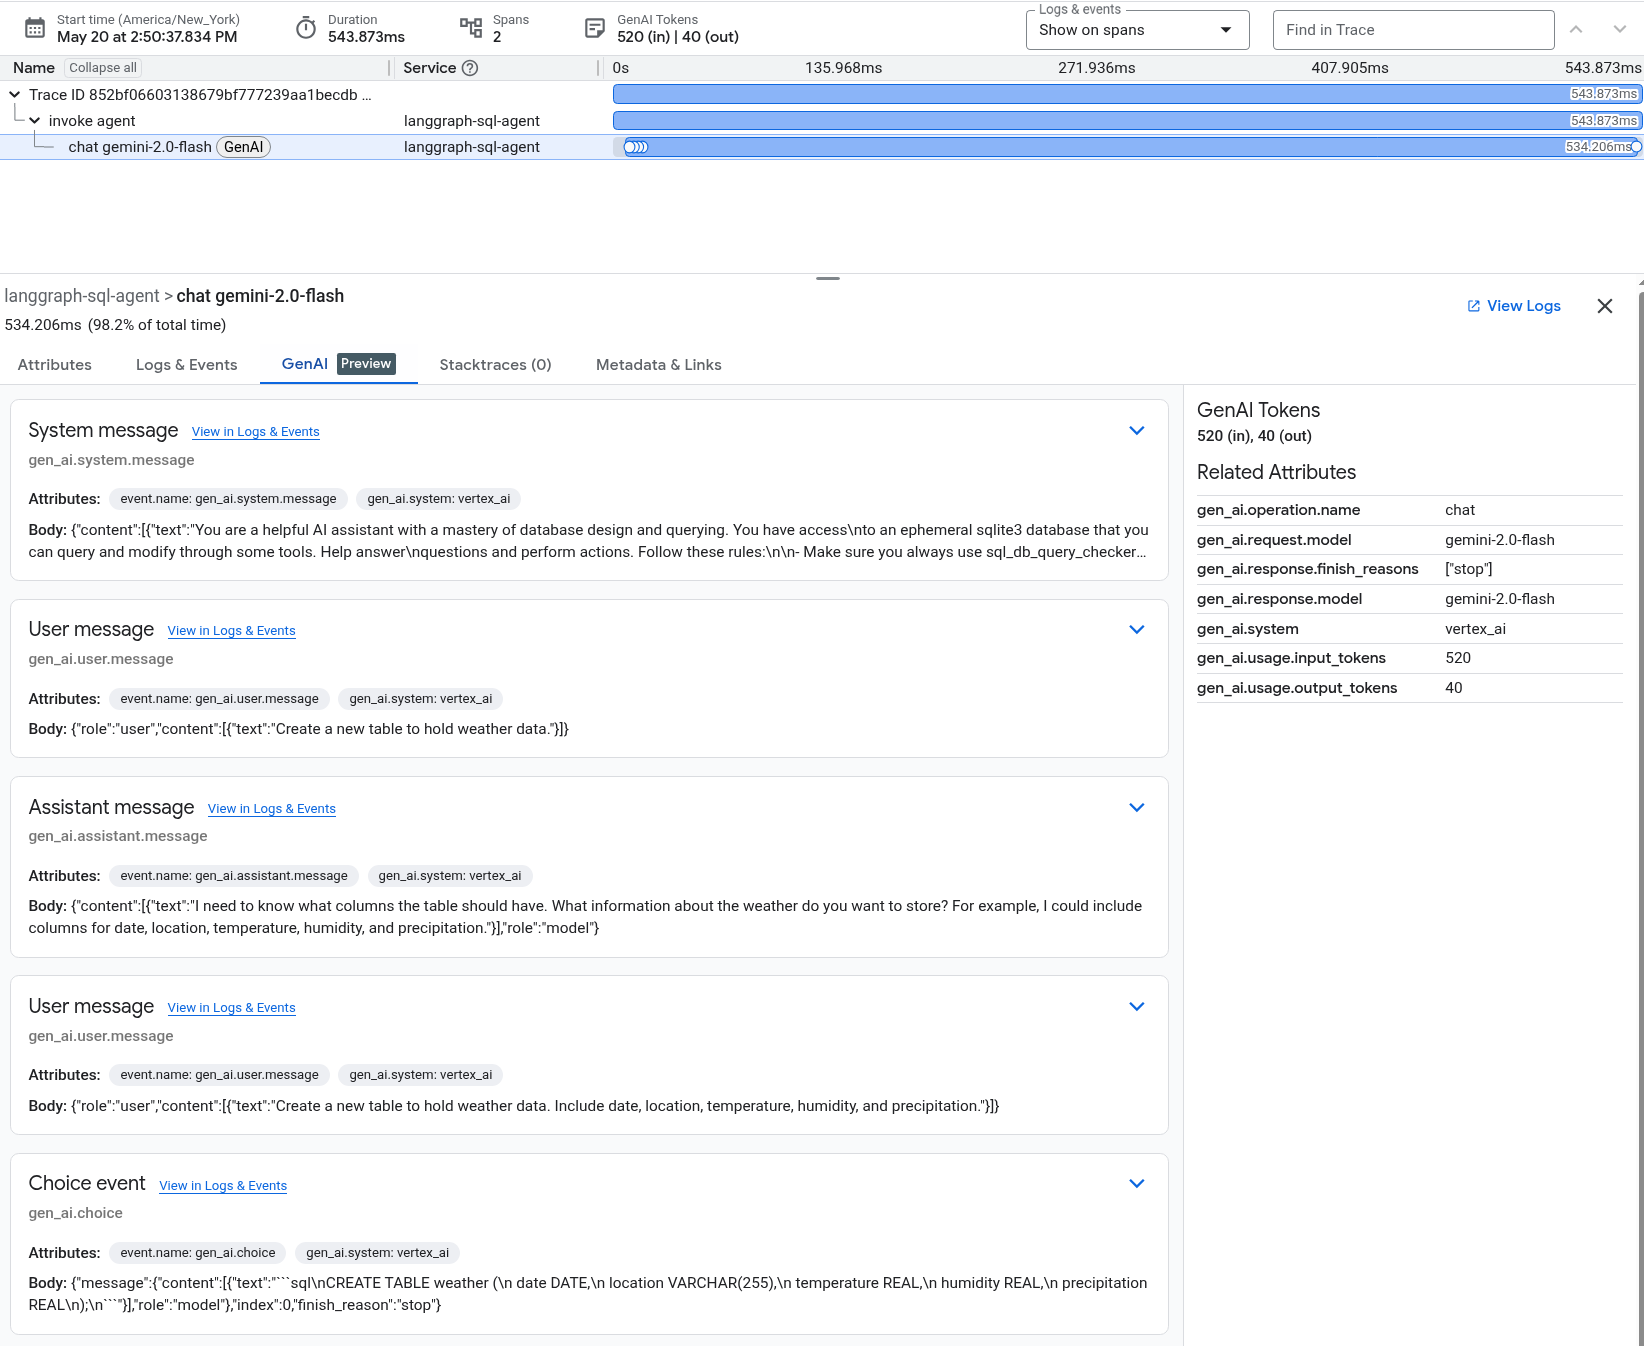
The Logs & Events tab lists log entries and events that are associated with the span. If you want to view the log data in the Logs Explorer, then in the toolbar of this tab, select View logs.
The log data includes the response of the LangGraph agent. For example, for the sample run, the JSON payload includes the following content:
{
  logName: "projects/my-project/logs/otel_python_inprocess_log_name_temp"
  jsonPayload: {
    finish_reason: "stop"
    message: {
      role: "model"
      content: [
        0: {
          text: "I need to know what columns the table should have. What information about the weather do you want to store? For example, I could include columns for date, location, temperature, humidity, and precipitation."
        }
      ]
    }
  index: 0
  }
...
}
The sample is instrumented to send metric data to your Google Cloud project, but it doesn't generate any metrics.