이 문서에서는 측정항목 데이터 포인트에 연결된 예시 데이터 포인트인 예시를 설명합니다. 예시의 한 가지 용도는 trace에 대한 링크를 저장하는 것이며, 이를 통해 측정항목과 trace 데이터의 상관관계를 파악할 수 있습니다. 이 문서에서는 OpenTelemetry를 사용하여 예시를 생성하는 방법도 설명합니다.
예시 정보
예시는 임의의 데이터를 측정항목 데이터와 연결하는 방법입니다. 이를 통해 측정에 비측정항목 데이터를 연결할 수 있습니다.
예시의 한 가지 용도는 trace 데이터를 측정항목 데이터와 연결하는 것입니다.
Cloud Monitoring에서는 Distribution 값 유형이 있는 측정항목 데이터에 예시를 연결할 수 있습니다. 분포 값 측정항목은 여러 측정값을 수집하여 버킷으로 그룹화합니다.
각 '포인트'는 버킷 개수를 나열하는 배열인 히스토그램입니다.
실제 측정값은 유지되지 않고 버킷 수만 유지됩니다. 자세한 내용은 분포 값 측정항목 정보를 참조하세요.
측정항목 데이터 포인트가 기록되면 Exemplar 객체 배열이 해당 데이터에 연결될 수 있습니다. 예시를 사용하면 측정항목 데이터에 유용한 정보를 연결할 수 있습니다. 예를 들어 OpenTelemetry가 예시를 작성하면 현재 trace의 스팬에 링크를 연결합니다.
히스토그램 데이터는 일반적으로 히트맵을 사용하여 표시됩니다. '포인트'에 예시가 포함된 경우 Cloud Monitoring은 히트맵에 점으로 주석을 추가합니다.
측정항목 포인트에 대한 요약 정보를 보려면 주석에 대한 도움말을 활성화합니다.
trace에 액세스하려면 주석을 선택합니다.
예를 들어 Go 계측 샘플은 OpenTelemetry를 사용하여 측정항목 데이터, trace 데이터, 예시를 작성합니다.
다음 스크린샷은 애플리케이션을 여러 번 실행한 후 prometheus/http_server_duration_milliseconds/histogram 측정항목의 값을 보여줍니다.
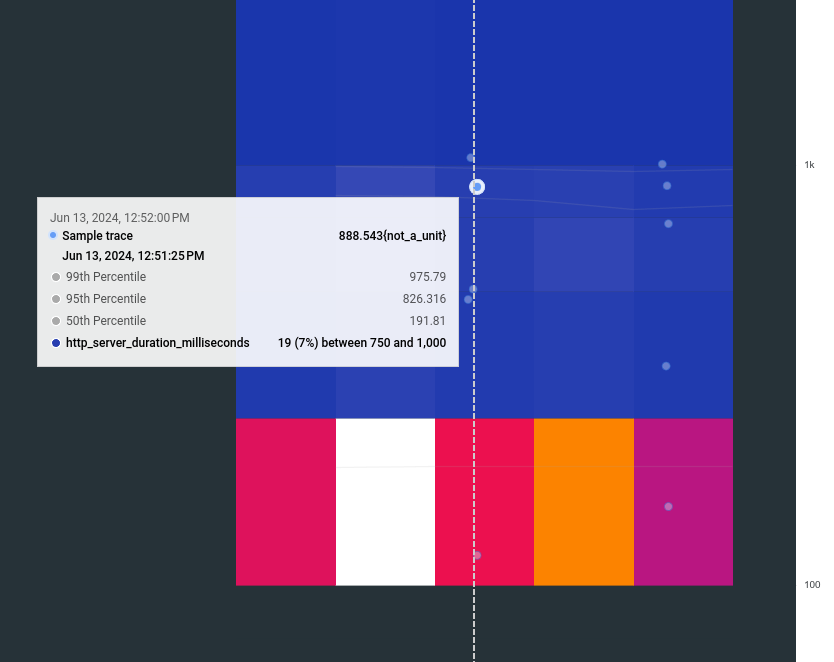
이전 스크린샷에는 여러 개의 예시가 표시됩니다. 예시 한 개의 도움말이 펼쳐져 있으며 날짜, trace 이름, 백분위수, 지연 시간 값이 표시됩니다.
주석을 선택하면 예시에 연결된 trace가 표시됩니다.
표시된 정보가 충분히 상세하지 않은 경우 Trace에서 보기를 선택하면 Trace 탐색기 페이지가 열립니다.
이 페이지에서 trace 속성을 확인하고 로그 항목 링크에 액세스할 수 있습니다.
OpenTelemetry 예시를 사용 설정하는 방법
이전 예에서 볼 수 있듯이, trace의 현재 스팬을 측정항목 측정에 연결하는 예시를 작성하도록 OpenTelemetry를 구성할 수 있습니다. 하지만 예시를 작성하려면 다음을 실행해야 합니다.
OpenTelemetry 측정항목 및 trace SDK를 모두 구성합니다.
커스텀 계측에 대한 예시를 포함하려면 측정항목이 스팬 내에 기록되어 있는지, 스팬에서 측정항목 측정값과 함께 컨텍스트를 전달하는지 확인해야 합니다.
예를 들어 computeSubrequests 함수는 이전 안내를 따릅니다. subRequestsHistogram.Record 함수는 지연되는 tracer.Start 뒤에, span.End 전에 호출됩니다.
컨텍스트 ctx가 tracer.Start에서 Record 함수로 전달된다는 점에 유의하세요.
funccomputeSubrequests(r*http.Request,subRequestsint)error{// Add custom span representing the work done for the subrequestsctx,span:=tracer.Start(r.Context(),"subrequests")deferspan.End()// Make specified number of http requests to the /single endpoint.fori:=0;i < subRequests;i++{iferr:=callSingle(ctx);err!=nil{returnerr}}// record number of sub-requests madesubRequestsHistogram.Record(ctx,int64(subRequests))returnnil}
[[["이해하기 쉬움","easyToUnderstand","thumb-up"],["문제가 해결됨","solvedMyProblem","thumb-up"],["기타","otherUp","thumb-up"]],[["이해하기 어려움","hardToUnderstand","thumb-down"],["잘못된 정보 또는 샘플 코드","incorrectInformationOrSampleCode","thumb-down"],["필요한 정보/샘플이 없음","missingTheInformationSamplesINeed","thumb-down"],["번역 문제","translationIssue","thumb-down"],["기타","otherDown","thumb-down"]],["최종 업데이트: 2025-07-10(UTC)"],[],[],null,["# Correlate metrics and traces by using exemplars\n\nThis document describes *exemplars* , which are example data points attached to\na metric data point. One use of exemplars is to store a link to a trace,\nwhich lets you correlate your metric and trace data. This document also\ndescribes how you can use [OpenTelemetry](https://opentelemetry.io/docs/what-is-opentelemetry/)\nto generate exemplars.\n\nAbout exemplars\n---------------\n\nExemplars are a way to associate arbitrary data with metric data. You can use\nthem to attach non-metric data to measurements.\nOne use of exemplars is to associate trace data with metric data.\nIn Cloud Monitoring, exemplars can be\nattached to metric data that has the [`Distribution`](/monitoring/api/ref_v3/rest/v3/TypedValue#Distribution)\nvalue type. Distribution-valued metrics collect many measurements and group\nthem into buckets.\nEach \"point\" is a histogram, which is an array that lists bucket counts.\nThe actual measurements\naren't retained, only the bucket counts. For more information, see\n[About distribution-valued metrics](/monitoring/charts/charting-distribution-metrics).\n\nWhen a metric data point is written, an array of [`Exemplar`](/monitoring/api/ref_v3/rest/v3/TypedValue#Exemplar)\nobjects can be attached to that data. Exemplars, when used,\nattach useful information to the metric data. For example,\nwhen OpenTelemetry write an exemplar, it attaches a link to the current\n[span of a trace](https://opentelemetry.io/docs/concepts/signals/traces/#spans).\n\nHistogram data is typically displayed by using a heatmap. When a \"point\"\ncontains an exemplar, Cloud Monitoring annotates the heatmap with a dot:\n\n- To view summary information about the metric point, activate the tooltip for the annotation.\n- To access the trace, select the annotation.\n\nFor example, the\n[Go instrumentation sample](/stackdriver/docs/instrumentation/setup/go) uses OpenTelemetry to\nwrites metric data, trace data, and exemplars.\nThe following screenshot shows the value of the\n`prometheus/http_server_duration_milliseconds/histogram` metric after\nseveral executions of the application:\n\nThe previous screenshot shows multiple exemplars. The tooltip for one exemplar\nis expanded, and it shows the date, the trace name, percentiles,\nand a latency value.\n\nWhen the annotation is selected, the trace linked in the exemplar is displayed:\n\nWhen the displayed information isn't sufficiently detailed, you can select\n**View in Trace** , which opens the **Trace Explorer** page.\nOn that page, you can view trace attributes and access links to log entries.\n\nHow to enable OpenTelemetry exemplars\n-------------------------------------\n\nAs the previous example illustrates, you can configure OpenTelemetry to\nwrite exemplars that link the current [span](https://opentelemetry.io/docs/concepts/signals/traces/#spans) of a trace to a\nmetric measurement. However, for exemplars to be written, you must do the\nfollowing:\n\n1. Configure both the OpenTelemetry metric and trace SDKs.\n2. To include exemplars on your custom instrumentation,\n ensure that the metric is recorded within a span,\n and that you pass the context from the span with the metric measurement.\n\n For example, the `computeSubrequests` function follows the previous\n guidance. The function `subRequestsHistogram.Record` is invoked after\n `tracer.Start` and before `span.End`, which is deferred.\n Also notice that the context, `ctx`, is passed from `tracer.Start` to\n the `Record` function: \n\n func computeSubrequests(r *http.Request, subRequests int) error {\n \t// Add custom span representing the work done for the subrequests\n \tctx, span := tracer.Start(r.Context(), \"subrequests\")\n \tdefer span.End()\n\n \t// Make specified number of http requests to the /single endpoint.\n \tfor i := 0; i \u003c subRequests; i++ {\n \t\tif err := callSingle(ctx); err != nil {\n \t\t\treturn err\n \t\t}\n \t}\n \t// record number of sub-requests made\n \tsubRequestsHistogram.Record(ctx, int64(subRequests))\n \treturn nil\n }\n\n For more information about this sample, see\n [Add custom traces and metrics to your app](/stackdriver/docs/instrumentation/advanced-topics/custom-instrumentation).\n\nWhat's next\n-----------\n\n- [OpenTelemetry](https://opentelemetry.io/docs/what-is-opentelemetry/)\n- [OpenTelemetry Exemplars](https://opentelemetry.io/docs/specs/otel/metrics/data-model/#exemplars)\n- [OpenTelemetry Metrics Data Model](https://opentelemetry.io/docs/specs/otel/metrics/data-model/)\n- [OpenTelemetry Histogram](https://opentelemetry.io/docs/specs/otel/metrics/data-model/#histogram)"]]