資料庫觀測功能可衡量您根據資料庫系統在記錄、指標和追蹤記錄中產生的資料或遙測資料,推論資料庫系統內部狀態的準確程度。
如果應用程式涉及資料庫,診斷及解決問題可能特別困難且耗時。收集遙測資料至關重要。如果遙測資料包含應用程式環境資訊,就能更瞭解資料庫執行個體、觀察其狀態,並簡化維護作業。您可以輕鬆找出問題和趨勢,並及早補救,不必付出高昂的停機成本。此外,您可以使用這類資料,設定較新的資料庫執行個體,從啟動時開始收集正確的資料。
您可以有效運用資料,主動防範問題,並專注於策略創新。在開發運作模型中,良好的遙測資料收集功能特別實用,因為資料庫通才需要獨立分析遙測資料,監控、評估及最佳化快速演進的應用程式效能和健康狀態。
Google Cloud 提供多項強大功能,涵蓋四個疊代式可觀測性階段,協助您維護 Cloud SQL 資料庫的健康狀態。
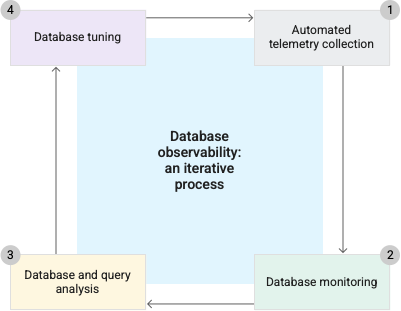
自動收集遙測資料
為達成可觀測性目標,我們首先會收集遙測資料,最好是透過自動化程序收集。收集一段時間後,遙測資料有助於建立不同負載條件下的指標基準。
Google Cloud 服務會自動產生可觀測性資料,包括指標、記錄檔和追蹤記錄,有助於提供完整的可觀測性總覽。
Cloud Monitoring 會收集您的服務和使用 Google Cloud 資源的計量結果。Cloud SQL 會使用內建的記憶體自訂代理程式收集查詢遙測資料,因此對效能的影響較小,且不需要維護代理程式或處理安全性負擔。
Cloud Logging 會收集常見應用程式元件的記錄資料。如為 Cloud SQL,請參閱查看執行個體記錄。
Cloud Trace 會收集應用程式的延遲資料和執行的查詢計畫,協助您追蹤要求在應用程式中的傳播情形。您可以比較這些延遲時間分配情形在不同時間或版本之間的差異。如果應用程式已完成檢測,並使用 Cloud Trace,當 Cloud Trace 偵測到應用程式的延遲設定檔出現重大變化時,就會發出快訊。
Sqlcommenter 是資料庫適用的 OpenTelemetry 程式庫,可協助您從應用程式的角度監控資料庫。Sqlcommenter 會自動檢測 ORM,以使用標記擴增 SQL 陳述式,並允許 OpenTelemetry 追蹤內容資訊傳播至資料庫。
有了資料庫中的標記和追蹤應用程式內容,就能輕鬆將應用程式程式碼與資料庫效能建立關聯,並排解微服務架構的問題。
資料庫監控
妥善監控有助於判斷應用程式是否以最佳狀態運作。請盡早導入監控功能,例如在啟動遷移作業或將新應用程式部署到正式環境之前。釐清應用程式問題和基礎雲端問題。
Cloud SQL 系統洞察資訊主頁會考量整體資料庫健康狀態和效能的幾項重要信號。
資訊主頁會顯示幾個重要指標的圖表,協助您深入瞭解輸送量、延遲時間和費用等問題。這些深入分析資料可協助您根據應用程式需求的變化,主動做出回應。您可以比較目前的成效與過去的趨勢,找出可能需要調查的異常狀況。
Cloud SQL 的「總覽」頁面會顯示部分主要指標的圖表。
Cloud SQL 也可協助您比較所選執行個體的指標。
您可以透過 Cloud Monitoring 建立自訂資訊主頁,監控指標並設定快訊政策,及時接收通知。
資料庫和查詢分析
Cloud SQL 查詢洞察工具提供監控和診斷功能,可協助您偵測及修正查詢效能問題。
查詢洞察資訊主頁可協助您及早找出查詢效能問題,並透過單一介面從偵測問題到解決問題。內建的視覺化查詢計畫可協助您排解問題,找出根本原因。您也可以使用情境式端對端應用程式追蹤功能,找出有問題的查詢來源。
查詢洞察功能提供以應用程式為中心的監控工具,協助您診斷使用物件關係對應 (ORM) 建構的應用程式效能問題。您可以為查詢加上與查詢相關聯的業務邏輯標記,例如付款、庫存、業務分析或運送。查詢深入分析可與現有的 APM 工具整合,讓您使用偏好的工具監控及排解查詢問題。
查詢洞察工具會使用 sqlcommenter 自動檢測 ORM。這項插碼作業有助於找出導致問題的應用程式碼。查詢洞察支援 OpenTelemetry 標準,並透過 Google Cloud Observability API,將查詢指標和追蹤資料提供給 APM 工具。
Query Insights 與 Cloud Monitoring 整合,可讓您根據查詢指標或標記建立自訂資訊主頁和快訊,並透過電子郵件、簡訊、Slack、PagerDuty 等管道接收通知。
資料庫調整
您可以反覆排解及調整資料庫問題。
Cloud SQL 建議工具可協助您分析資料庫目前的用量,並根據啟發式方法和機器學習提供建議和洞察。
Cloud SQL 建議工具簡介如下:
| 名稱 | 說明 |
|---|---|
| 磁碟空間不足建議工具 | 減少 Cloud SQL 執行個體磁碟空間不足可能導致的停機風險。 |
| 閒置執行個體推薦功能 | 關閉不慎閒置的 Cloud SQL 執行個體,藉此降低成本。 |
| 過度佈建的執行個體建議工具 | 如果 Cloud SQL 執行個體對於特定工作負載而言過大,請調整大小來降低成本。 |
| 佈建不足的執行個體建議工具 | 如要避免因 CPU 和記憶體用量偏高而產生瓶頸,並盡可能降低記憶體不足的機率,請調整 CPU 和/或記憶體用量偏高的 Cloud SQL 執行個體大小。 |
| 交易 ID 使用率偏高推薦功能 | 避免 PostgreSQL 適用的 Cloud SQL 執行個體發生潛在的交易 ID 環繞,藉此提升執行個體效能。 |
後續步驟
- 查看 Cloud SQL 指標清單。
- 使用查詢洞察功能提高查詢效能。
- 使用系統洞察資料提升執行個體效能。
- 觀看影片:隆重推出 Cloud SQL Insights。
- 請參閱發布網誌:開發人員的資料庫觀測功能:隆重推出 Cloud SQL Insights。
- 閱讀網誌:透過 Cloud SQL Insights 提升查詢效能疑難排解技能。
- 閱讀網誌:使用 Sqlcommenter 啟用查詢標記。
- 進一步瞭解 Cloud Logging 和 Cloud Monitoring。另請參閱「查看執行個體記錄檔」。
- 排解及調整資料庫執行個體。
- 進一步瞭解Google Cloud 推薦者。