Performance optimization tips for MySQL
Performance optimization is a critical aspect of managing any database. Performance optimization can be performed at every step of the database management, starting from choosing the hardware and software components for hosting the database servers to data model design and schema configurations. This document covers performance optimization tips for MySQL databases in the cloud, specifically, Cloud SQL for MySQL, including best practices for instantiating new databases and optimizing existing ones.
Related Articles
Hardware considerations
Hardware configurations are an important consideration for database performance. It is important to have a good understanding of the number of active and concurrent users of an application, size of the database and indexes, and expected latency of your application or service before defining the hardware configurations. Following are some of the important hardware considerations:
Central Processing Unit (CPU)
Processing power is one of the most important factors in a performant database system. The number of concurrent connections/users/threads determines the number of cores required to process database requests. The CPU allocated to the database needs to be able to handle normal workload + peak (extreme) workload for applications to perform at optimal levels.
In the case of Cloud SQL, Google Cloud’s fully-managed MySQL offering, CPU is allocated in the form of virtual CPU (vCPU). The number of vCPUs allocated to a database ultimately determines the amount of memory and network throughput for a database instance as each vCPU has a maximum amount of memory allocated to it and even network throughput varies based on the number of vCPUs. Cloud SQL provides flexibility to scale the number of vCPUs for your instance making it easy to meet memory and network throughput requirements of your application.
Memory
An important consideration for determining the amount of memory to allocate for a database is to make sure that the working set fits in the buffer pool. A working set is the data actively used at any moment by the database. Memory allocated should be sufficient to hold this working set or frequently accessed data, which usually consists of database data, indexes, session buffers, dictionary cache, and hash tables. One way to check if enough memory has been allocated is to check the disk reads status in the database. Ideally disk reads should be less or very minimal under normal workload conditions.
In case of insufficient memory allocation to the instance, the instance may run into “Out of Memory” issues which will cause the database instance to restart and lead to database or application downtime.
Storage
Database storage is another component that plays an important role in performance optimization. Cloud SQL offers 2 types of Storage
- SSD (default)
- HDD
SSD provides much better performance and throughput than HDD. Hence always chose SSD for better performance, specially for production workloads.
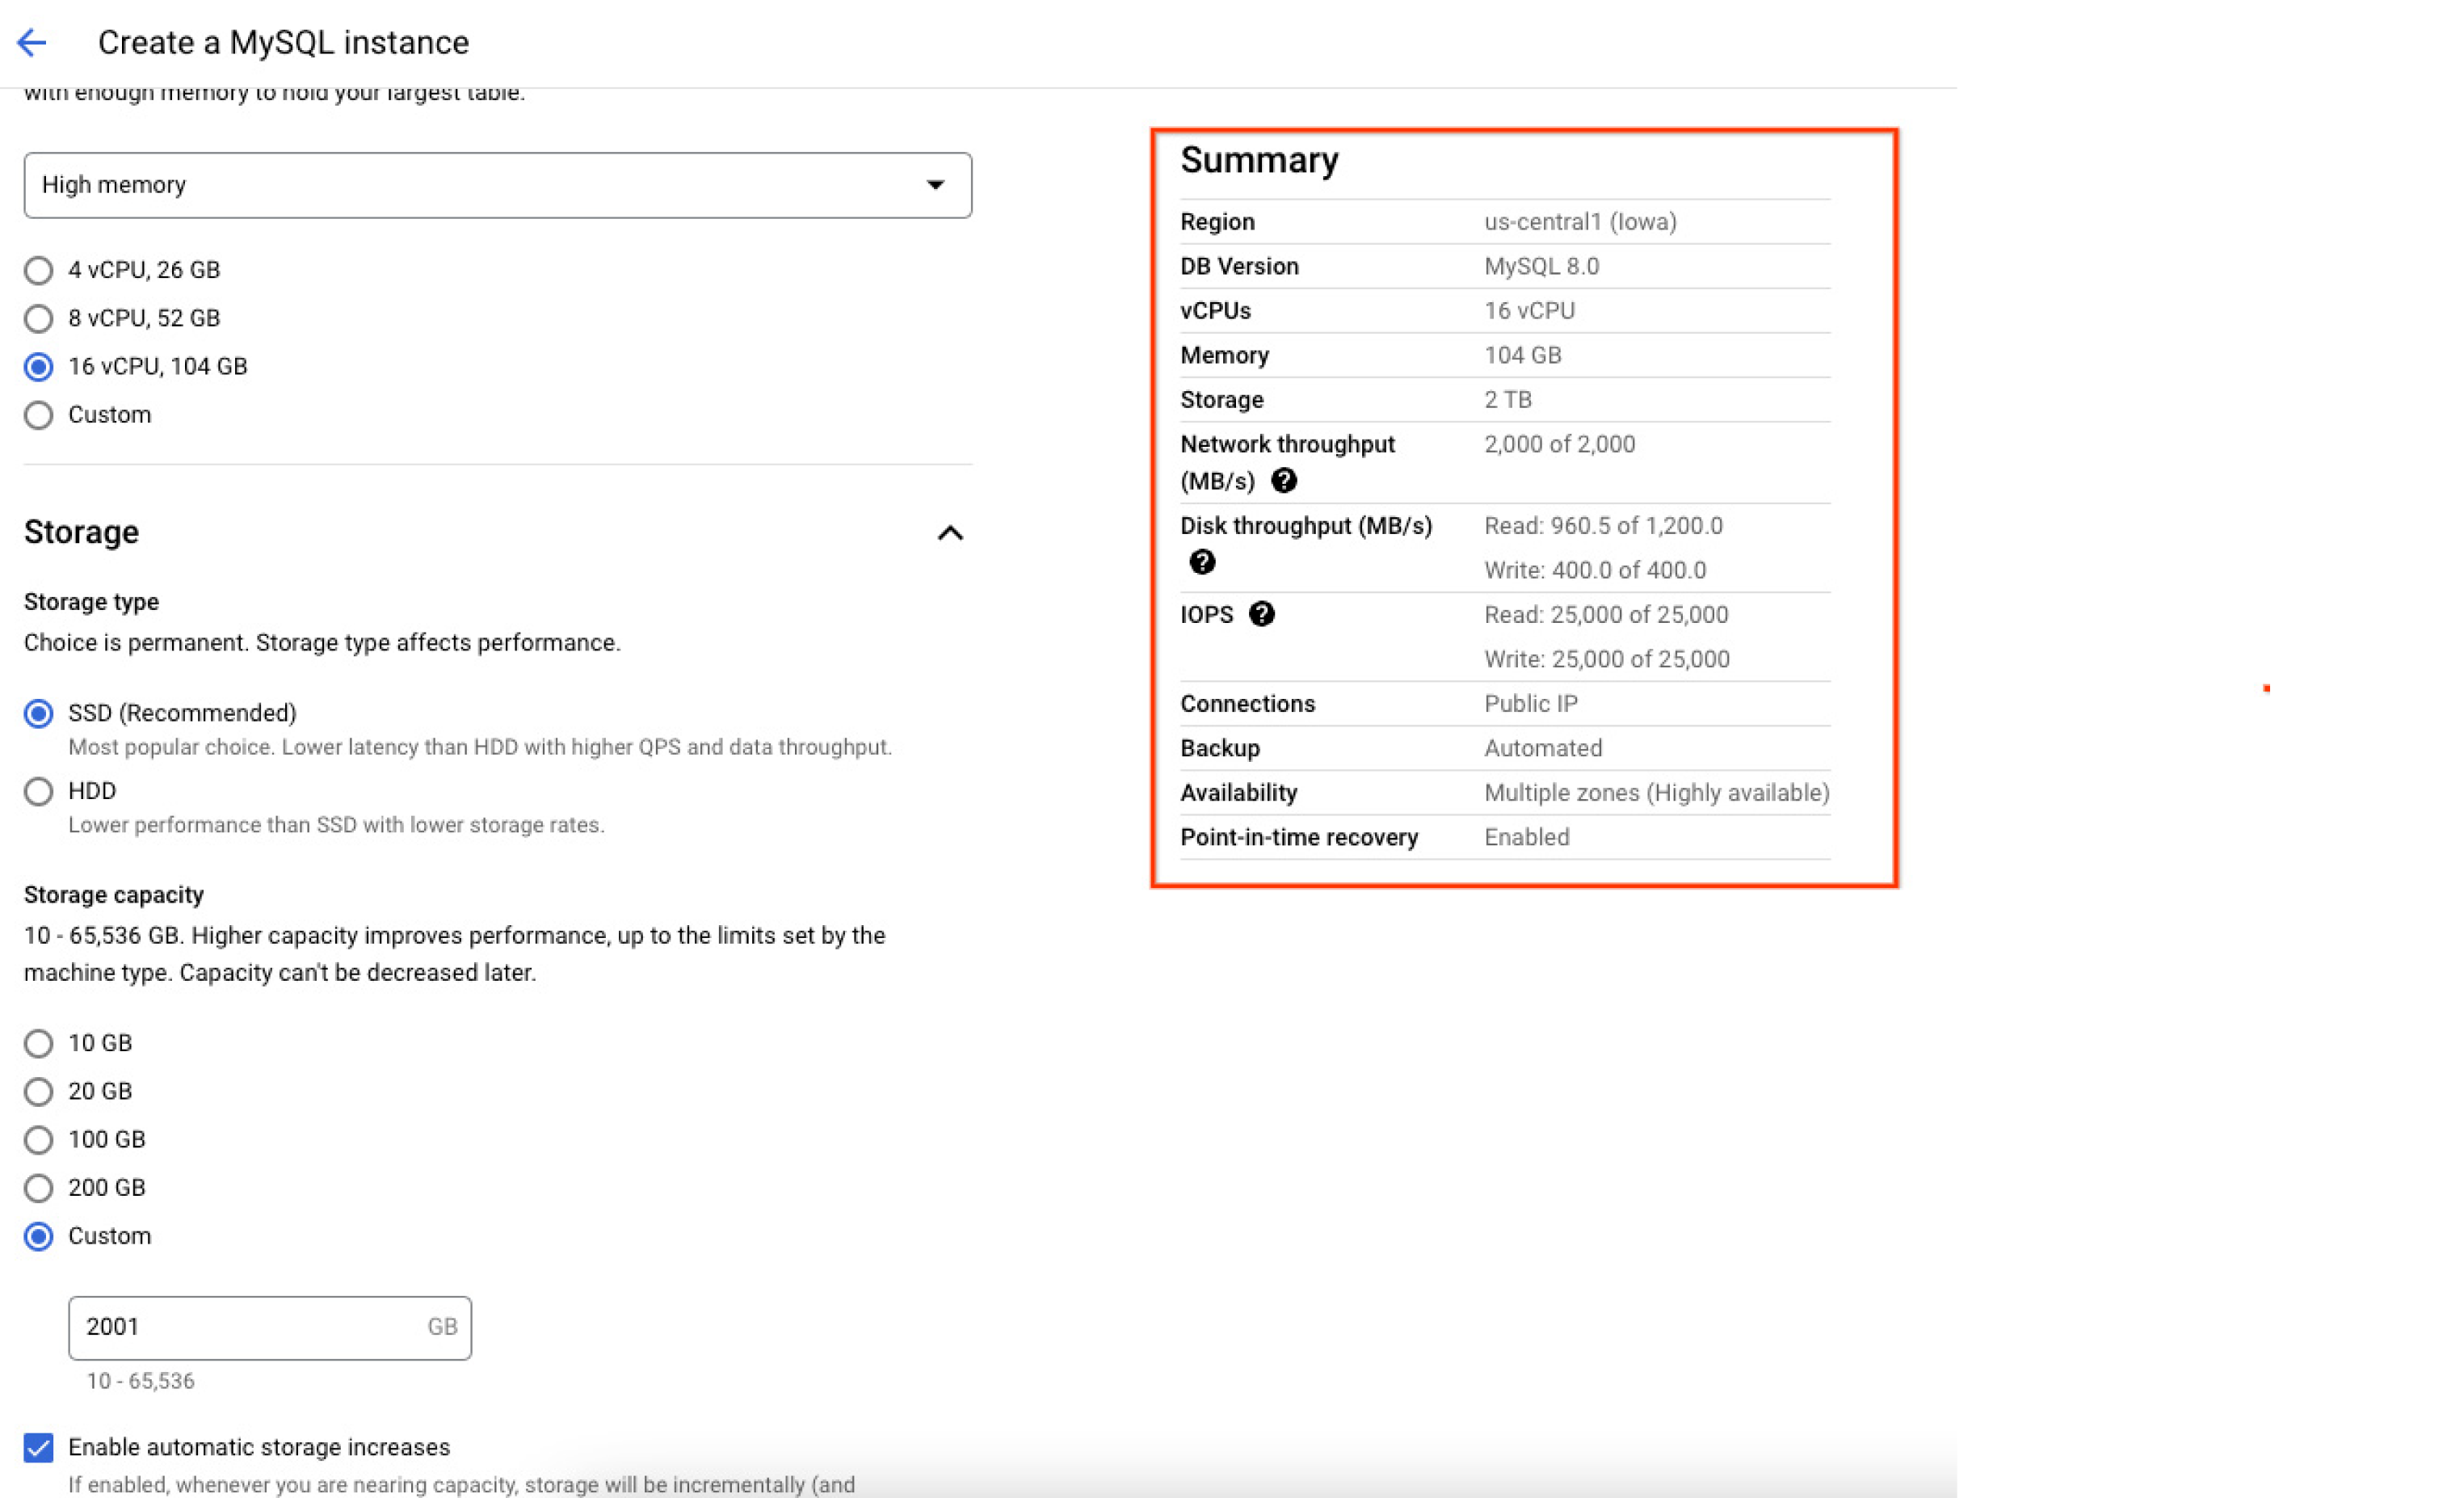
Read & write input/output operations per second (IOPs) allocated to the instance depends on the amount of storage allocated while creating the instance. Higher the disk size, greater the read and write IOPs. Hence it is advisable to create instances with higher data size for better IOPs performance. The following screenshot of Google Cloud console shows the summary of the resources (including the max capacity) allocated to the database instance at the time of creation, helping users confirm and understand exactly how their database will be configured once they instantiate it.
Region
One of the ways to reduce network latency is to choose the Instance region closest to the application or service. Cloud SQL for MySQL is available in all Google Cloud regions making it easier for users to instantiate a database as close as possible to the end users.
Elastic scaling
Cloud SQL offers an easy way to scale up or scale down the resources (CPU, memory, or storage) assigned to a database instance. This can be useful for workloads with varying resource requirements. For example, users can increase (scale up) the resources during the period of increased workload requirement and then scale down the resources when the peak workload situation is over.
MySQL configurations
This section contains best practices for MySQL database configurations to improve performance.
Version
Choose the latest version of MySQL when creating a new database. The latest versions have bug fixes and optimizations for better performance compared to older versions. Cloud SQL provides the latest version of MySQL available in the market and makes it the default version when creating a new database. More details on MySQL versions supported on Cloud SQL.
InnoDB Buffer pool size
For MySQL instances, InnoDB is the only storage engine supported. Innodb buffer pool size is the first parameter which a user would want to define for optimal performance. Buffer pool is the memory area which is allocated to store table caches, index caches, modified data before flushing and other internal structures like Adaptive Hash Index (AHI).
Cloud SQL defines the default value of around (~72%) of Instance memory to be allocated for the InnoDB buffer pool, based on the instance size (default values vary with instance sizes). More details on buffer pool settings on different instances sizes. Cloud SQL provides the flexibility to modify the buffer pool size according to your applications needs using database flags.
Buffer pool should be sized such that sufficient free memory is available on the instance for session buffer, dictionary cache, performance_schema tables (if enabled) apart from the InnoDB buffer pool.
Users can check the disk reads happening from the instance to identify how much data is being read from disks vs reads satisfied from the buffer pool. If there are more disk reads, then increasing the buffer pool size and instance memory would improve performance of read queries.
Redo log/InnoDB log file size
InnoDB log file or redo log records the data changes to the table data. InnoDB log file size defines the size of the single redo log file.
For write heavy workloads having a higher redo log size gives more room for writes without having to do frequent checkpoint flush activity and saving disk I/O, thereby improving write performance. The total size of the redo log, which can be calculated as (innodb_log_file_size * innodb_log_files_in_group) should be enough to accommodate at least 1-2 hours of write data during busy periods of database access.
Cloud SQL defines a default value of 512 MB. Cloud SQL also provides the flexibility to increase the InnoDB log file size using database flags.
NOTE: Increasing the value of the InnoDB log file size increases crash recovery time.
Durability
Flag innodb_flush_log_at_trx_commit controls how often the log data is flushed to the disk and whether to flush for every transaction commit or not.
Write performance on read replicas can be increased by changing the values of innodb_flush_log_at_trx_commit to either 0 or 2.
Cloud SQL does not support changing the durability setting on the Cloud SQL Primary. However, Cloud SQL does allow changing of the flag on read replicas. Reducing the durability on read replicas improves the write performance on the replicas. This helps in addressing replication lag on the replicas. Learn more about innodb_flush_log_at_trx_commit.
InnoDB log buffer size
InnoDB log buffer size is the amount of the buffer that InnoDB uses to write in the log file (Redo log).
If the transactions (inserts, updates, or deletes) in the database are large and the buffer used is more than 16 MB, then the InnoDB needs to do disk IO before committing the transaction, which affects the performance. To avoid Disk IO, increase the value of innodb_log_buffer_size.
Cloud SQL defines a default value of 16 MB for InnoDB log buffer size. MySQL status variable innodb_log_waits shows the number of times the innodb_log_buffer_size was small and that the InnoDB had to wait for the flush to happen before committing the transaction. If the value for innodb_log_waits is greater than 0 and is increasing, then increase the value of innodb_log_buffer_size using database flags for better performance. The value of the innodb_log_buffer_size and innodb_log_waits can be identified by running the following queries in the MySQL shell (CLI). These queries show the value of status variables and global variables in MySQL.
SHOW GLOBAL VARIABLES LIKE 'innodb_log_buffer_size';
SHOW GLOBAL STATUS LIKE 'innodb_log_waits';
InnoDB IO capacity
InnoDB IO capacity defines the number of IOPs available for background tasks (like page flush from buffer pool and merging data from change buffer).
Cloud SQL defines the default value of 5,000 for innodb_io_capacity and 10,000 for innodb_io_capacity_max.
This default works best for most of the workloads but if your workload is write-heavy or unapplied changes on the instance are high and if you have enough IOPs available on the instance then consider increasing the innodb_io_capacity and innodb_io_capacity_max. The value of the applied changes can be found using the following query in MySQL shell:
mysql -e 'show engine InnoDB status \G;' | grep Ibuf
Session buffers
Session buffers are the memory allocated for individual sessions. If your application or queries include lots of inserts, updates, sorts, joins and need higher buffers then defining high buffer values while running the query in a particular session avoids performance overhead. Users can prevent excessive buffer allocation at global levels which increases values for all connections and which, in turn, increases total memory usage of the instance. Changing the default value for the following buffers help in improving query performance. These values can be changed using database flags.
Note that these are per session buffer values, increasing the limits may affect all the connections and eventually might lead to increase in overall memory usage.
Table_open_cache & Table_definition_cache
If you have too many (in excess of thousands) tables in the database instance (in single or multiple databases), increase the values of the table_open_cache and table_definition_cache to improve the speed of opening the tables.
Table_definition_cache speeds up opening of tables and has only one entry per table. The table definition cache takes less space and does not use file descriptors. If the number of table instances in the dictionary object cache exceeds the table_definition_cache limit, an LRU mechanism begins marking table instances for eviction and eventually removes them from the dictionary object cache to make room for the new table definition. This process is performed each time a new tablespace is opened. Only inactive tablespaces are closed. This eviction process would slow down the opening of tables.
Table_open_cache defines the number of open tables for all threads. You can check whether you need to increase the table cache by checking the Opened_tables status variable. If the value of Opened_tables is large and you do not use FLUSH TABLES often, then consider increasing the value of the table_open_cache variable.
Table_open_cache and table_definition_cache can be set to the actual number of tables in the instance. Learn more about Cloud SQL high-number-of-open-tables recommender.
Note: Cloud SQL provides flexibility to change these values.
Schema recommendations
Always define primary keys
Defining primary keys to the table physically organizes the data such that it facilitates faster lookup, retrieval, and sorting of the records and hence improves performance.
Preferably integer-valued automatically-incremented primary keys are ideal for OLTP systems.
Absence of primary keys is also one of the major reasons for replication delay or replication lag in row-based replication scenarios.
Create indexes
Creating indexes helps in faster retrieval of data and hence improves the performance of the read queries. Create indexes for the columns used in WHERE, ORDER BY, and GROUP BY clauses of the queries.
NOTE: Too many or unused indexes may also hamper the performance of the database.
Best practices for performance optimization
Run benchmarks
Run performance tests or benchmarks to see if the configuration is optimal or it can be further improved by adjusting configurations for hardware, MySQL database, or schema design. Change one parameter at a time and review against benchmarked results to see if there is an improvement.
Connection pooling
Connection pooling is a technique of creating and managing a pool of connections that are ready for use by any process that needs them. Connection pooling can greatly increase the performance of your application, while reducing overall resource usage. Review details on how to manage connections from the application, including connection count and timeout.
Distribute read workload to read replicas
Read replicas (multiple, across the zone) can be used to offload the read workload from the primary instance. This reduces the overhead or load on the primary instance and in turn improves the performance of the primary instance. Also more resources are available for read queries on the read replica.
ProxySQL, an open-source, high-performance MySQL proxy capable of routing database queries, can be used to horizontally scale the Cloud SQL for MySQL database.
Avoid long running queries
Queries running for several minutes or hours are known to cause performance degradation.
- Undo logs are used to store the old version of the changed rows to rollback the transaction and also to provide the consistent read (snapshot of data) in a transaction. These undo logs are stored in the form of linked lists with recent versions pointing to older ones, which further point to older ones and so on. Long running transactions tend to delay the purging of the undo logs and hence increase the list of undo logs. InnoDB has to traverse the high volume of undo logs and lengthy linked list which reduces the performance.
- Long running queries also consume resources (like memory, buffers, locks), which are not freed for a long time and affect the other queries because of the lack of resources.
Avoid big transactions
Too many record changes (update, delete, insert) in a single transaction will hold resources (locks, buffer) for too many records. It may overflow the logs buffers resulting in Disk IOs. Remaining queries will have to wait for the resources or the locks to be released. This results in bringing too much data into the buffer pool, preventing further use of the buffer pool. Rollback of such large transactions also degrades the performance of the database. To overcome this, the recommendation is to split big transactions into small and faster running transactions.
Optimize queries
Always optimize the queries for the best results, that is, less resource and faster execution. Review recommendations for MySQL query tuning.
Tools for performance tuning
Monitoring
Monitoring
Cloud SQL offers predefined dashboards for several Google Cloud products, including a default Cloud SQL monitoring dashboard. Users can use this dashboard to monitor the general health of their primary and replica instances. Users can also create their own custom Dashboards to display metrics of interest to them. Using these dashboards & metrics various performance bottlenecks like high CPU or high memory usage can be identified and addressed using earlier listed recommendations. Alerts can also be configured based on these metrics.
Slow query flag
Slow query flag
Slow queries flag can be enabled on the Cloud SQL for MySQL instance to identify queries taking longer than the long_query_time for execution. These slow queries can be further analyzed and tuned to improve performance. Learn how to enable and check the slow queries for Cloud SQL instances.
Performance schema
Performance schema
Performance schema provides low level monitoring of the MySQL instance. Performance schema can be enabled on a Cloud SQL for MySQL instance with memory > 15 Gb. Sys schema reports provide various reports to identify the bottlenecks, waits, missing indexes, memory usage etc.
Query Insights
Query Insights
Query Insights is native feature of Cloud SQL where queries can be profiled and analyzed to improve the performance of a query. Query insights support intuitive monitoring and provide diagnostic information that help you go beyond detection to identify the root cause of performance problems.
Performance recommendations
Performance recommendations
The Cloud SQL high-number-of-tables recommender is also a native feature of Cloud SQL which provides performance recommendations to Cloud SQL users to improve performance of the existing databases, provide suggestions for defining the configuration to improve the performance and reduce cost of the instances. Please see Cloud SQL recommendations for more details.
Related products and services
Google Cloud offers a managed MySQL database built to suit your business needs, from retiring your on-premises data center, to running SaaS applications, to migrating core business systems.
Take the next step
Start building on Google Cloud with $300 in free credits and 20+ always free products.
Need help getting started?
Contact salesWork with a trusted partner
Find a partnerContinue browsing
See all products