Getting more out of MySQL performance: query tuning
Databases play a critical role in any application's performance. MySQL database is no exception. It is therefore important to understand the many ways that database tuning, design, and configuration can help improve your application’s performance. Below are some ways that MySQL can be optimized to achieve optimal performance.
Related Articles
Overview
Query tuning
Database performance tuning starts from the application. How the application translates the business requirements to database queries makes a big difference on the complexity and efficiency of the application. The real measure of performance is how efficiently each database instance contributes to the business needs.
Schema design
How entities and relationships are defined in a relational database determines how straightforward or complex a response will be to a database query. Also, how the primary key and secondary indexes are defined plays an important role.
Server configuration
Server configuration is responsible for optimizing and maximizing the utilization of system resources. The system resources are the core processing unit (CPU) cores, memory on the physical machine or virtual machine (VM), the underlying storage system, and the network.
Dynamic server tuning
Continuous monitoring, optimizing, and performance tuning to adapt database workloads for real world dynamics.
This article focuses on query tuning. The rest of the topics would be covered in subsequent articles.
We often start the query tuning process by looking at the database query. A better way would be to start with evaluating how efficiently has the business requirement been translated into a database query. The interpretation and processing of a business need to a query determines how small or large the cost would be.
Design queries
The first step is to prioritize queries to be optimized:
- Identify database questions that need the best response time
- Identify database questions that run frequently
These two categories need to be optimized during the database schema design.
Keep transactions short
A transaction is a logical unit where all contained statements would either commit fully or roll back. Transaction is the feature that provides atomicity, consistency, isolation and durability (ACID) for MySQL.
In InnoDB, the storage engine for MySQL, all user activities occur inside a transaction. By default, autocommit mode is enabled, which means that each SQL statement forms a single transaction on its own. To perform a multiple-statement transaction when autocommit is enabled, start the transaction explicitly with START_TRANSACTION or BEGIN and end it with COMMIT or ROLLBACK. If autocommit mode is disabled, the session always has a transaction open until a COMMIT or ROLLBACK ends it and starts a new one.
The best practice with transactions is to keep them as short as possible. This is because long transactions have several downsides as outlined further in this article.
Downsides of long transactions
1. Prolonged lock contentions, which cause slower queries and potential query failures
- InnoDB row level locking is held for the duration of the transaction
- It potentially increases lock waits, lock timeouts, and deadlocks which either make query slower or fail completely
2. Degraded server performance due to large amount of undo logs
- Due to InnoDB Multi-version Concurrency Control (MVCC), old versions of changed rows are stored in undo logs for consistent read and rollback. With the default repeatable-read isolation level, the undo logs would not be purged until transactions started prior to it complete. Hence a long running transaction accumulates undo logs. This could be observed and monitored via the history list in SHOW ENGINE INNODB STATUS command line function.
- When the history list gets over millions, server performance would be adversely impacted due to the mutex contention on rollback segments, the increased volume to read the undo logs, and increased time to traverse the linked list of undo logs. It also creates more work for purge threads.
3. Increased disk usage
- Increase in undo logs that are stored on disk, either in system tablespace or undo tablespace
4. Prolonged shutdown time
- During normal shutdown, ongoing transactions would be rolled back. The rollback time is often longer than the time taken to get to the point. Hence, the server shutdown could take a long while for the rollback.
5. Prolonged crash recovery time
- During crash recovery, InnoDB repeats the transactions from the last checkpoint and unrolls non-committed transactions. A long transaction would make the corresponding step take longer.
Consideration for single-query transactions
- SELECT queries
- They do not hold row locks
- They could cause undo logs to accumulate
- See the query optimization section below
- UPDATE/INSERT/DELETE queries
- Batch query performs better than many single row changes
- Break up and limit batch execution time to a couple of seconds
Consideration for multi-statement transactions
- Consider separating out SELECT queries
- If there is application logic in between the database queries, consider splitting the transaction
- Estimate how many row locks would be held for each statement
- Evaluate execution order to minimize row locking
- Look for opportunities to reduce the transaction size
Capture queries
Queries could be captured either on the application side or the database side.
Application side
It is good development practice to log database queries and query execution time. Application side logging makes it easy to evaluate the effectiveness and efficiency of the queries in their business context. For example, users may log every query’s response time or log response time for certain functionalities. This is also an easy way to get total execution time for multi-statement transactions.
In addition, the query response time measured from application side logging is an end to end measurement, including network time. It complements query execution time logged from the database and makes it easy to identify whether the issue is with the network issue or the database.
Database side
Cloud SQL MySQL Query insights
The Cloud SQL Query insights tool enables query capturing, monitoring, and diagnosis.
Query insights makes it easy to find the top queries based on execution time and execution frequency.
The tool has filtering options such as time range, database, user account, and client address. It has graphs to show the CPU usage, and breakdown on IO and lock waits. The “Top queries and tags” table lists the top queries by execution time with the queries being normalized. Besides the execution time, it includes stats on “avg rows scanned” and “avg rows returned” which give insights to query efficiency.
Please refer to the documentation to see all that it offers and how to enable it.
Use performance_schema
On Cloud SQL for MySQL, performance_schema feature is enabled by default for MySQL 8.0.26 and higher versions with 15GB+ memory. Enabling or disabling it requires instance restart.
When performance_schema=ON, the query statement instruments are enabled by default. The sys.statement_analysis table gives aggregated statistics for normalized queries. It answers questions such as:
- Which queries do full table scan?
- full_scan/exec_count: to find whether queries frequently do full table scan which is often inefficient
- Which queries run slow?
- avg_latency: average query execution time
- Which queries are inefficient?
- rows_examined_avg/rows_sent_avg: this is for read queries. The ideal ratio is 1. The larger the ratio, the more inefficient the query is.
- rows_examined_avg/rows_affected_avg: this is for write queries. The ideal ratio is 1. The larger the ratio, the more inefficient the query is.
- Which queries use temporary tables and have to convert to on-disk temp tables?
- tmp_disk_tables/tmp_tables: to see if the tmp_table_size/max_heap_table_size is sufficient
- Which queries use filesort?
- rows_sorted/exec_count, sort_merge_passes/exec_count: to identify queries with large amounts of sorting and may use a bigger sort_buffer_size
If you use MySQL Workbench, it has performance schema reports based on sys view. The report has a section on “High Cost SQL Statements,” which provides insights on query performance.
Use slow log + tooling
The slow log captures all the queries running longer than the long_query_time. It also logs query execution time, lock time, data rows examined and data rows sent. The additional execution statistics makes it a preferred candidate to analyze the database queries than using the general log.
It is a good practice to have slow log enabled. Normally, the long_query_time should be kept at a reasonable threshold to capture queries that you intend to look at and optimize.
log_output=FILE
slow_query_log=ON
long_query_time=2
Once in a while, it is a good idea to set long_query_time=0 to capture all queries for a brief time and get an overview of query volume and performance.
There are tools, such as mysqldumpslow and pt-query-digest, which would extract query signatures and generate a report to show query statistics.
There are other third-party monitoring tools that generate reports on query statistics, such as Percona Monitoring and Management, SolarWinds Database Performance Monitor (previously VividCortex), and more.
Optimize queries
After capturing the queries in transactions, the next step is to optimize them.
EXPLAIN - what to look for
The EXPLAIN command provides the query execution plan and from 8.0.18, the EXPLAIN ANALYZE command would run a statement and produce EXPLAIN output along with timing from the execution.
The MySQL Query insight provides handy access to the EXPLAIN plan.
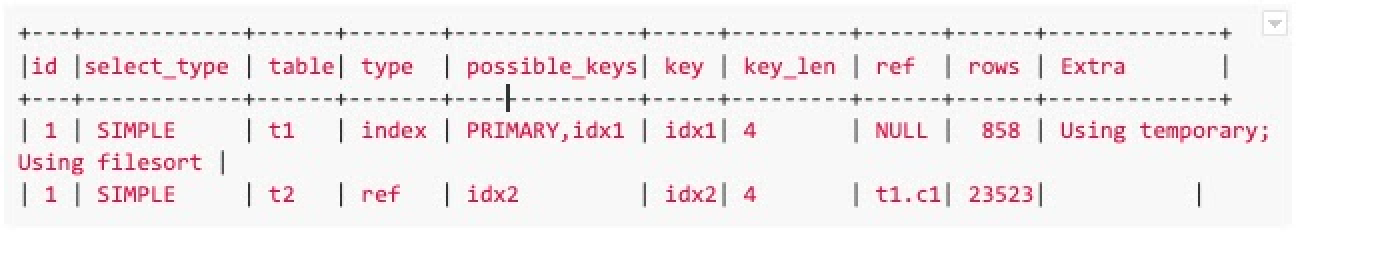
What do we look for in the output?
- The `rows` field shows the amount of rows to be read
- IO is the most time-consuming part. If a query needs to read a large amount of data, it is likely to be slow. To get a rough idea of that, multiply the `rows` among the joined tables. In the above example, that is 858 * 23523. To read 23523 rows from t2 for each and every of the 858 rows from t1 sounds suboptimal. Given this, the optimization would be to reduce the amount of data access from t2 for each iteration.
- The `type` field describes the table join type
- Type ‘index’ means the index is scanned. If the index satisfies all data required from the table, the Extra field would show “Uses index.”
- Type ‘range’ means that not only an index is used, but also that a range condition is provided to limit the data scan.
- For subsequent tables in join order, the type ‘eq_ref’ means one row is read from this table for each combination of rows from the previous tables, which is the most efficient.
- Type ‘ref’ means the index matching is 1:m instead of 1:1. More than one row will be read from this table for each combination of rows from the previous tables.
- The type to avoid is “ALL.” It means that a full table scan is done for each combination of rows from the previous tables.
- The `key` field shows the actual index being used.
- The selection of which index to use is based on the index cardinality which may be out of date. Hence, it is important to verify that the most selective index is used.
- The `key_len` field indicates the key length in bytes.
- With a multi-column index, the key_len suggests the part of the index that is used. For example, if an index has (col1, col2, col3), and the query condition is “col1 = n and col2 like ‘%string%’”, then only col1 would be used for index filtering. If the query could be changed to “col1 = n and col2 like ‘string%’”, then both (col1, col2) would be used for index filtering. This small change could make a dramatic difference in query performance.
- The `Extra` field contains additional information about the query plan
- “Using temporary” means an internal temporary table is created which may generate an on-disk temporary table
- “Using filesort” means the sorting couldn’t leverage any index and requires a sort buffer, and potentially temporary disk files
- “Uses index” means all data required from this table is contained in the index; no need to read data rows
Query profiling
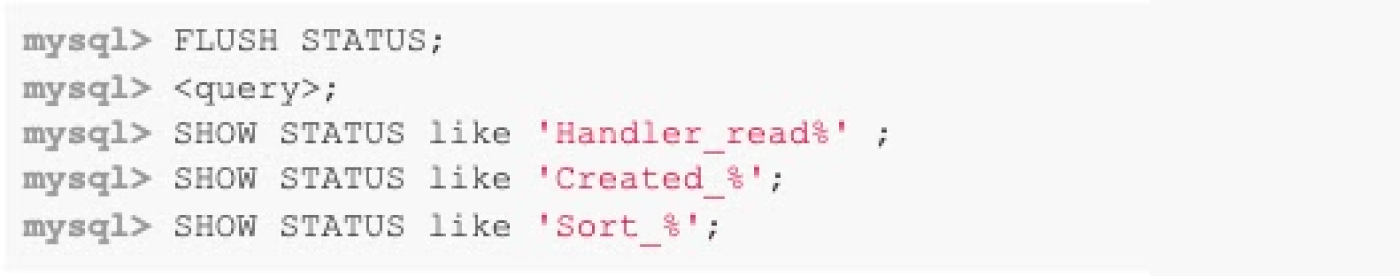
Session status variables could be used to obtain query execution details.
First, clear the session variables, then run the query and examine the counters. For example, the Handler_* status shows the data access pattern and row amount. The Created_* would show if a temporary table and/or on-disk temporary table is created. The Sort_* would show the number of sort merge passes and the number of rows sorted. More session variables are explained in the documentation.
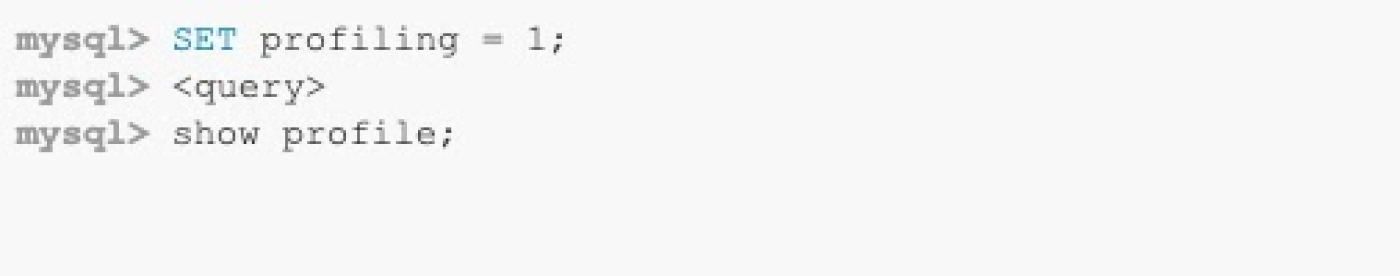
The SHOW PROFILE statement provides query execution time by execution stage which could be helpful information as well.
Optimize query execution plan
Once the query execution plan is understood, there are multiple ways to influence and optimize it.
- Add or update index definition
- For better filtering, less data access
- For sorting, avoid filesort
- Update index statistics if that is off
- ANALYZE TABLE <tbl>;
- Then recheck EXPLAIN plan output
- Use Index Hint
- To suggest or force a certain index to be used for filtering, join or order by / group by
- Use STRAIGHT_JOIN to define table join order
- Use Optimizer Hints
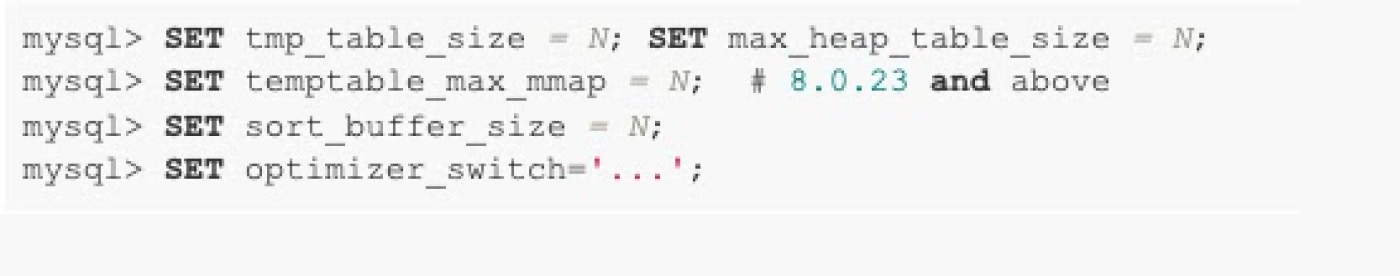
Optimize execution for the session
To optimize the server configuration for certain queries, it is highly recommended to use the session level variables instead of changing the global value that affects all sessions.
The frequently used session values are:
Summary
In summary, for query tuning, we talked about three aspects:
- Make conscious decisions when composing the queries. These decisions are the driving factor for query performance, overall server throughput, and server performance.
- Track the query execution data both on the application side and database side. The application side logging is important. It could be configured based on the business interests and reflect business operations.
- Lastly, there are several tools that help in understanding the query execution plan, the costs associated with different steps, and ways to optimize the queries.
Related products and services
Google Cloud offers a managed MySQL database built to suit your business needs, from retiring your on-premises data center, to running SaaS applications, to migrating core business systems.
Take the next step
Start building on Google Cloud with $300 in free credits and 20+ always free products.
Need help getting started?
Contact salesWork with a trusted partner
Find a partnerContinue browsing
See all products