This page explains six key steps that can help you to quickly get started using Looker Studio.
 Start with a report
Reports let you visualize your data, gain insights, and share those insights with others.
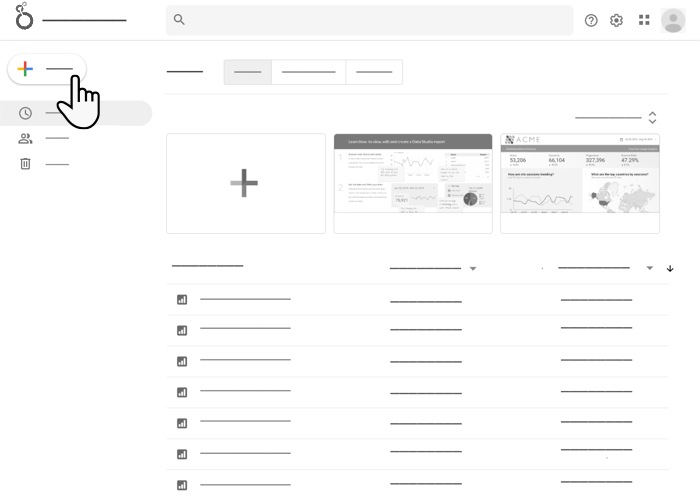
When you sign in to Looker Studio, the home page appears with the Reports tab selected. All the reports that you have access to appear in the middle of the screen. The plus buttons let you create a new blank report, or you can start with one of the pre-built report templates along the top.
View a report
To view a report that's been shared with you, click the report name in the list in the middle of the screen.
Edit a report
To edit a report, follow these steps:
- View a report.
- In the upper right corner, click
 Edit.
Edit.
If you don't see an Edit button, then the report has been shared with only Can view access. If the owner of the report has allowed it, you can make a copy, which you can then edit.
Create a report
To create a report, follow these steps:
- In the top left, click
 Create.
 - Select Report.
The report editor opens with the Add data to report panel open.
 Add data to the report
Data sources connect to your data and let you configure the fields that you can use in your report.
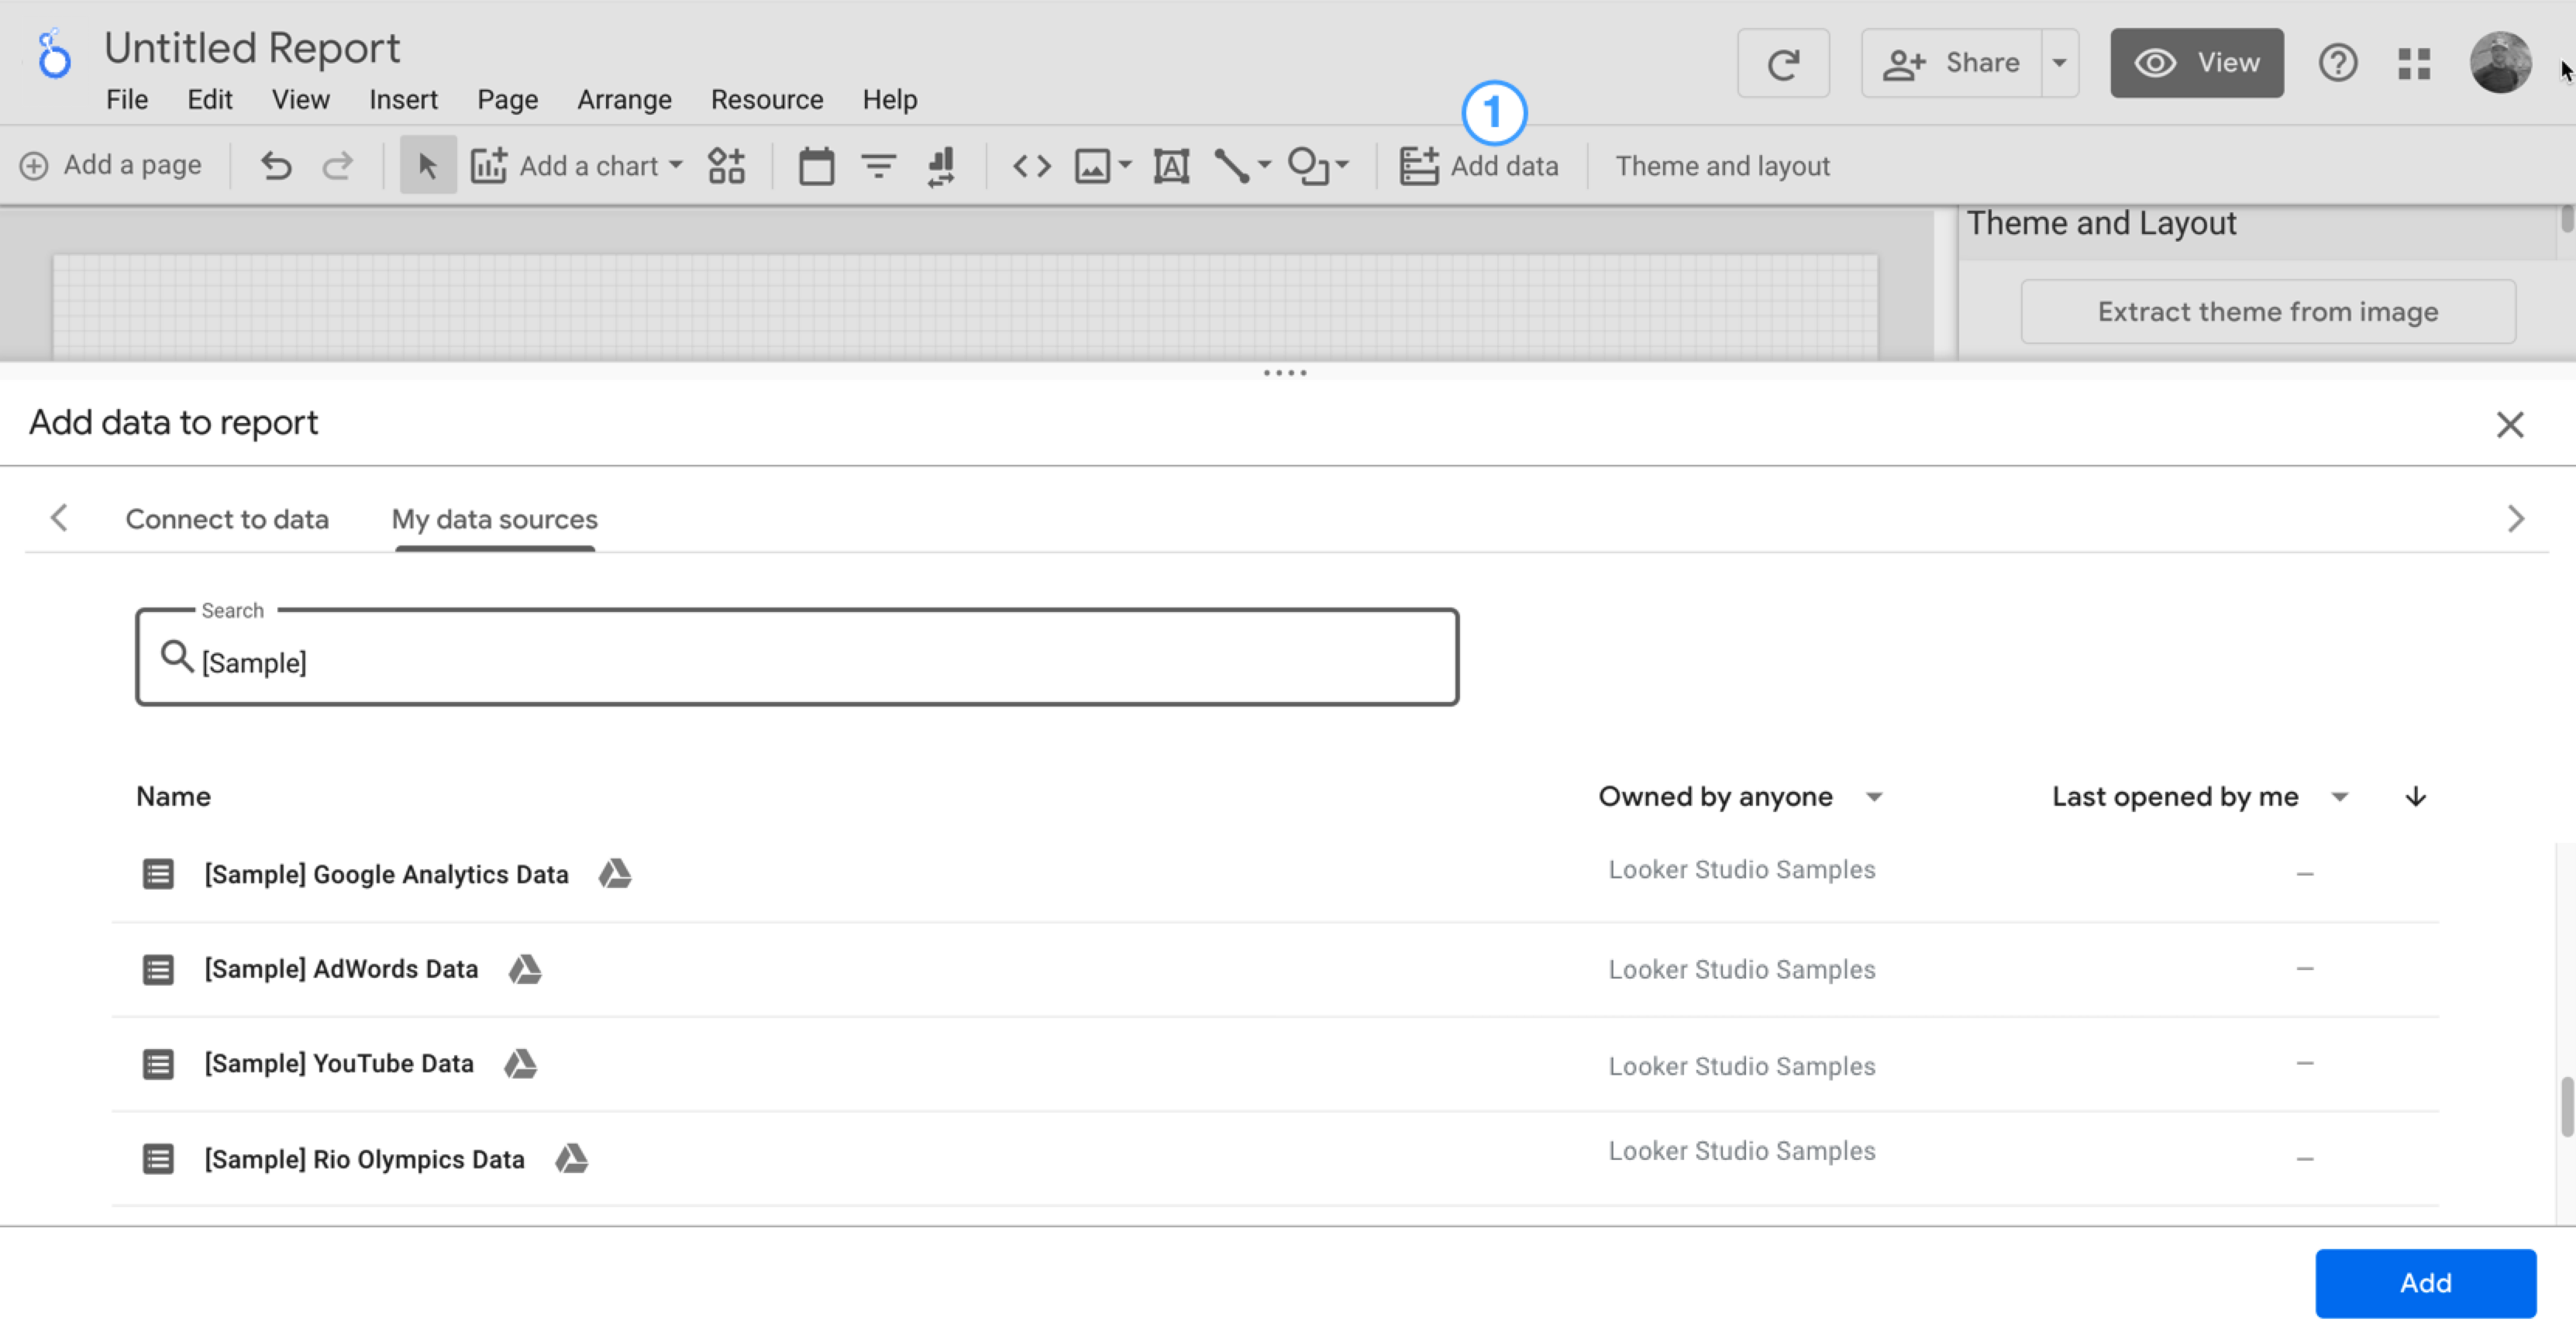
When you create a new report, the Add data to report panel opens. This panel lets you create a new data source or add an existing data source.
Create a new data source
For example, you might want to connect to a BigQuery public dataset (to complete this step, you'll need a Google Cloud project that is associated with a valid Google Cloud billing account).
To create a new BigQuery data source, follow these steps:
- In the Add data to report panel, click Connect to data.
- Select the BigQuery connector.
- If prompted, click Authorize to allow Looker Studio to access your data on your behalf.
- Select Public datasets.
- Select your Billing project.
- Select the faa public dataset.
- Select the us_airports table.
- In the lower right corner of the screen, click Add, and then confirm that you want to add the new data source to your report.
- The report editor appears, and a table with fields from your data source is placed on the canvas.
- To customize the table's data and style, on the right side of the screen, use the properties panel.
- To rename your report, in the top left corner of the screen, click Untitled report and enter a new name.
Connect to an existing data source
For example, you might want to connect to the sample Google Analytics data source that comes with Looker Studio.
To connect to an existing Google Analytics dataset, follow these steps:
- In the Add data to report panel, click My data sources.
- Select the Sample Google Analytics Data data source.
- In the lower right corner of the screen, click Add, and then confirm that you want to add the new data source to your report.
- The report editor appears, and a table with fields from your data source is placed on the canvas.
- To customize the table's data and style, on the right side of the screen, use the properties panel.
- To rename your report, in the top left corner of the screen, click Untitled report and enter a new name.
 Add charts and controls to the report
To add components to a report canvas, follow these steps:
- In the toolbar at the top of the editor, click Add a chart, and then select a chart from the list.
- Click the canvas where you want the chart to appear.
- Move and resize the chart, as desired.
- Add or change the dimensions and metrics by clicking the fields in the properties panel or by dragging and dropping them from the data panel (to the right of the chart panel) directly onto the chart.
- You can also create new charts by dragging a field from the data panel onto the canvas.
 View your report
See your report the way it looks to other viewers.
View mode lets users see the data and use any interactive controls that you've placed on the report without being able to change the structure of the report. If you can edit a report, you can switch between view mode and edit mode.
To enter view mode from edit mode, click ![]() View.
View.
To return to edit mode from view mode, click ![]() Edit.
Edit.
 Share the report
Share reports with other viewers. Collaborate with other editors.
To share a report with users, follow these steps:
- In the upper right, click
 Share.
 - Specify the people or groups with whom you want to share your report.
- Use the advanced options to change how individual addresses can access the report.
 Share the data source
Let other people create their own reports that are based on your data source.
To share a data source, you must access it directly from the Data Sources page (not through the report). You must be signed into a Google Account to view or edit a data source.
To share a data source, follow these steps:
- In the upper left of your report, return to the Looker Studio home page by clicking the
 Looker Studio logo.
 - On the left, click Data Sources.
- Locate the data source that you want to share.
- On the right, click
 More options.
 - Click Share.
- Specify the people or groups with whom you want to share your data source.
- Use the advanced options to change how individual addressees can access the data source.
Key concepts
Here's a recap of the terms and concepts that are used on this page and throughout the Looker Studio documentation.
| Concept | What it does |
|---|---|
| Report | A Looker Studio asset that contains a collection of p whose purpose is to present to viewers information and insights that are derived from your data. Learn more about reports. |
| Component | A widget that you add to a report to display your data, such as charts, tables, and interactive date range controls and filter controls. Data components get their information from a data source. You can also annotate your report with text, shape, image, and embedded content components. |
| Connector / Data source |
In Looker Studio, connecting to your data involves the following components:
Learn more about connecting to your data. |
| Field | A column of data. Looker Studio uses two basic types of fields:
Learn more about fields in reports. |
| Credentials | The mechanism by which a data source determines who can see the data it provides. Learn more about data source credentials. |
| View mode / Edit mode |
|
| Sharing and access permissions | When you share reports and data sources, you determine how other people can access the asset:
The advanced sharing options let you control other aspects of asset access, such as the ability to download the data or print the report. The link sharing options let you share your assets more broadly around the internet. Learn more about sharing. |