This page shows you how to observe your traffic using GKE Dataplane V2 observability. For more information on the benefits and requirements of GKE Dataplane V2 observability, see About GKE Dataplane V2 observability. For information on configuration, see Set up GKE Dataplane V2 observability.
How to use GKE Dataplane V2 observability
Start by enabling GKE Dataplane V2 metrics with Google Cloud Managed Service for Prometheus. To create custom dashboards and set alerts similar to any of the metrics that you've been monitoring, you can use Google Cloud Observability tools such as Cloud Monitoring Metrics Explorer.
You can also configure any third-party dashboard or tooling that uses Prometheus, including Grafana. With your GKE cluster enabled with GKE Dataplane V2 observability, you can inspect traffic with GKE Dataplane V2 observability tools.
Visualize metrics and Service dependencies
You can visualize Kubernetes traffic metrics and Service Dependencies as follows:
View cluster and workload observability metrics
To view GKE Dataplane V2 metrics for your clusters, perform the following steps in the Google Cloud console in the Metrics Explorer:
Go to the Monitoring Metrics Explorer page.
Select the Metric under the Query as either the Prometheus Target prometheus/pod_flow_egress_flows_count or prometheus/pod_flow_ingress_flows_count/counter.
(Optional) Choose any selected filters based on Labels.
(Optional) Save the chart to a custom Dashboard.
Visualize Service dependencies
Use the Hubble UI to be able to determine the dependencies of the Pod and Services deployed on your cluster at a glance. Visualize the traffic flows including those reaching out to external destinations. Filter by namespaces, Kubernetes labels, and more.

Verify traffic flows
The Hubble UI can also be used to view live flows happening on your cluster. Each live flow shows the source and destination services, destination port, Policy verdicts and timestamps.
Inspect traffic with GKE Dataplane V2 observability tools
You can capture and analyze network traffic using GKE Dataplane V2 observability tools, accessed using a private endpoint. The endpoint is exposed on an internal IP address, which you can access from within the Kubernetes cluster and the VPC within which the cluster resides.
To inspect network traffic metadata, use the following commands:
Use the built-in hubble-cli plugin to inspect network traffic
alias hubble="kubectl exec -it deployment/hubble-relay -c hubble-cli -n gke-managed-dpv2-observability -- hubble"
hubble observe
This command inspects network traffic for the cluster.
Use the built-in hubble-cli plugin to inspect network traffic in follow mode
alias hubble="kubectl exec -it deployment/hubble-relay -c hubble-cli -n gke-managed-dpv2-observability -- hubble"
hubble observe -f
This command inspects network traffic metadata in following mode for the cluster:
Use the built-in hubble-cli plugin to inspect network traffic in single namespace
alias hubble="kubectl exec -it deployment/hubble-relay -c hubble-cli -n gke-managed-dpv2-observability -- hubble"
hubble observe -n default
This command uses the built-in hubble-cli plugin to inspect network traffic for the default namespace in the cluster.
To enable Hubble Relay use the --enable-dataplane-v2-flow-observability flag.
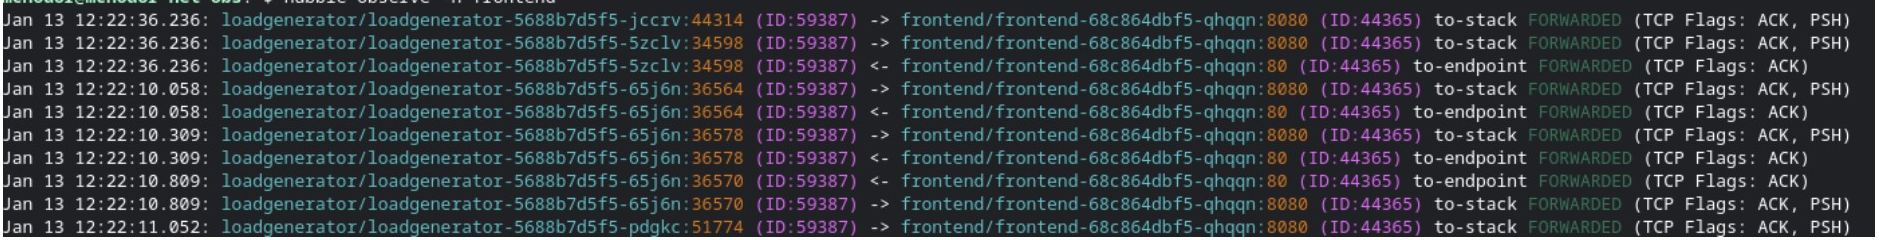
Analyze traffic flows
Use the Hubble CLI to observe live traffic flow dumps with the ability to filter with Kubernetes namespaces and more.