What is Prometheus?
Prometheus is an open source monitoring and alerting toolset that has grown in popularity alongside the growth of Kubernetes. Originally built at SoundCloud, Prometheus can trace its roots back to a monitoring project at Google called Borgmon.
Prometheus is the primary proponent of collecting metrics from your applications and infrastructure using a pull-based model. This means that Prometheus will periodically send a request to your targets, and the collected metrics are then stored in a time-series database. In self-managed Prometheus instances, you provide the infrastructure to collect, store, and query the metrics. In managed versions of Prometheus, a vendor provides all of the infrastructure and a Service Level Agreement (SLA) for uptime of the service.
Prometheus provides a query language called PromQL for querying your time-series data. There are many projects that leverage PromQL, including Grafana and Alertmanager, to help with analytical and operational tasks such as data visualization, creating alerts, and scaling your monitoring infrastructure.
What is Prometheus used for?
Prometheus is used to collect metrics from your applications and infrastructure. These metrics can be used to track the health of your systems, identify potential problems, and troubleshoot issues.
What are the benefits of Prometheus?
Here are some of the specific benefits of using Prometheus:
- Openness: Prometheus is open source, part of the Cloud Native Computing Foundation (CNCF), and free to use.
- Reliability: Prometheus is reliable and has a proven track record in production environments in some of the largest companies in the world.
- Community support: Prometheus has a large and active community that provides support, documentation, and improvements. It also has a number of integrations with other tools, which allow you to monitor your systems and infrastructure and visualize your data.
- Works great with Kubernetes: As the de-facto default monitoring solution for Kubernetes, most third-party applications are already instrumented for Prometheus metrics.
- Works everywhere: While most of the adoption has been on Kubernetes deployments, Prometheus can also be used for VMs and some serverless environments.
What are the components of Prometheus?
- Prometheus server: The central component of the Prometheus monitoring system. It stores time-series data and exposes an HTTP API for querying and alerting on that data.
- Prometheus exporters: Software agents that collect metrics from various systems and expose them to Prometheus.
- Alertmanager: A service that receives alerts from Prometheus and routes them to the appropriate people or systems.
- Prometheus federation: A feature that allows multiple Prometheus servers to share data.
- Prometheus Pushgateway: A component that allows services to push metrics to Prometheus without having to scrape them. This capability best serves short-lived jobs.
- Prometheus blackbox exporter: A service that can be used to monitor the availability of HTTP, TCP, and DNS endpoints.
How does Prometheus collect metrics?
Prometheus uses a pull model to collect metrics, which means that the Prometheus server polls the systems or applications that it is monitoring for metrics. This is in contrast to the push model, used by many other monitoring systems, where you modify application code to send metrics to the server periodically.
The pull model does not require the systems or applications that are being monitored to be aware of the Prometheus server, so it can be added to a monitoring system without making changes to application code. The pull model only collects metrics when they are needed, so Prometheus does not waste resources by collecting metrics that are not being used.
Additionally, Prometheus can automatically discover data sources through the following means:
- Service discovery: Prometheus can use a variety of service discovery mechanisms to find hosts that are running services that expose metrics. For example, Prometheus can use the Kubernetes API to discover pods that are running Prometheus exporters.
- Static configuration: It is also possible to statically configure Prometheus to scrape specific resources. This is useful for resources that are not discoverable by other means.
- File discovery: Prometheus can also discover resources by looking for files that contain metrics. For example, Prometheus can discover files that are generated by collectd or Nagios.
Once Prometheus has discovered a resource, it will periodically scrape the resource for metrics. The metrics are then stored in Prometheus's database, where they can be queried and visualized.
What are the four metric types of Prometheus?
- Counters track cumulative values that can only go up. They are often used to track things like requests served, errors, and bytes transferred.
- Gauges track ratios that can go up or down, most commonly measuring the rate per second. They are often used to track things like memory usage, CPU usage, and disk space.
- Histograms track the distribution of values. They are often used to track things like request latency and response size.
- Summaries are similar to histograms, but they also track quantiles. This makes them more useful for identifying outliers and understanding the overall distribution of values.
What is PromQL?
PromQL is a powerful and flexible query language for the metrics collected by Prometheus that can be used to create ad-hoc graphs, tables, and alerts.
PromQL uses a functional query language that lets the user select and aggregate time-series data in real time. The result of an expression can either be shown as a graph, viewed as tabular data in Prometheus's expression browser, or consumed by external systems via the HTTP API.
Here are some of the things that Prometheus and PromQL can be used for:
- Monitoring the health of your applications and infrastructure: Prometheus collects metrics and alerts on potential problems
- Identifying potential problems: Prometheus compares current metrics to historical data and alerts on any significant deviations
- Troubleshooting issues: Prometheus provides a detailed view of the system's state and allows users to drill down into specific metrics and resources to identify the root cause of the problem
- Visualizing your data: Prometheus uses its PromQL query language to query its time-series data and then displays the results in a variety of formats, including graphs, tables, and alerts
- Creating alerts: Prometheus uses its PromQL query language to query its time-series data and then sends notifications when the results meet certain conditions
- Visualizing in third-party tools: Any front end that understands the Prometheus Query API, such as Grafana or Kiali, can query the Prometheus server and display data
PromQL query examples
Here are some examples of PromQL queries:
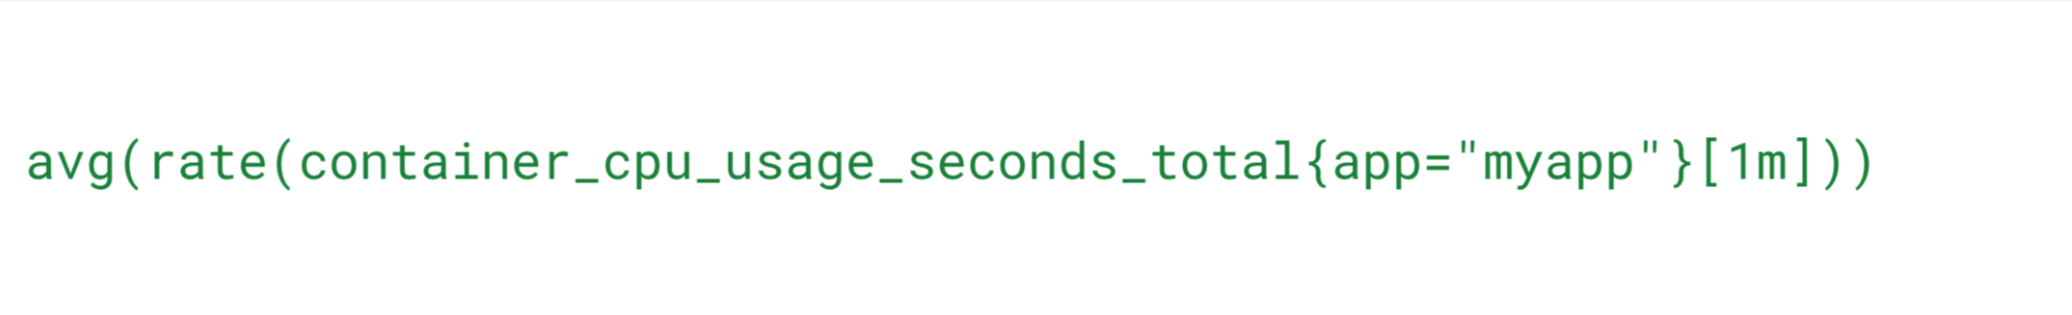
Average per-second CPU usage
To get the average per-second CPU usage for a specific application, you could use the following query:
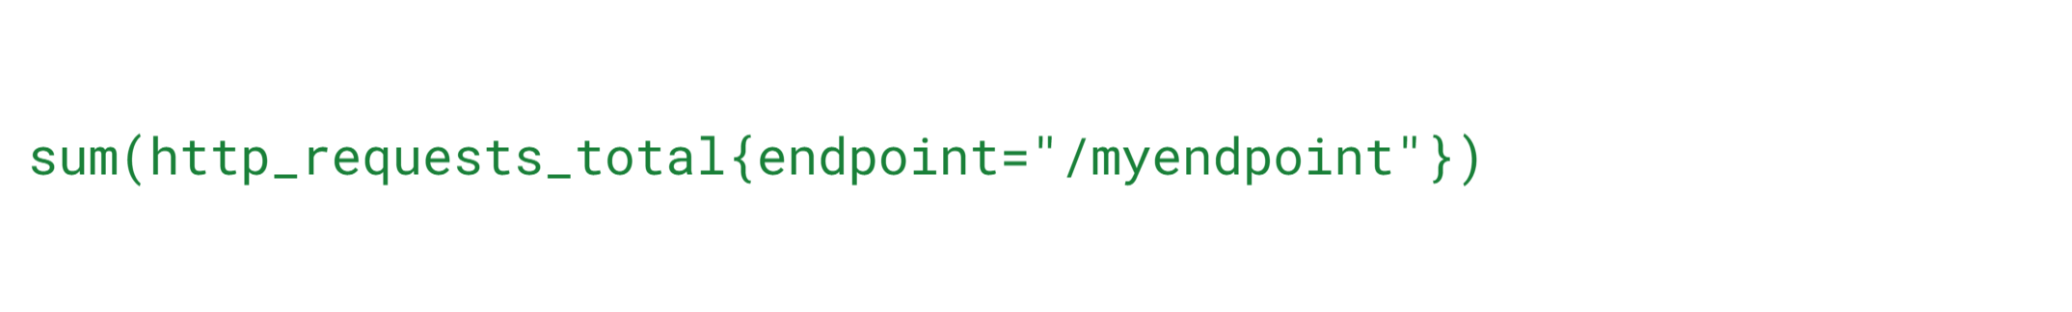
Number of endpoint requests
To get the number of requests that have been made to a specific endpoint, you could use the following query:
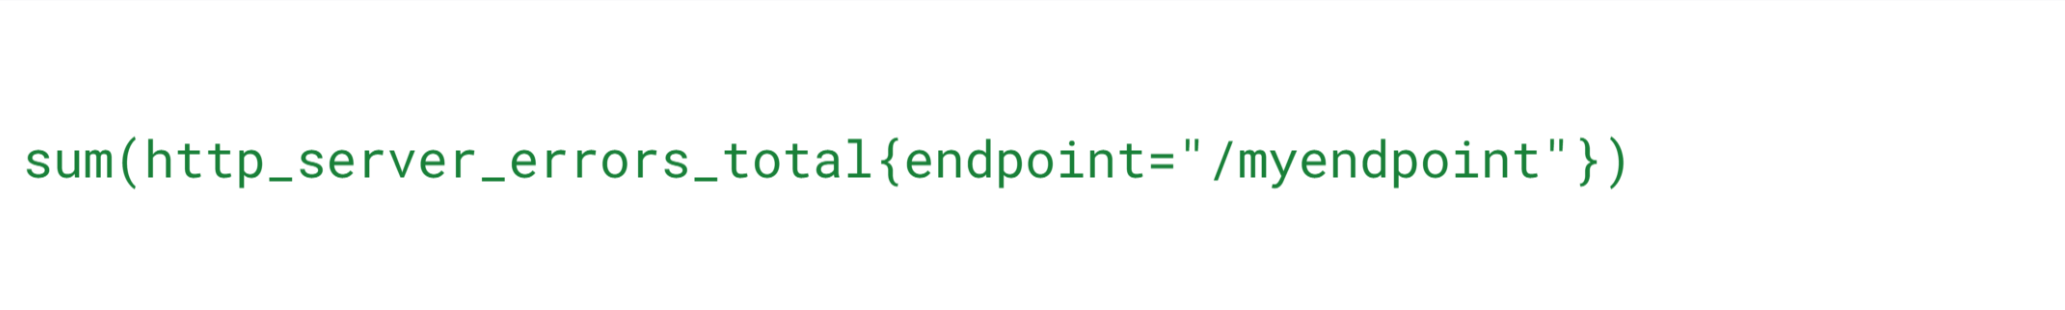
Number of endpoint request errors
To get the total number of errors that have been returned from a specific endpoint, you could use the following query:
Related products and services
 Managed Service for PrometheusGoogle’s managed and easy-to-use monitoring service, built on the same globally scalable data store used by Google Cloud.
 Google Kubernetes EngineFully managed Kubernetes service with full Kubernetes API, four-way autoscaling, release channels, and multi-cluster support.
 Google Cloud’s ObservabilityBuilt-in system logging and monitoring along with application logs, metrics, and traces all managed in one location.