Dataflow collects metrics for your jobs, which can help you to debug errors, troubleshoot performance issues, or optimize your pipeline. The Dataflow monitoring interface displays visualizations for these metrics. You can also use Cloud Monitoring to create alerts or build Metrics Explorer queries.
Access job metrics
To view the job metrics for a job, perform the following steps:
In the Google Cloud console, go to the Dataflow > Jobs page.
Select a job.
Click the Job metrics tab.
Select a metric to view.
To access additional information in the job metrics charts, click Explore data.
Each metric is organized into the following dashboards:
For a complete list of Dataflow metrics, see Google Cloud metrics.
Support and limitations
When using the Dataflow metrics, be aware of the following details.
Sometimes job data is intermittently unavailable. When data is missing, gaps appear in the job monitoring charts.
Some of these charts are specific to streaming pipelines.
To write metrics data, a user-managed service account must have the IAM API permission
monitoring.timeSeries.create. This permission is included with the Dataflow worker role.The Dataflow service reports the reserved CPU time after jobs complete. For unbounded (streaming) jobs, reserved CPU time is only reported after jobs are cancelled or fail. Therefore, the job metrics don't include reserved CPU time for streaming jobs.
Autoscaling metrics
Horizontal Autoscaling enables Dataflow to choose the appropriate number of worker instances for your job, adding or removing workers as needed.
The Autoscaling section of the Job metrics tab shows the number of workers and the target number of workers over time. If your job uses Streaming Engine, it also shows the minimum and maximum number of workers.

To see the history of autoscaling changes, click More history. A table with information about the worker history of your job displays.

To see additional autoscaling information for streaming jobs, click the Autoscaling tab. For more information, see Monitor Dataflow autoscaling.
Overview metrics
The following metrics appear under Overview metrics.
Data freshness
This metric applies only to streaming jobs.
Data freshness is the difference between the time when a data element is processed (processing time) and the data element's timestamp (event time). Higher values mean there was a longer delay between the event time and the processing time.
The data freshness chart shows the maximum data freshness value at any point in time. Dataflow processes multiple elements in parallel, so the graph reflects the element with the largest delay relative to its event time.
If some input data has not yet been processed, the output watermark might be delayed, which affects data freshness. A significant difference between the watermark time and the event time might indicate a slow or stuck operation. For more information, see Watermarks and late data in the Apache Beam documentation.
The dashboard includes the following two charts:
- Data freshness by stages
- Data freshness
In the following image, the highlighted area shows a large difference between the event time and the output watermark time, indicating a slow operation.

The following issues might cause high values for this metric:
- Performance bottlenecks: If your pipeline has stages with high system latency or logs indicating stuck transforms, the pipeline might have performance issues that could raise data freshness. To investigate further, see Troubleshoot slow or stuck streaming-jobs.
- Data source bottlenecks: If your data sources have growing backlogs, the
event timestamps of your elements might diverge from the watermark as they wait to be
processed. Large backlogs are often caused either by performance bottlenecks,
or data source issues which are best detected by monitoring the sources used
by your pipeline.
- Unordered sources such as Pub/Sub can produce stuck watermarks even while outputting at a high rate. This situation occurs because elements are not output in timestamp order, and the watermark is based on the minimum unprocessed timestamp.
- Frequent retries: If you see any errors indicating elements failing to process and getting retried, that older timestamps from retried elements might be raising data freshness. The list of common Dataflow errors can help you troubleshoot.
For recently updated streaming jobs, information about the job state and the watermark might be unavailable. The update operation makes several changes that take a few minutes to propagate to the Dataflow monitoring interface. Try refreshing the monitoring interface five minutes after updating your job.
System latency
This metric applies only to streaming jobs.
System latency is the current maximum number of seconds that an item of data has been processing or awaiting processing. The metric include how long elements wait inside a source. For example, if an output destination stops accepting write requests for a period of time, data might accumulate at the source, causing system latency to go up. If the write operations resume and the pipeline is able to catch up, system latency returns to its baseline level.
The following cases are additional considerations:
- For multiple sources and sinks, system latency is the maximum amount of time that an element waits inside a source before it's written to all sinks.
- Sometimes, a source does not provide a value for the time period for which an element waits inside the source. In addition, the element might not have metadata to define its event time. In this scenario, system latency is calculated from the time the pipeline first receives the element.
The dashboard includes the following two charts:
- System latency by stages
- System latency

Throughput
Throughput is the volume of data that is processed at any point in time. The dashboard includes the following charts:
- Throughput per step in elements per second
- Throughput per step in bytes per second

Worker error log count
The Worker error log count shows you the rate of errors observed across all workers at any point in time.

Streaming metrics
The following metrics appear under Streaming metrics.
Backlog
This metric applies only to streaming jobs.
The Backlog dashboard provides information about elements waiting to be processed. The dashboard includes the following two charts:
- Backlog seconds (Streaming Engine only)
- Backlog bytes (with and without Streaming Engine)
The Backlog seconds chart shows an estimate of the amount of time in seconds needed to consume the current backlog if no new data arrives and throughput doesn't change. The estimated backlog time is calculated from both the throughput and the backlog bytes from the input source that still need to be processed. This metric is used by the streaming autoscaling feature to determine when to scale up or down.

The Backlog bytes chart shows the amount of known unprocessed input for a stage in bytes. This metric compares the remaining bytes to be consumed by each stage against upstream stages. For this metric to report accurately, each source ingested by the pipeline must be configured correctly. Built-in sources such as Pub/Sub and BigQuery are already supported out of the box, however, custom sources require some extra implementation. For more details, see autoscaling for custom unbounded sources.

Processing
This metric applies only to streaming jobs.
When you run an Apache Beam pipeline on the Dataflow service, pipeline tasks run on worker VMs. The Processing dashboard provides information about the amount of time tasks have been processing on the worker VMs. The dashboard includes the following two charts:
- User processing latencies heatmap
- User processing latencies by stage
The User processing latencies heatmap shows the maximum operation latencies over the 50th, 95th, and 99th percentile distributions. Use the heatmap to see whether any long-tail operations are causing high overall system latency or are negatively affecting overall data freshness.
To fix an upstream issue before it becomes a problem downstream, set an alerting policy for high latencies in the 50th percentile.

The User processing latencies by stage chart shows the 99th percentile for all tasks that workers are processing broken down by stage. If user code is causing a bottleneck, this chart shows which stage contains the bottleneck. You can use the following steps to debug the pipeline:
Use the chart to find a stage with an unusually high latency.
On the job details page, in the Execution details tab, for Graph view, select Stage workflow. In the Stage workflow graph, find the stage that has unusually high latency.
To find the associated user operations, in the graph, click the node for that stage.
To find additional details, navigate to Cloud Profiler, and use Cloud Profiler to debug the stack trace at the correct time range. Look for the user operations that you identified in the previous step.

Parallelism
This metric applies only to Streaming Engine jobs.
The Parallel processing chart shows the approximate number of keys in use for data processing for each stage. Dataflow scales based on the parallelism of a pipeline.
When Dataflow runs a pipeline, the processing is distributed across multiple Compute Engine virtual machines (VMs), also known as workers. The Dataflow service automatically parallelizes and distributes the processing logic in your pipeline to the workers. Processing for any given key is serialized, so the total number of keys for a stage represents the maximum available parallelism at that stage.
Parallelism metrics can be useful for finding hot keys or bottlenecks for slow or stuck pipelines.

Persistence
This metric applies only to streaming jobs.
The Persistence dashboard provides information about the rate at which persistent storage is written and read by a particular pipeline stage in bytes per second. Bytes read and written include user state operations and state for persistent shuffles, duplicate removal, side-inputs, and watermark tracking. Pipeline coders and caching affect bytes read and written. Storage bytes might differ from processed bytes due to internal storage usage and caching.
The dashboard includes the following two charts:
- Storage write
- Storage read

Duplicates
This metric applies only to streaming jobs.
The Duplicates chart shows the number of messages being processed by a particular stage that have been filtered out as duplicates.
Dataflow supports many sources and sinks which guarantee at least once delivery. The downside of at least once delivery is that it can result in duplicates.
Dataflow guarantees exactly once delivery, which means that duplicates are automatically filtered out.
Downstream stages are saved from reprocessing the same elements, which ensures that state and outputs are not affected.
The pipeline can be optimized for resources and performance by reducing the number of duplicates produced in each stage.

Timers
This metric applies only to streaming jobs.
The Timers dashboard provides information about the number of timers pending and the number of timers already processed in a particular pipeline stage. Because windows rely on timers, this metric lets you track the progress of windows.
The dashboard includes the following two charts:
- Timers pending by stage
- Timers processing by stage
These charts show the rate at which windows are pending or processing at a specific point in time. The Timers pending by stage chart indicates how many windows are delayed due to bottlenecks. The Timers processing by stage chart indicates how many windows are collecting elements.
These charts display all job timers, so if timers are used elsewhere in your code, those timers also appear in these charts.


Resource metrics
The following metrics appear under Resource metrics.
CPU utilization
CPU utilization is the amount of CPU used divided by the amount of CPU available for processing. This per-worker metric is displayed as a percentage. The dashboard includes the following four charts:
- CPU utilization (All workers)
- CPU utilization (Stats)
- CPU utilization (Top 4)
- CPU utilization (Bottom 4)

Memory utilization
Memory utilization is the estimated amount of memory used by the workers in bytes per second. The dashboard includes the following two charts:
- Max worker memory utilization (estimated bytes per second)
- Memory utilization (estimated bytes per second)
The Max worker memory utilization chart provides information about the workers that use the most memory in the Dataflow job at each point in time. If, at different points during a job, the worker using the maximum amount of memory changes, the same line in the chart displays data for multiple workers. Each data point in the line displays data for the worker using the maximum amount of memory at that time. The chart compares the estimated memory used by the worker to the memory limit in bytes.
You can use this chart to troubleshoot out-of-memory (OOM) issues. Worker out-of-memory crashes are not shown on this chart.
The Memory utilization chart shows an estimate of the memory used by all workers in the Dataflow job compared to the memory limit in bytes.
Input and output metrics
If your streaming Dataflow job reads or writes records using Pub/Sub, the Job metrics tab shows metrics for Pub/Sub reads or writes.
All input metrics of the same type are combined, and all output metrics are also combined. For example, all Pub/Sub metrics are grouped in one section. Each metric type is organized into a separate section. To change which metrics are displayed, select the section on the left which best represents the metrics you're looking for. The following images show all the available sections.

The following two charts are displayed in both the Input Metrics and Output Metrics sections.

Requests per second
Requests per sec is the rate of API requests to read or write data by the source or sink over time. If this rate drops to zero, or decreases significantly for an extended time period relative to expected behavior, then the pipeline might be blocked from performing certain operations. Also, there might be no data to read. In such a case, review the job steps that have a high system watermark. Also, examine the worker logs for errors or indications about slow processing.

Response errors per second by error type
Response errors per sec by error type is the rate of failed API requests to read or write data by the source or sink over time. If such errors occur frequently, these API requests might slow down processing. Such failed API requests must be investigated. To help troubleshoot these issues, review the general Input and output error codes. Also review any specific error code documentation used by the source or sink, such as the Pub/Sub error codes.

For more information about scenarios where you can use these metrics for debugging, see Tools for debugging in "Troubleshoot slow or stuck jobs."
Use Cloud Monitoring
Dataflow is fully integrated with Cloud Monitoring. Use Cloud Monitoring for the following tasks:
- Create alerts when your job exceeds a user-defined threshold.
- Use Metrics Explorer to build queries and adjust the timespan of the metrics.
- View metrics that don't appear in the Dataflow monitoring interface.
For instructions about creating alerts and using Metrics Explorer, see Use Cloud Monitoring for Dataflow pipelines.
For the complete list of Dataflow metrics, see the Google Cloud Platform metrics documentation.
Create Cloud Monitoring alerts
Cloud Monitoring lets you create alerts when your Dataflow job exceeds a user-defined threshold. To create a Cloud Monitoring alert from a metric chart, click Create alerting policy.
If you're unable to see the monitoring graphs or create alerts, you might need additional Monitoring permissions.
View in Metrics Explorer
You can view the Dataflow metrics charts in Metrics Explorer, where you can build queries and adjust the timespan of the metrics.
To view the Dataflow charts in Metrics Explorer, in the Job metrics view, open More chart options and click View in Metrics Explorer.
When you adjust the timespan of the metrics, you can select a predefined duration or select a custom time interval to analyze your job.
By default, for streaming jobs and in-flight batch jobs, the display shows the previous six hours of metrics for that job. For stopped or completed streaming jobs, the default display shows the entire runtime of the job duration.
Dataflow I/O metrics
You can view the following Dataflow I/O metrics in Metrics Explorer:
job/pubsub/write_count: Pub/Sub publish requests from PubsubIO.Write in Dataflow jobs.job/pubsub/read_count: Pub/Sub pull requests from PubsubIO.Read in Dataflow jobs.job/bigquery/write_count: BigQuery publish requests from BigQueryIO.Write in Dataflow jobs.job/bigquery/write_countmetrics are available in Python pipelines using the WriteToBigQuery transform withmethod='STREAMING_INSERTS'enabled on Apache Beam v2.28.0 or later. This metric is available for both batch and streaming pipelines.- If your pipeline uses a BigQuery source or sink, to troubleshoot quota issues, use the BigQuery Storage API metrics.
DoFn metrics
For streaming jobs that use Streaming Engine
and don't use Runner v2, you can view the following
metrics for individual user-defined DoFns:
job/dofn_latency_average: The average message processing time for a singleDoFnover the past 3-minute window, in milliseconds.job/dofn_latency_max: The maximum message processing time for a singleDoFnover the past 3-minute window, in milliseconds.job/dofn_latency_min: The minimum message processing time for a singleDoFnover the past 3-minute window, in milliseconds.job/dofn_latency_num_messages: The number of messages processed by a singleDoFnover the past 3-minute.job/dofn_latency_total: The total message processing time for all messages in a singleDoFnover the past 3-minute window, in milliseconds.job/oldest_active_message_age: How long the oldest active message has been processing within aDoFn, in milliseconds.
These metrics require Apache Beam SDK version 2.53.0 or later. To view these metrics, use Metrics Explorer.
You can use these metrics to find which DoFns contribute the most to
processing latency in your jobs. For example, if a job is stuck, use the
job/oldest_active_message_age metric to find the DoFn with the oldest active
message. The following image shows a DoFn with a large spike in this metric:
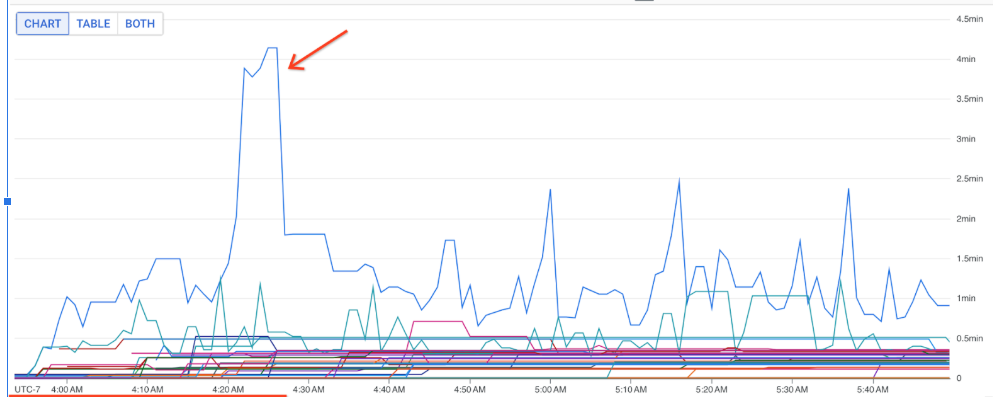
To view the name of the DoFn, hold the pointer over the graph line.
What's next
- Troubleshoot slow or stuck streaming jobs.
- Troubleshoot slow or stuck batch jobs.
- Tune Horizontal Autoscaling for streaming pipelines
- Optimize costs