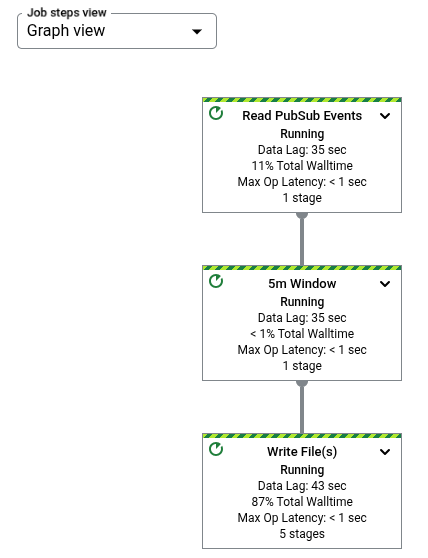
The Dataflow monitoring interface provides a graphical representation of each job: the job graph. The job graph also provides a job summary, a job log, and information about each step in the pipeline.
To view the job graph for a job, perform the following steps:
In the Google Cloud console, go to the Dataflow > Jobs page.
Select a job.
Click the Job graph tab.
By default, the job graph page displays the Graph view. To view your job graph as a table, in Job steps view, select Table view. The table view contains the same information in a different format. The table view is helpful in the following scenarios:
- Your job has many stages, making the job graph difficult to navigate.
- You want to sort the job steps by a specific property. For example, you can sort the table by wall time to identify slow steps.
Graph view
The job graph represents each transform in the pipeline as a box. The following
image shows a job graph with three transforms: Read PubSub Events,
5m Window, and Write File(s).

Each box contains the following information:
Status; one of the following:
- Running: the step is running
- Queued: the step in a FlexRS job is queued
- Succeeded: the step finished successfully
- Stopped: the step stopped because the job stopped
- Unknown: the step failed to report status
- Failed: the step failed to complete
The number of job stages that execute this step
If a step represents a composite transform, you can expand the step to view the sub-transforms. To expand the step, click the Expand node arrow.
Transform names
Dataflow has a few different ways to obtain the transform name that's shown in the monitoring job graph. Transform names are used in publicly-visible places, including the Dataflow monitoring interface, log files, and debugging tools. Don't use transform names that include personally identifiable information, such as usernames or organization names.
Java
- Dataflow can use a name that you assign when you apply your transform. The first
argument you supply to the
applymethod is your transform name. - Dataflow can infer the transform name, either from the class name, if you build a
custom transform, or the name of your
DoFnfunction object, if you use a core transform such asParDo.
Python
- Dataflow can use a name that you assign when you apply your transform. You can set the
transform name by specifying the transform's
labelargument. - Dataflow can infer the transform name, either from the class name, if you build a
custom transform, or the name of your
DoFnfunction object, if you use a core transform such asParDo.
Go
- Dataflow can use a name that you assign when you apply your transform. You can set the
transform name by specifying the
Scope. - Dataflow can infer the transform name, either from the
struct name if you're using a structural
DoFnor from the function name if you're using a functionalDoFn.
View step information
When you click a step in the job graph, the Step Info panel shows more details about the step. For more information, see Job step information.
Bottlenecks
If Dataflow detects a bottleneck, the job graph shows an alert symbol on the affected steps. To see the cause of the bottleneck, click the step to open the Step Info panel. For more information, see Troubleshoot bottlenecks.

Example job graphs
This section shows some example pipeline code and the corresponding job graphs.
Basic job graph
Pipeline Code:
Java// Read the lines of the input text. p.apply("ReadLines", TextIO.read().from(options.getInputFile())) // Count the words. .apply(new CountWords()) // Write the formatted word counts to output. .apply("WriteCounts", TextIO.write().to(options.getOutput())); Python( pipeline # Read the lines of the input text. | 'ReadLines' >> beam.io.ReadFromText(args.input_file) # Count the words. | CountWords() # Write the formatted word counts to output. | 'WriteCounts' >> beam.io.WriteToText(args.output_path)) Go// Create the pipeline. p := beam.NewPipeline() s := p.Root() // Read the lines of the input text. lines := textio.Read(s, *input) // Count the words. counted := beam.ParDo(s, CountWords, lines) // Write the formatted word counts to output. textio.Write(s, *output, formatted) |
Job graph:
|
Job graph with composite transforms
Composite transforms are transforms that contain multiple nested sub-transforms. In the job graph, composite transforms are expandable. To expand the transform and view the sub-transforms, click the arrow.
Pipeline Code:
Java// The CountWords Composite Transform // inside the WordCount pipeline. public static class CountWords extends PTransform<PCollection<String>, PCollection<String>> { @Override public PCollection<String> apply(PCollection<String> lines) { // Convert lines of text into individual words. PCollection<String> words = lines.apply( ParDo.of(new ExtractWordsFn())); // Count the number of times each word occurs. PCollection<KV<String, Long>> wordCounts = words.apply(Count.<String>perElement()); return wordCounts; } } Python# The CountWords Composite Transform inside the WordCount pipeline. @beam.ptransform_fn def CountWords(pcoll): return ( pcoll # Convert lines of text into individual words. | 'ExtractWords' >> beam.ParDo(ExtractWordsFn()) # Count the number of times each word occurs. | beam.combiners.Count.PerElement() # Format each word and count into a printable string. | 'FormatCounts' >> beam.ParDo(FormatCountsFn())) Go// The CountWords Composite Transform inside the WordCount pipeline. func CountWords(s beam.Scope, lines beam.PCollection) beam.PCollection { s = s.Scope("CountWords") // Convert lines of text into individual words. col := beam.ParDo(s, &extractFn{SmallWordLength: *smallWordLength}, lines) // Count the number of times each word occurs. return stats.Count(s, col) } |
Job graph:
|
In your pipeline code, you might use the following code to invoke your composite transform:
result = transform.apply(input);
Composite transforms invoked in this manner omit the expected nesting and might appear expanded in the Dataflow monitoring interface. Your pipeline might also generate warnings or errors about stable unique names at pipeline execution time.
To avoid these issues, invoke your transforms by using the recommended format:
result = input.apply(transform);
What's next
- View detailed job step information
- View job stages in the Execution details tab
- Troubleshoot your pipeline


