管道會在機器叢集中執行。這些執行緒會將需要完成的工作分割,然後在叢集中分散的多個執行緒上並行執行工作,以便達到高總處理量。一般來說,分割 (又稱為分區) 數量越多,管道執行速度就越快。管道中的來源和洗牌階段會決定管道中的並行處理程度。
來源
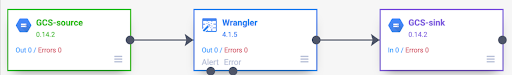
在每個管道執行作業的開頭,管道中的每個來源都會計算需要讀取的資料,以及如何將資料分割成多個部分。舉例來說,您可以考慮使用基本管道,從 Cloud Storage 讀取資料、執行 Wrangler 轉換作業,然後將資料寫回 Cloud Storage。
管道啟動時,Cloud Storage 來源會檢查輸入檔案,並根據檔案大小將檔案分割成多個部分。舉例來說,單一 GB 檔案可分割成 100 個分割檔案,每個檔案大小為 10 MB。每個執行緒都會讀取該分割作業的資料、執行 Wrangler 轉換作業,然後將輸出內容寫入 part 檔案。

如果管道執行速度緩慢,請先檢查來源是否已建立足夠的分割項目,以便充分發揮並行處理的優勢。舉例來說,某些壓縮類型會導致純文字檔無法分割。如果您讀取已經過 gzip 壓縮的檔案,可能會發現管道的執行速度比讀取未壓縮的檔案或使用 BZIP 壓縮的檔案 (可分割) 還要慢。同樣地,如果您使用資料庫來源,並將其設為只使用單一分割,則執行速度會比將其設為使用更多分割的速度慢得多。
隨機播放
某些類型的外掛程式會導致資料在叢集中重新排序。當由一個執行緒處理的記錄需要傳送至另一個執行緒執行運算時,就會發生這種情況。因為 Shuffle 涉及大量 I/O,因此是耗用資源的作業。會導致資料重新排序的外掛程式,都會顯示在 Pipeline Studio 的「Analytics」專區。包括「Group By」、「Deduplicate」、「Distinct」和「Joiner」等外掛程式。舉例來說,假設在前述範例中,管道中新增了「Group By」階段。
假設讀取的資料代表在雜貨店購買的商品。每筆記錄都包含 item 欄位和 num_purchased 欄位。在「Group By」階段,我們會設定管道,以便依 item 欄位分組記錄,並計算 num_purchased 欄位的總和。
管道執行時,輸入檔案會依照前述方式分割。之後,每筆記錄都會在叢集中重新排序,讓每筆含有相同項目的記錄都屬於同一個執行者。
如上例所示,蘋果購買交易的記錄原本分散在多個執行緒中。如要執行匯總作業,所有這些記錄都必須透過叢集傳送至同一個執行緒。
大多數需要隨機播放的外掛程式都會讓您指定隨機播放資料時要使用的分區數量。這個值會控制用來處理排序資料的執行緒數量。
在上例中,如果將分區數量設為 2,每個執行緒會計算兩個項目的匯總值,而不是一個。
請注意,您可以在該階段後降低管道的並行處理能力。舉例來說,請考量管道的邏輯檢視畫面:
如果來源將資料分割成 500 個分區,但 Group By 使用 200 個分區進行洗牌,則 Group By 後的最大並行處理層級會從 500 降至 200。您只需要 200 個檔案,而非 500 個,就能將部分檔案寫入 Cloud Storage。
選擇分區
如果分割區數量過低,您就無法充分運用叢集的容量,以便盡可能並行執行工作。如果設定的分區數量過高,不必要的負擔就會增加。一般來說,使用太多分區比使用太少分區來得好。如果管道需要幾分鐘才能執行,而您想節省幾分鐘的時間,就必須考慮額外的額外負擔。如果管道需要花費數小時才能執行,您通常不必擔心額外負擔。
如要判斷要使用的分區數量,您可以將其設為 max(cluster CPUs, input records / 500,000),這雖然是個實用但過於簡化的做法,換句話說,請將輸入記錄數除以 500,000。如果該數字大於叢集 CPU 數量,請將該數字用於分割區數量。否則,請使用叢集 CPU 數量。舉例來說,如果叢集有 100 個 CPU,且排序階段預計會有 1 億個輸入記錄,請使用 200 個區隔。
更完整的答案是,如果每個區隔的中繼排序資料都能完全放入執行者的記憶體,那麼排序的效能就會達到最佳狀態,這樣就不需要將任何資料溢寫到磁碟。Spark 會保留執行緒記憶體的 30% 以下,用於儲存隨機資料。具體數字為 (總記憶體 - 300 MB) * 30%。如果假設每個執行緒都設定為使用 2 GB 記憶體,則每個分割區應最多可容納 (2 GB - 300 MB) * 30% = 約 500 MB 的記錄。如果假設每個記錄的壓縮大小為 1 KB,那麼 (500 MB / 分割區) / (1 KB / 記錄) = 每個分割區有 500,000 個記錄。如果執行緒使用較多記憶體,或記錄較小,您可以視情況調整這個數字。
資料偏移
請注意,在上述範例中,各項商品的購買次數均平均分配。也就是說,蘋果、香蕉、胡蘿蔔和雞蛋各有三筆購買交易。以平均分布的鍵進行洗牌是效能最佳的洗牌類型,但許多資料集都沒有這個屬性。以上述雜貨店購物範例來說,您預期購買雞蛋的次數會遠多於購買婚禮卡。如果有幾個隨機鍵比其他鍵更常見,表示您正在處理偏差的資料。資料偏差可能會導致效能大幅下降,因為少數執行緒會執行不成比例的工作量。導致某些子集區分區的大小遠大於其他所有區分區。
在這個範例中,蛋的購買次數是卡片的五倍,也就是說,蛋的匯總值計算時間大約是卡片的五倍。當處理的記錄數為 10 個 (而非 2 個) 時,這項差異不大,但當處理的記錄數為 50 億 (而非 10 億) 時,差異就很大。如果資料出現偏差,在隨機播放中使用的分區數量不會對管道效能造成太大影響。
您可以查看輸出記錄的圖表,瞭解資料偏差情形。如果階段在管道執行開始時以更快的速度輸出記錄,然後突然變慢,這可能表示資料有偏差。
您也可以檢查叢集的記憶體用量變化,找出資料偏移。如果叢集已達到容量一段時間,但突然在一段時間內記憶體使用量偏低,這也是您正在處理資料偏差的徵兆。
在執行彙整作業時,偏差資料會對效能造成最嚴重的影響。有幾種技巧可用來改善偏斜彙整的效能。詳情請參閱「JOIN 作業的平行處理」。
執行作業的自動調整
如要調整執行作業,請指定要使用的分區範圍,而非確切的分區編號。啟用自適應執行作業時,即使在管道設定中設定了確切的分區數,系統也會忽略該數字。
如果您使用的是暫時性 Dataproc 叢集,Cloud Data Fusion 會自動設定適當的設定,但對於靜態 Dataproc 或 Hadoop 叢集,您可以設定下列兩個設定參數:
spark.default.parallelism:將其設為叢集中可用的 vCore 總數。這可確保叢集不會負載不足,並定義分區數量的下限。spark.sql.adaptive.coalescePartitions.initialPartitionNum:將其設為叢集中可用的 vCore 數量的 32 倍。這會定義分區數量的上限。Spark.sql.adaptive.enabled:如要啟用最佳化功能,請將這個值設為true。Dataproc 會自動設定此值,但如果您使用的是一般 Hadoop 叢集,請務必確認已啟用此值。
這些參數可在特定管道的引擎設定中設定,或在靜態 Dataproc 叢集的叢集屬性中設定。