Monitor instances

This page helps you monitor AlloyDB instances by using the following methods:

Before you begin

To access the System Insights dashboard, enable access to AlloyDB for PostgreSQL in your Google Cloud project.

Required roles

To use AlloyDB System Insights, you need permissions to do the following:

  • To access System Insights, you need permissions to access the AlloyDB System Insights dashboard.
  • To edit System Insights, you need permissions to update AlloyDB instances.

To get these permissions, ask your administrator to grant you one of the following roles:

  • Basic viewer (roles/viewer)
  • Database Insights viewer (roles/databaseinsights.eventsViewer)

For more information about granting roles, see Manage access.

Monitor an instance using the AlloyDB System Insights dashboard

The AlloyDB System Insights dashboard displays metrics of the resources that you use and lets you monitor these resources and metrics.

To view the AlloyDB System Insights dashboard, do the following:

  1. Expand a cluster and click the name of an instance.
  2. From the left navigation panel, select the Monitoring tab.

The AlloyDB System Insights dashboard opens. It shows details about the cluster at the top followed by charts for the key metrics.
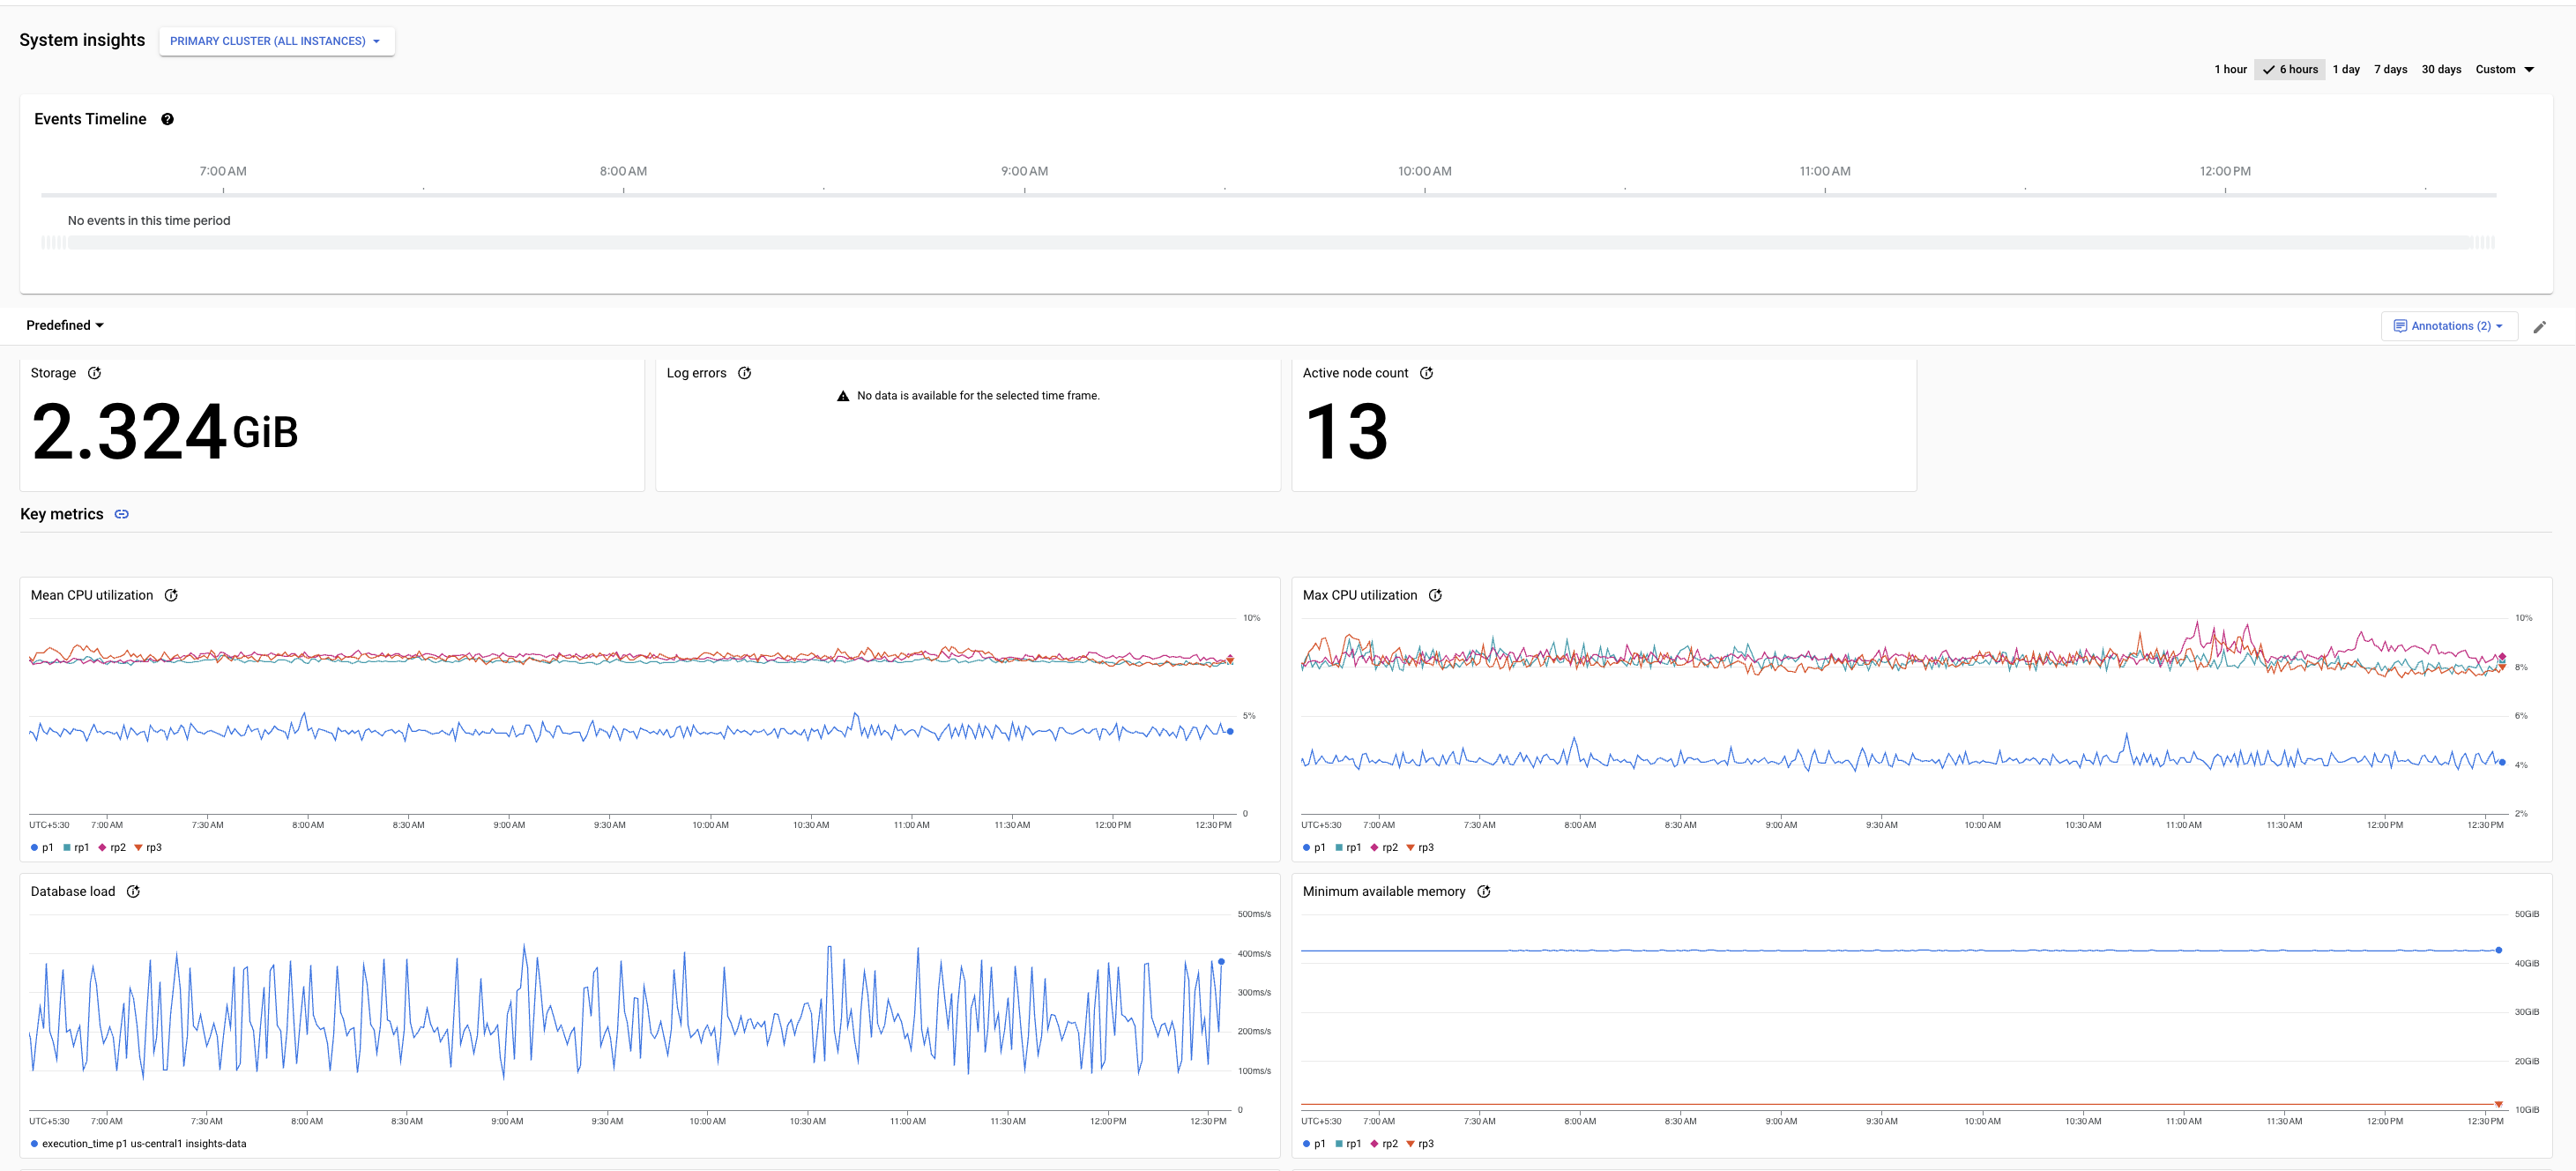
Shows the AlloyDB System Insights dashboard. It has a filter for setting
         a time range. Below that, charts of important metrics are shown.

The dashboard offers the following high-level options:

  • By default, the Cluster (all instances) view is selected. You can choose to view metrics for the primary instance or for read pool instances.

  • To view either two charts side-by-side or only one chart per row, click the toggle button.

  • The time selector shows 1 day selected by default. To change the period, select one of the other predefined periods or click Custom and define a start and end time. Data is available for the last 30 days.

The summary cards show the latest or aggregated values for some metrics, and provide an overview of the database health and performance during the selected period.

The metrics charts show information about some important metrics that help you gain insights into resource usage such as CPU, memory, connections, replication, and storage, and respond proactively as your application needs change.

The system events show information that helps you evaluate the impact of system events on the health and performance of the instance.

Summary cards

The following table describes the summary cards displayed on the AlloyDB System Insights dashboard. These cards provide an overview of the database health and performance during the selected period.

Summary cards Description Dashboard availability
Storage The total storage that the AlloyDB cluster uses during the selected period. Cluster dashboard
Active node count The latest number of active nodes that can serve user traffic in the cluster during the selected period.
  • Cluster dashboard
  • Read pool instance dashboard
CPU utilization The 99th and 50th percentile values of CPU utilization during the selected period.
  • Primary instance dashboard
  • Read pool instance dashboard
Peak connections The ratio of peak connections to maximum connections across all serving nodes of the instance during the selected period. This includes both active and idle connections.
  • Cluster dashboard
  • Primary instance dashboard
  • Read pool instance dashboard
Log errors The total number of error logs generated during the selected period.
  • Cluster dashboard
  • Primary instance dashboard
  • and Read pool instance dashboard
Transactions per second The latest value of transactions per second that are committed or rolled back across all serving nodes of the instance during the selected period.
  • Cluster dashboard
  • Read pool instance dashboard
Max replication lag The average value of the maximum time taken for replication from a primary instance to a read pool during the selected period. Primary instance dashboard

Metrics charts

A chart card for a sample metric appears as follows.
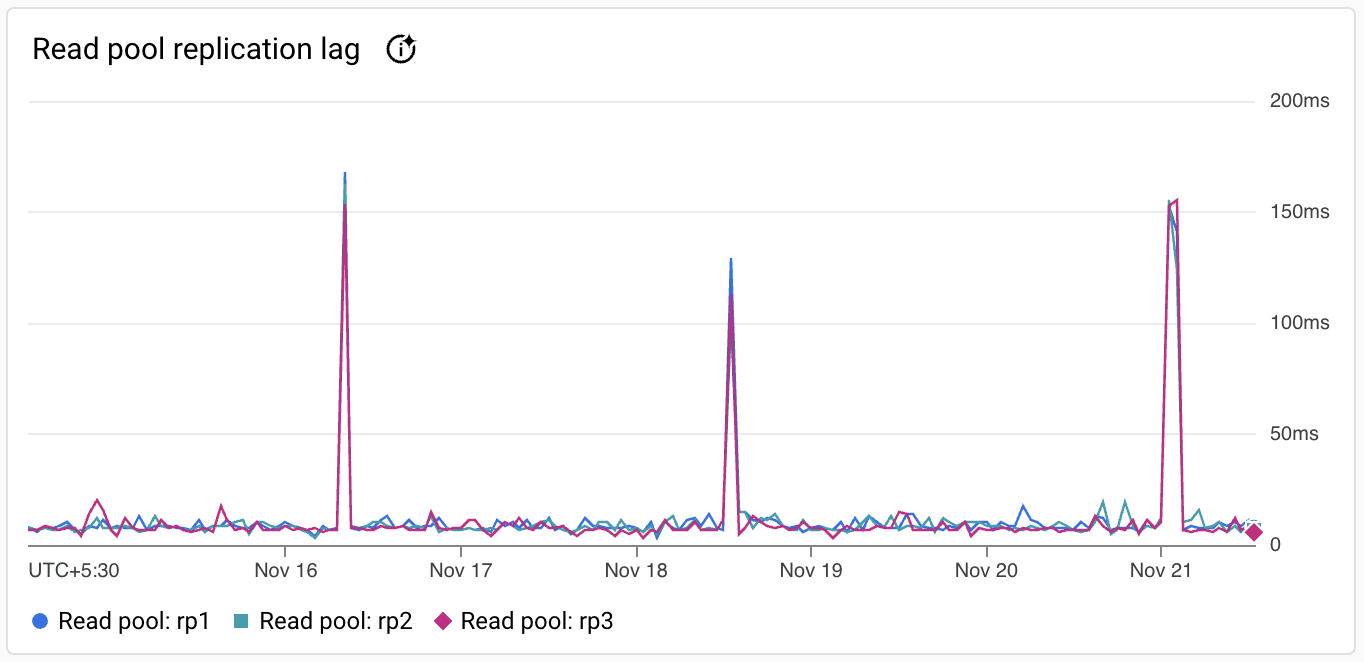
Graph showing sample AlloyDB for PostgreSQL metric data.

The toolbar on each chart card provides the following set of standard options:

  • To hide or display the legend, click .

  • To view metric values for a specific moment in the selected period, move the cursor over the chart.

  • To view a chart in full-screen mode, click . To exit full-screen mode, click Esc.

  • To zoom a chart, click the chart and drag horizontally along the x-axis or vertically along the y-axis. To revert the zoom operation, click . Zoom operations apply at the same time to all charts on a dashboard.

  • To view additional options, click . Most charts offer these options:

    • Download a PNG image.
    • Add to custom dashboard. Provide a name for the dashboard or select an existing custom dashboard. View and edit the dashboard using Cloud Monitoring.
    • View in Metrics Explorer. View the metric in Metrics Explorer. You can view other AlloyDB metrics in the Metrics Explorer by selecting the AlloyDB instance resource type.

The following table describes the metrics charts that are displayed on the AlloyDB System Insights dashboard and in the Metrics Explorer. The metric type strings must be prefixed with alloydb.googleapis.com/. For example, alloydb.googleapis.com/Instance.

Launch stages of these metrics: BETA, GA

Cluster dashboard metrics

Display name and metric nameDescription
Rows in database by state BETA
database/postgresql/tuples

The number of live and dead rows in the instance. Only available for instances with the number of databases less than 50.

Query latency BETA
database/postgresql/insights/aggregate/latencies
The aggregated P99 query latency distribution for each instance. Only available for instances with Query Insights enabled.
Database load BETA
database/postgresql/insights/aggregate/execution_time
The accumulated query execution time for each instance. This is the sum of CPU time, I/O wait time, lock wait time, process context switch, and scheduling for all processes involved in query execution. Only available for instances with Query Insights enabled.
Max CPU utilization GA
instance/cpu/maximum_utilization
The maximum CPU utilization calculated across all serving nodes of the instance, represented as a percentage for each instance.
Mean CPU utilization GA
instance/cpu/average_utilization
The mean CPU utilization calculated as an average across all serving nodes of the instance, represented as a percentage for each instance.
Minimum available memory GA
instance/memory/min_available_memory
The minimum available memory across all serving nodes of the instance. The available memory is an estimate of memory in bytes available for allocation on the VM including memory that is currently used, but can be potentially freed.
Cluster storage GA
cluster/storage/usage
The billable storage that the AlloyDB cluster uses. It does not include the storage that automatic and on-demand backups use.
Queries IO wait time BETA
database/postgresql/insights/aggregate/io_time
The aggregated queries I/O wait time for each instance. Only available for instances with Query Insights enabled.
Number of connections BETA
instance/postgresql/backends_by_state
The number of connections to each instance across all serving nodes of the instance. This includes connections in all states such as idle, active, idle_in_transaction, idle_in_transaction_aborted, disabled, and fastpath_function_call.
Rows fetched vs. rows returned vs. rows written BETA
  • instance/postgresql/fetched_tuples_count
  • instance/postgresql/returned_tuples_count
  • instance/postgresql/written_tuples_count
  • Rows fetched: The aggregated number of rows fetched as a result of queries across the cluster.
  • Rows returned: The aggregated number of rows scanned while processing the queries across the cluster.
  • Rows written: The aggregated number of rows written while performing insert, update, and delete operations across the cluster.
  • Only available for instances with the number of databases less than 5000.
Rows processed by operation BETA
  • database/postgresql/inserted_tuples_count_for_top_databases
  • database/postgresql/updated_tuples_count_for_top_databases
  • database/postgresql/deleted_tuples_count_for_top_databases
The number of rows processed in the primary instance per operation such as insert, update, or delete. Only available for instances with the number of databases less than 5000.
Oldest transaction age BETA
postgresql/vacuum/oldest_transaction_age
The current age of the oldest uncommitted transaction for each instance that is blocking the vacuum operation. It's measured in the number of transactions that started after the oldest transaction.
Transaction ID utilization BETA
postgresql/vacuum/transaction_id_utilization
The current percentage of transaction ID space that's consumed by each instance. It records up to a maximum of two billion unvacuumed transactions as a percentage.
Wait time BETA
instance/postgresql/wait_time
The aggregated accumulated elapsed wait time per wait event name and wait event type across the cluster.
Wait count BETA
instance/postgresql/wait_count
The number of times processes waited per wait event name and wait event type across the cluster.
Temp data size used BETA
instance/postgresql/temp_bytes_written_count
The amount of data (bytes) used in each instance for executing queries and performing algorithms such as join and sort. Only available for instances with the number of databases less than 5000.
Temp files used BETA
instance/postgresql/temp_files_written_count
The number of temporary files that are used in each instance for executing queries and performing algorithms such as join and sort. Only available for instances with the number of databases less than 5000.
New connection count BETA
instance/postgresql/new_connections_count
The number of new connections that are added to each instance. Only available for instances with the number of databases less than 5000.
Statements executed count BETA
database/postgresql/statements_executed_count
The number of statements that are executed in each instance. Only available for instances with Query Insights enabled.
Transaction count GA
instance/postgres/transaction_count
The number of transactions that have occurred in each instance. Only available for instances with the number of databases less than 5000.
Block read count BETA
  • instance/postgresql/blks_hit
  • instance/postgresql/blks_read
The number of blocks read from the disk and from the buffer cache across the cluster. Only available for instances with the number of databases less than 5000.
Deadlock count BETA
instance/postgresql/deadlock_count
The number of deadlocks in each instance. Only available for instances with the number of databases less than 5000.
Read pool replication lag GA
instance/postgres/replication/maximum_lag
The maximum time taken for replication from a primary instance to a read pool. The time lag is calculated across all serving read pool nodes per read pool instance in the cluster.
Active nodes GA
instance/postgres/instances
The number of nodes that can serve user traffic in the cluster.

Instance dashboard metrics

Display name and metric nameDescription
Rows in database by state BETA
database/postgresql/tuples
The number of live and dead rows in the instance. Only available for instances with the number of databases less than 50.
Query latency BETA
database/postgresql/insights/aggregate/latencies
The aggregated P99, P95, and P50 query latency distribution. Only available for instances with Query Insights enabled.
Database load per database, user, or client address BETA
database/postgresql/insights/aggregate/execution_time
The accumulated query execution time per database, user, or client address. This is the sum of CPU time, I/O wait time, lock wait time, process context switch, and scheduling for all processes involved in query execution. Only available for instances with Query Insights enabled.
CPU utilization GA
instance/cpu/maximum_utilization
The current CPU utilization, represented as a percentage of the reserved CPU that's currently in use.
Available memory GA
instance/memory/min_available_memory
The available memory is an estimate of memory in bytes available for allocation on the VM including memory that is currently used, but can be potentially freed.
Queries IO wait breakdown by type BETA
database/postgresql/insights/aggregate/io_time
The breakdown of I/O wait time for SQL statements by IO type (read/write). Only available for instances with Query Insights enabled.
Connections by status BETA
instance/postgresql/backends_by_state
The number of connections grouped by the following statuses: idle, active, idle_in_transaction, idle_in_transaction_aborted, disabled, and fastpath_function_call. For information about these statuses, see the state text row in the pg_stat_activity documentation.
Connections per database BETA
database/postgresql/backends_for_top_databases
The number of connections to the instance per database.
Connections per application BETA
instance/postgresql/backends_for_top_applications
The number of connections to the instance, grouped by applications. Connections without an application name are grouped as Unknown.
Rows fetched vs. rows returned vs. rows written BETA
  • instance/postgresql/fetched_tuples_count
  • instance/postgresql/returned_tuples_count
  • instance/postgresql/written_tuples_count
  • Rows fetched: The number of rows fetched as a result of queries in the instance.
  • Rows returned: The number of rows scanned while processing the queries in the instance.
  • Rows written: The aggregated number of rows written while performing insert, update, and delete operations.
  • If the difference between rows returned and rows fetched is too large that their values aren't shown in the same scale, then the value of rows fetched is shown as 0 because it's negligible compared to the value of rows returned.
Rows processed by operation BETA
  • instance/postgresql/inserted_tuples_count
  • instance/postgresql/updated_tuples_count
  • instance/postgresql/deleted_tuples_count
The number of rows processed in the primary instance per operation such as insert, update, or delete.
Oldest transaction age BETA
postgresql/vacuum/oldest_transaction_age
The current age of the oldest uncommitted transaction that's blocking the vacuum operation. It's measured in the number of transactions that started after the oldest transaction.
Transaction ID utilization BETA
postgresql/vacuum/transaction_id_utilization
The current percentage of transaction ID space that is consumed by the instance. It records up to a maximum of two billion unvacuumed transactions as a percentage.
Wait time BETA
instance/postgresql/wait_time
The accumulated elapsed wait time in the system per wait event name and wait event type.
Wait count BETA
instance/postgresql/wait_count
The number of times processes waited per wait event name and wait event type in the instance.
Temp data size used per database BETA
database/postgresql/temp_bytes_written_for_top_databases
The amount of data (bytes) used in each database for executing queries and performing algorithms such as join and sort.
Temp files used per database BETA
database/postgresql/temp_files_written_for_top_databases
The number of temporary files that are used in each database for executing queries and performing algorithms such as join and sort.
New connection count per database BETA
database/postgresql/new_connections_for_top_databases
The number of new connections that are added to the instance per database.
Statements executed count BETA
database/postgresql/statements_executed_count
The number of statements that are executed in each instance per operation such as SELECT, UPDATE, INSERT, DELETE, MERGE, UTILITY, NOTHING, and UNKNOWN. Only available for instances with Query Insights enabled.
Transaction count GA
database/postgresql/transaction_count
The number of committed and rolled-back transactions that have occurred in the instance.
Block read count BETA
  • instance/postgresql/blks_hit
  • instance/postgresql/blks_read
The number of blocks read in the instance from the disk and from the buffer cache.
Deadlock count per database BETA
database/postgresql/deadlock_count_for_top_databases
The number of deadlocks in the instance per database.
Read pool replication lag GA
instance/postgres/replication/maximum_lag
The maximum time taken for replication from a primary instance to a read pool. The time lag is calculated across all serving read pool nodes per read pool instance in the cluster.

Read pool dashboard metrics

Display name and metric nameDescription
Query latency BETA
database/postgresql/insights/aggregate/latencies
The aggregated P99, P95, and P50 query latency distribution. Only available for instances with Query Insights enabled.
Database load BETA
database/postgresql/insights/aggregate/execution_time
The accumulated query execution time per database, user, or client address across all serving nodes of the instance. This is the sum of CPU time, I/O wait time, lock wait time, process context switch, and scheduling for all processes involved in query execution. Only available for instances with Query Insights enabled.
CPU utilization GA
  • instance/cpu/maximum_utilization
  • instance/cpu/average_utilization
  • Maximum CPU Utilization: The maximum CPU utilization calculated across all serving nodes of the instance, represented as a percentage for instance.
  • Mean CPU Utilization: The mean CPU utilization calculated as an average across all serving nodes of the instance, represented as a percentage for instance.
Minimum available memory BETA
instance/memory/min_available_memory
The minimum available memory across all serving nodes of the instance. The available memory is an estimate of memory in bytes available for allocation on the VM including memory that is currently used, but can be potentially freed.
Connections by status BETA
instance/postgresql/backends_by_state
The number of connections across all serving nodes of the read pool instance grouped by the following statuses: idle, active, idle_in_transaction, idle_in_transaction_aborted, disabled, and fastpath_function_call. For information about these statuses, see the state text row in the pg_stat_activity documentation.
Connections per database BETA
database/postgresql/backends_for_top_databases
The number of connections per database across all serving nodes of the read pool instance.
Connections per application BETA
instance/postgresql/backends_for_top_applications
The number of connections per application name across all serving nodes of the read pool instance. Connections without an application name are grouped as Unknown.
Rows fetched vs. rows returned BETA
  • instance/postgresql/fetched_tuples_count
  • instance/postgresql/returned_tuples_count
  • Rows fetched: The number of rows fetched as a result of queries across all serving nodes of the read pool instance.
  • Rows returned: The number of rows scanned while processing the queries across all serving nodes of the read pool instance.
  • If the difference between rows returned and rows fetched is too large that their values aren't shown in the same scale, then the value of rows fetched is shown as 0 because it's negligible compared to the value of rows returned.
Oldest transaction age BETA
postgresql/vacuum/oldest_transaction_age
The current age of the oldest uncommitted transaction that's blocking the vacuum operation. It's measured in the number of transactions that started after the oldest transaction.
Transaction ID utilization BETA
postgresql/vacuum/transaction_id_utilization
The current percentage of transaction ID space that is consumed by the instance. It records up to a maximum of two billion unvacuumed transactions as a percentage.
Wait time BETA
instance/postgresql/wait_time
The aggregated accumulated elapsed wait time per wait event name and wait event type across all serving nodes of the read pool instance.
Wait count BETA
instance/postgresql/wait_count
The number of times processes waited per wait event name and wait event type across all serving nodes of the read pool instance.
Temp data size used per database BETA
database/postgresql/temp_bytes_written_for_top_databases
The amount of data (bytes) used in each database across all serving nodes of the read pool instance for executing queries and performing algorithms such as join and sort.
Temp files used per database BETA
database/postgresql/temp_files_written_for_top_databases
The number of temporary files that are used in each database across all serving nodes of the read pool instance for executing queries and performing algorithms such as join and sort.
New connection count per database BETA
database/postgresql/new_connections_for_top_databases
The number of new connections that are added per database to the serving nodes of the read pool instance.
Statements executed count BETA
database/postgresql/statements_executed_count
The number of statements that are executed in the serving nodes of the read pool instance per operation such as SELECT, UPDATE, INSERT, DELETE, MERGE, UTILITY, NOTHING, and UNKNOWN. Only available for instances with Query Insights enabled.
Transaction count GA
database/postgresql/transaction_count
The number of committed and rolledback transactions across all the serving nodes of the read pool instance.
Block read count BETA
  • instance/postgresql/blks_hit
  • instance/postgresql/blks_read
The number of blocks read from the disk and from the buffer cache across all the serving nodes of the read pool instance.
Deadlock count per database BETA
database/postgresql/deadlock_count_for_top_databases
The number of deadlocks across all the serving nodes of the read pool instance.
Read pool replication lag GA
instance/postgres/replication/maximum_lag
The maximum time taken for replication from a primary instance to a read pool. The time lag is calculated across all serving read pool nodes in the read pool instance.
Nodes and replication status GA
instance/postgres/replication/replicas
The number of read nodes connected to the primary instance per read pool along with one of the following states: startup, catchup, streaming, backup, and stopping.
Active nodes BETA
instance/postgres/instances
The number of nodes that can serve user traffic in the read pool instance.

Additionally, the Cloud Logging metric, Log entries by severity (logging.googleapis.com/log_entry_count), shows the total numbers of error and warning log entries per instance. These are extracted from postgres.log, which is the database log, and pgaudit.log, which contains data access information.

For more information, see AlloyDB metrics.

Events timeline

The dashboard provides details about the following events. System events appear in Events timeline within approximately 5 minutes after the event occurs.

Event name Description Operation type
Instance create Creates an AlloyDB instance. INSTANCE_CREATE
Instance update Updates an AlloyDB instance. INSTANCE_UPDATE
Instance restart Restarts the AlloyDB instance. INSTANCE_RESTART
Instance failover Initiates a manual failover of a highly available primary instance for a standby instance to become the primary instance. INSTANCE_FAILOVER
Cluster maintenance Indicates that the cluster is currently in maintenance, and the instances become unavailable for a few minutes. MAINTENANCE
Backup create Creates a backup of an AlloyDB instance. BACKUP_CREATE
Backup update Updates a backup of an AlloyDB instance. BACKUP_UPDATE
Cluster create Creates an AlloyDB cluster. CLUSTER_CREATE
Cluster update Update an AlloyDB cluster. CLUSTER_UPDATE
Cluster promote Promotes a secondary cluster to primary cluster. CLUSTER_PROMOTE
User create Creates a new user. USER_CREATE
User update Update a user. USER_UPDATE
User delete Deletes a user. USER_DELETE

Monitor an instance by using the Cloud Monitoring dashboard

Cloud Monitoring offers predefined dashboards for several Google Cloud products. You can also create your own custom dashboards to display data that is of interest to you and to monitor the general health of your primary and read pool instances.

Set up alerts

You can use Cloud Monitoring to set up alerts for a project or a specified instance.

For example, you can set up an alert for a message to be sent to specific email IDs when the Memory usage metric for a AlloyDB instance exceeds the threshold of 80%.

Monitor an instance using AlloyDB active queries

This page describes how to monitor and troubleshoot the queries that are active in your database. Active queries are long-running queries on your database that can affect performance. Monitoring these queries can help identify causes of system latency and high CPU usage.

You can view active queries on the Query insights dashboard. These queries are displayed by the transaction start time. If there is a large number of queries running, the results may be limited to a subset of total queries due to the memory constraints the system enforces on the data collection.

View active queries

To view your active queries, do the following:

  1. Create a custom role and add the databaseinsights.monitoringViewer Identity and Access Management (IAM) permission.

  2. Add this role for each user that is viewing active queries.

  3. In the Google Cloud console, open the AlloyDB page.

    Go to AlloyDB

  4. Click the name of a cluster to open its Overview page.

  5. Select the Query insights tab. The Query insights dashboard shows details about the selected cluster.

  6. Click the Active query view tab. The tab contains a summary of active queries running along with the top 50 longest running transactions.

    You can filter the information by either of the following:

    • Database: filters query load on a specific database or all databases.
    • User: filters query load from a specific database user or all of the users.

    Summary scorecard of all normalized active queries: provides an overview of all the active queries by displaying the total connections based on the following parameters:

    • Distribution of active connections categorized by connection state.
    • Distribution of active connections based on different wait event types.
    • Distribution of transaction durations for queries that are not in an idle state.

    Longest running transactions: provides an overview of the top 50 running queries in the active and idle in transaction state based on descending execution time.

You can view a list of top fifty normalized active queries on the Query insights dashboard.

A normalized active query removes sensitive data and returns a digest. The digest is the same for different values used in the following example:

  • Regular queries

    • select * from test_table where id=1;
    • select * from test_table_where id=2;
  • Digest or normalized query

    • select * from test_table where id=?;

A query that runs in different sessions is displayed as different entries on the dashboard.

View top longest running transactions

The following table describes the columns of the Longest running transactions table on the Query insights dashboard:

Column name Description
Process ID Process ID is the unique identifier of the database connection.
Query Normalized SQL query text.
Status The current status of the connection. Status values include active and idle in transaction.
Session duration The duration of current session (in seconds).
Transaction duration The duration of current transaction (in seconds).
Query duration The duration of current active Query (in seconds). Query duration of queries in the idle in transaction state are 0 as they are not actively running.
Wait event type The currently occurring wait event type during query execution.
Wait event The currently occurring wait event during query execution.
Database Database name on which this connection is running.
Application name Application name on which this connection is running.
User name Name of the database user connected to the database.
Client address Specific IP address of the client that sent a query.
Action Contains a link for terminating a transaction.

The display is refreshed every 60 seconds automatically.

Terminate a query or transaction

To terminate a query or a transaction, you must have the databaseinsights.operationsAdmin role. For more information, see IAM basic and predefined roles reference.

A transaction can contain multiple queries. To identify which of the queries are active at the moment, see the Query column in the Longest running transaction table.

To terminate a query or transaction, complete the following steps:

  1. Select the query in the Longest running transaction table.
  2. Scroll right to the Action column.
  3. Click Terminate connection.
  4. In the Terminate connection window, click Confirm.

    The page refreshes after initiating termination. If termination fails, it is silent and the query continues showing up in the Active Query list. If termination is successful, the query no longer displays in the list.

View metrics on the AlloyDB cluster Overview page

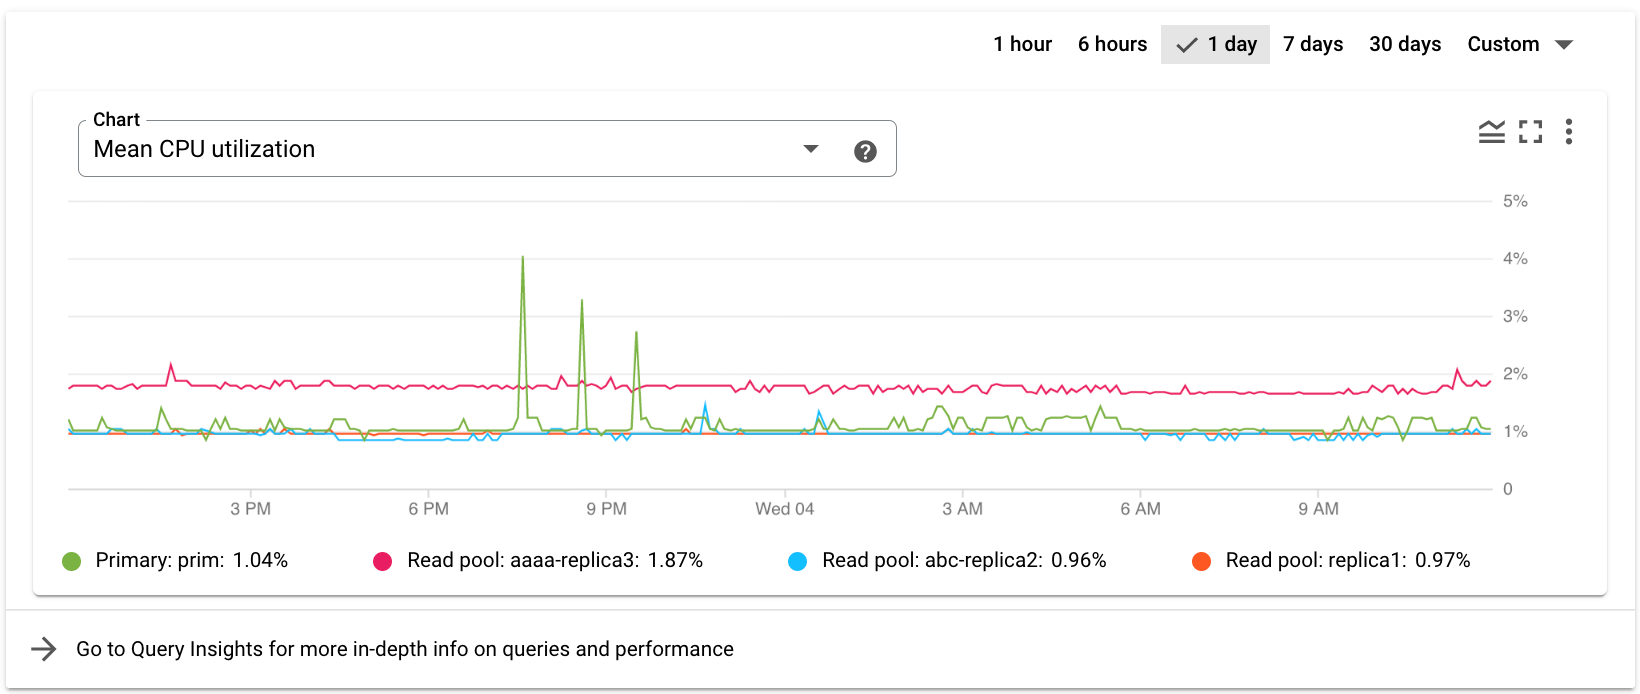
In the cluster Overview page, the default metrics chart appears at the top of the page.

Shows the default monitoring chart on the Overview page.

Select another metric from the Chart drop-down list. The chart shows the data for the selected metric.

What's next