This page describes how you can use the Cloud SQL System insights dashboard. The System insights dashboard displays metrics for the resources that your instance uses and helps you detect and analyze system performance problems.
You can use Gemini in Databases assistance to help you observe and troubleshoot your Cloud SQL for PostgreSQL resources. For more information, see Observe and troubleshoot with Gemini assistance.View the System insights dashboard
To view the System insights dashboard, do the following:
-
In the Google Cloud console, go to the Cloud SQL Instances page.
- Click the name of an instance.
Select the System insights tab from the SQL navigation panel on the left.
The System insights dashboard opens.


The System insights dashboard shows the following information:
Your instance details
Events timeline: shows the system events, in a chronological order. This information helps you evaluate the impact of system events on the health and performance of the instance.
Summary cards: provide an overview of the instance health and performance by displaying the latest and aggregated values for the CPU utilization, disk utilization, and log errors metrics.
Metrics charts: show the information about the operating system and database metrics that help you gain insight into several issues, such as throughput, latency, and cost.
The dashboard offers the following high-level options:
- To view either one or two charts per row. Click Customize view to choose how these charts are displayed. You can also use this option to choose the metrics you want to display on the dashboard.
To keep the dashboard up to date, enable the
 Auto Refresh option. When you enable Auto Refresh, the dashboard data
updates every minute. This feature isn't compatible with customized time
periods.
Auto Refresh option. When you enable Auto Refresh, the dashboard data
updates every minute. This feature isn't compatible with customized time
periods.The time selector shows
1 dayselected by default. To change the period, select one of the other predefined periods or click Custom and define a start and end time. Data is available for the last 30 days.To create an absolute link to the dashboard, click the Copy Link button. You can share this link with other Cloud SQL users who have the same permissions.
To create an alert for a specific event, click Notification.
To display specific alerts, click Annotations.
Summary cards
The following table describes the summary cards displayed at the top of the System Insights dashboard. These cards provide a brief overview of the instance's health and performance during the chosen time period.
| Summary card | Description |
|---|---|
| CPU utilization - P99 | P50 | The P99 and P50 CPU utilization values over the selected period. |
| Peak connections | The ratio of the peak connections to the maximum connections for the selected period.
The peak connection count might be higher than the maximum count in case the
maximum count has recently changed, such as due to instance scaling or
manually changing the max_connections setting. |
| Transaction ID utilization | The latest transaction ID utilization value for the selected period. |
| Disk utilization | The latest disk utilization value. |
| Log errors | The number of errors that users log. |
Metrics charts
A chart card for a sample metric appears as follows.

The toolbar on each chart card provides the following set of standard options:
To view metric values for a specific moment in the selected period, move the cursor over the chart.
To zoom in on a chart, click the chart and drag horizontally along the x-axis or vertically along the y-axis. To revert the zoom operation, click Reset zoom. Or, click one of the predefined time periods at the top of the dashboard. Zoom operations apply at the same time to all charts on a dashboard.
To view additional options, click more_vert More chart options. Most charts offer these options:
To view a chart in full-screen mode, click View in full screen. To exit full-screen mode, click Cancel.
Hide or collapse the legend.
Download a PNG or CSV file of the chart.
View in Metrics Explorer. View the metric in Metrics Explorer. You can view other Cloud SQL metrics in the Metrics Explorer after selecting the Cloud SQL Database resource type.
To create a custom dashboard, click edit Customize dashboard and give it a name. Or, expand the Predefined menu and select an existing custom dashboard.
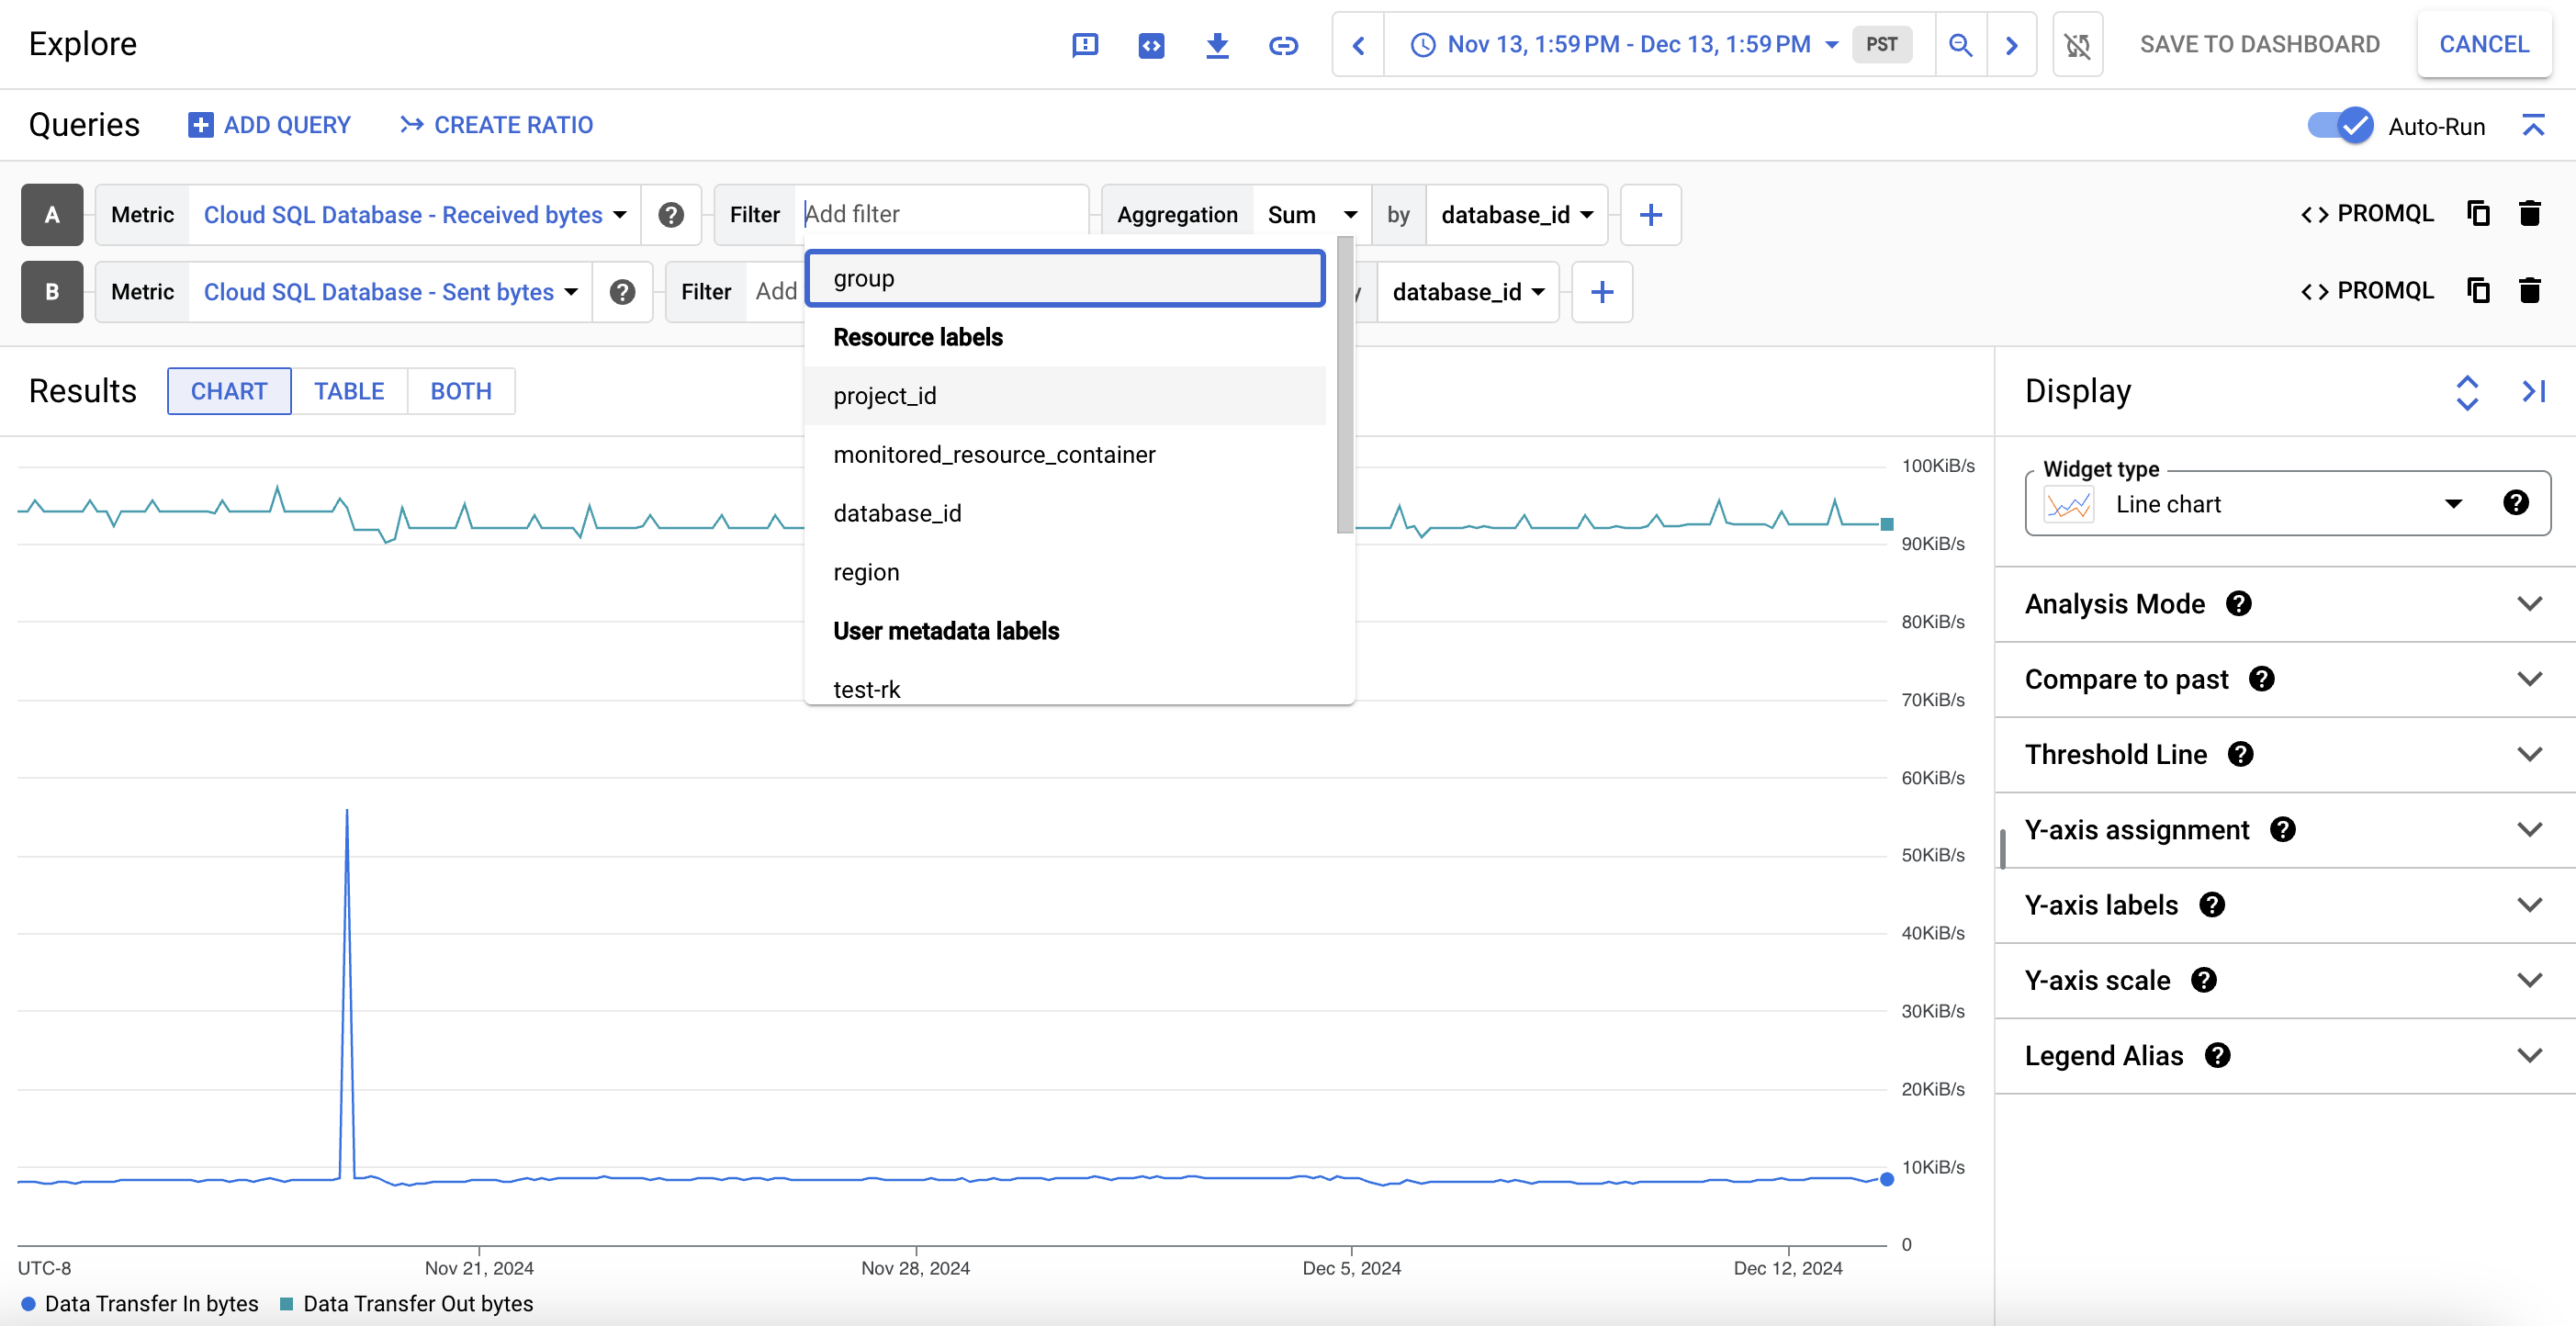
To view a metric chart's data in detail, click query_stats Explore data. Here, you can filter specific metrics and choose how the chart displays:
To save this customized view as a metric chart, click Save to dashboard.
Default metrics
The following table describes the Cloud SQL metrics that appear by default on the Cloud SQL System insights dashboard.
The metric type strings follow this prefix:
cloudsql.googleapis.com/database/.
For the latest launch stage availability of the following metrics, see Google Cloud metrics.
| Metric name and type | Description |
|---|---|
New connections per secondpostgresql/new_connection_count
|
The rate of the number of new connections that you create on your Cloud SQL for PostgreSQL instance, per second. Cloud SQL calculates and displays this metric per database. This metric is available for PostgreSQL version 14 and later. |
Wait event types
postgresql/backends_in_wait
|
The number of connections for each wait event type in a Cloud SQL for PostgreSQL instance. |
Wait eventspostgresql/backends_in_wait
|
The number of wait events in a Cloud SQL for PostgreSQL instance. The dashboard displays this metric as wait event name:wait event type. |
Transaction countpostgresql/transaction_count
|
The number of transactions in the |
Memory componentsmemory/components
|
The memory components available to the database. The value for each memory component is calculated as the percentage of the total memory available to the database. |
Max replica byte lagpostgresql/external_sync/max_replica_byte_lag
|
The maximum replication lag (in bytes) among all the databases on the external server (ES) replica. |
Query latencypostgresql/insights/aggregate/latencies |
The aggregated query latency distribution by P99, P95, and P50 per user and database. Only available for instances with query insights enabled. |
Database load per database/user/client addresspostgresql/insights/aggregate/execution_time |
The accumulated query execution time per database, user, or client address. This is the sum of CPU time, I/O wait time, lock wait time, process context switch, and scheduling for all processes involved in query execution. Only available for instances with query insights enabled. |
CPU utilizationcpu/utilization |
The current CPU utilization represented as a percentage of the reserved CPU that's currently in use. |
Disk storage by typedisk/bytes_used_by_data_type
|
The breakdown of instance disk usage by data types, including This metric helps you understand your storage costs. For more information about storage usage charges, see Storage and networking pricing. Point-in-time recovery (PITR) uses write-ahead log (WAL) archiving. These logs update regularly and use storage space. Write-ahead logs are automatically deleted with their associated automatic backup, which generally happens after about 7 days. If the size of your write-ahead logs is causing an issue for your instance, you can increase your storage size, but the write-ahead log size increase in disk usage might be temporary. To avoid unexpected storage issues, Google recommends enabling automatic storage increases when using PITR. To delete the logs and recover storage, you can disable point-in-time recovery. Note, however, that decreasing the storage used does not shrink the size of the storage provisioned for the instance. Temp data is included in the storage usage metric. Temp data is removed as part of maintenance and is allowed to increase beyond user-defined capacity limits to avoid a disk full event, at no charge to the user. A newly created database uses about 100 MB for system tables and files. |
Disk storage by typedisk/bytes_used_by_data_type
|
The breakdown of instance disk usage by data types, including This metric helps you understand your storage costs. For more information about storage usage charges, see Storage and networking pricing. Point-in-time recovery uses write-ahead logging (WAL) archiving. For new Cloud SQL instances that have point-in-time recovery enabled or for existing instances that enable point-in-time recovery after this feature for storing WAL logs in Cloud Storage is available, logs will no longer be stored on disk; instead they'll be stored in Cloud Storage in the same region as the instances. To see whether an
instance's logs are stored in Cloud Storage, check the bytes_used_by_data_type metric for the instance. If the
value for the All other existing instances that have point-in-time recovery enabled continue to have their logs stored on disk. The change to storing logs in Cloud Storage will be made available at a later time. The write-ahead logs used in point-in-time recovery are deleted automatically with their associated automatic backup, which generally happens after the value set for transactionLogRetentionDays is met. This is the number of days of transaction logs that Cloud SQL retains for point-in-time recovery, from 1 to 7. For instances that have write-ahead logs stored in Cloud Storage, the logs are stored in the same region as the primary instance. This log storage (up to seven days, the maximum length for point-in-time recovery) generates no additional cost per instance. If your instance has point-in-time recovery enabled, and if the size of your write-ahead logs on disk is causing an issue for your instance, then disable point-in-time recovery and re-enable it to ensure that new logs are stored in Cloud Storage in the same region as the instance. This deletes existing write-ahead logs, so you can't perform a point-in-time restore earlier than the time that you re-enabled point-in-time recovery. However, although the existing logs are deleted, the disk size remains the same. To avoid unexpected storage issues, we recommend enabling automatic storage increases for all instances when using point-in-time recovery. This recommendation applies only if your instance has point-in-time recovery enabled and your logs are stored on disk. To delete the logs and recover storage, you can disable point-in-time recovery. Note, however, that decreasing the write-ahead logs used doesn't shrink the size of the disk provisioned for the instance. Temp data is included in the storage usage metric. Temp data is removed as part of maintenance and is allowed to increase beyond user-defined capacity limits to avoid a disk full event, at no charge to the user. A newly created database uses about 100 MB for system tables and files. |
Disk read/write opsdisk/read_ops_count, disk/write_ops_count |
The Number of Reads metric indicates the number of read operations served from disk that do not come from cache. You can use this metric to understand whether your instance is correctly sized for your environment. If needed, you can move to a larger machine type to serve more requests from cache and reduce latency. The Number of Writes metric indicates the number of write operations to disk. Write activity is generated even if your application is not active because Cloud SQL instances, barring replicas, write to a system table approximately every second. |
Connections by statuspostgresql/num_backends_by_state |
The number of connections grouped by these statuses: For information about these statuses,
see the |
Connections per databasepostgresql/num_backends |
The number of connections held by the database instance. |
Ingress/egress bytesnetwork/received_bytes_count, network/sent_bytes_count |
The network traffic in terms of the number of ingress bytes (bytes received) and egress bytes (bytes sent) to and from the instance, respectively. |
I/O wait breakdown by typepostgresql/insights/aggregate/io_time |
The breakdown of I/O wait time for SQL statements by read and write types. Only available for instances with query insights enabled. |
Deadlock count by databasepostgresql/deadlock_count |
The number of deadlocks per database. |
Block read countpostgresql/blocks_read_count |
The number of blocks read per second from the disk and from the buffer cache. |
Rows processed by operationpostgresql/tuples_processed_count |
The number of rows processed per operation per second. |
Rows in database by statepostgresql/tuple_size |
The number of rows for each database state. Cloud SQL reports this metric if the number of databases in the instance is less than 50. |
Oldest transaction by agepostgresql/vacuum/oldest_transaction_age |
The age of the oldest transaction that's blocking the vacuum operation. |
WAL archivingreplication/log_archive_success_count, replication/log_archive_failure_count |
The number of write-ahead log files that were successfully or unsuccessfully archived per minute. |
Transaction ID utilizationpostgresql/transaction_id_utilization |
The percentage of transaction IDs used in the instance. |
Connection count per application namepostgresql/num_backends_by_application |
The number of connections to the Cloud SQL instance, grouped by applications. |
Rows fetched vs. rows returned vs. rows written
|
If the difference between rows returned and rows fetched is so large that their values aren't shown in the same scale, then the value of rows fetched is shown as 0 because it's negligible compared to the value of rows returned. |
Temp data sizepostgresql/temp_bytes_written_count |
The total amount of data (in bytes) used for query execution and performing algorithms such as join and sort. |
Temp filespostgresql/temp_files_written_count |
The number of temporary files used for query execution and performing algorithms such as join and sort. |
Also, the Cloud Logging metric, Log entries by severity (logging.googleapis.com/log_entry_count),
shows the total numbers of error and warning log entries.
These are extracted
from postgres.log, which is the database log, and pgaudit.log,
which contains data access information.
For more information, see Cloud SQL metrics.
Events timeline
The dashboard provides the details of the following events:
| Event name | Description | Operation type |
|---|---|---|
Instance restart |
Restarts the Cloud SQL instance | RESTART |
Instance failover |
Initiates a manual failover of a high availability (HA) primary instance to a standby instance, which becomes the primary instance. | FAILOVER |
Instance maintenance |
Indicates that the instance is currently in maintenance. Maintenance typically causes the instance to be unavailable for 1 to 3 minutes. | MAINTENANCE |
Instance backup |
Performs an instance backup. | BACKUP_VOLUME |
Instance update |
Updates the settings of a Cloud SQL instance. | UPDATE |
Promote replica |
Promotes a Cloud SQL replica instance. | PROMOTE_REPLICA |
Start replica |
Starts replication on a Cloud SQL read replica instance. | START_REPLICA |
Stop replica |
Stops replication on a Cloud SQL read replica instance. | STOP_REPLICA |
Recreate replica |
Recreates resources for a Cloud SQL replica instance. | RECREATE_REPLICA |
Create replica |
Creates a Cloud SQL replica instance. | CREATE_REPLICA |
Data import |
Imports data into a Cloud SQL instance. | IMPORT |
Instance export |
Exports data from a Cloud SQL instance to a Cloud Storage bucket. | EXPORT |
Restore backup |
Restores a backup of a Cloud SQL instance. This operation might cause your instance to restart. | RESTORE_VOLUME |