このページでは、地図表示を使用して複数地域のパフォーマンスを計画する場合の一般的なユースケースを紹介します。パフォーマンス ダッシュボードを使用すると、 Google Cloud ネットワーク全体のレイテンシとパケットロス、およびプロジェクト リソースのパフォーマンスを可視化できます。パフォーマンス ダッシュボードの地図機能を使用すると、特定の場所のレイテンシを詳しく確認し、地図上で地理的位置を特定できます。
地図表示は、[トラフィックの種類] が [インターネットへ] に設定されている場合にのみ使用できます。地図表示には、ハイブリッド トラフィックを除き、インターネット エンドポイントへのラウンドトリップ時間(RTT)の中央値が表示されます。詳細については、レイテンシ ビューをご覧ください。
シナリオ: 都市から Google Cloud リージョンへのレイテンシを調べる
地図表示の一般的な使用例は、1 つの都市から 1 つのGoogle Cloud リージョンまでのレイテンシを確認することです。たとえば、ある Google Cloud リージョンでアプリケーションをホストし、さまざまな地域からユーザーがアプリケーションにアクセスしようとしたときに発生するレイテンシの範囲を把握する必要があるとします。
選択した地理的エリアと Google Cloudリージョンの間の RTT 中央値を表示するには、[パフォーマンス ダッシュボード] ページで [表示オプション] タブを選択し、[インターネットへ] を選択します。デフォルトでは、レイテンシ(RTT)指標が選択されています。
レイテンシの概要を、次の 3 つの方法で確認できます。
- テーブル
- マップ
- タイムライン
地図表示を選択すると、選択した地理的エリアと Google Cloud リージョンの間の RTT 中央値を示す世界地図が表示されます。これらのビューの使用方法の詳細については、 Google Cloud リージョンとインターネット エンドポイントの間のトラフィックに関するプロジェクト固有のレイテンシ データを表示するをご覧ください。
地図表示では、次のことができます。
- 地理的位置のレイテンシの中央値の詳細を表示するには、地図上の地理的位置にカーソルを合わせます。
- ある Google Cloud リージョンと地理的位置の間のレイテンシの中央値を表示するには、その Google Cloud リージョンをクリックします。地図が更新され、選択したリージョンでのトラフィックがある場所が表示されます。
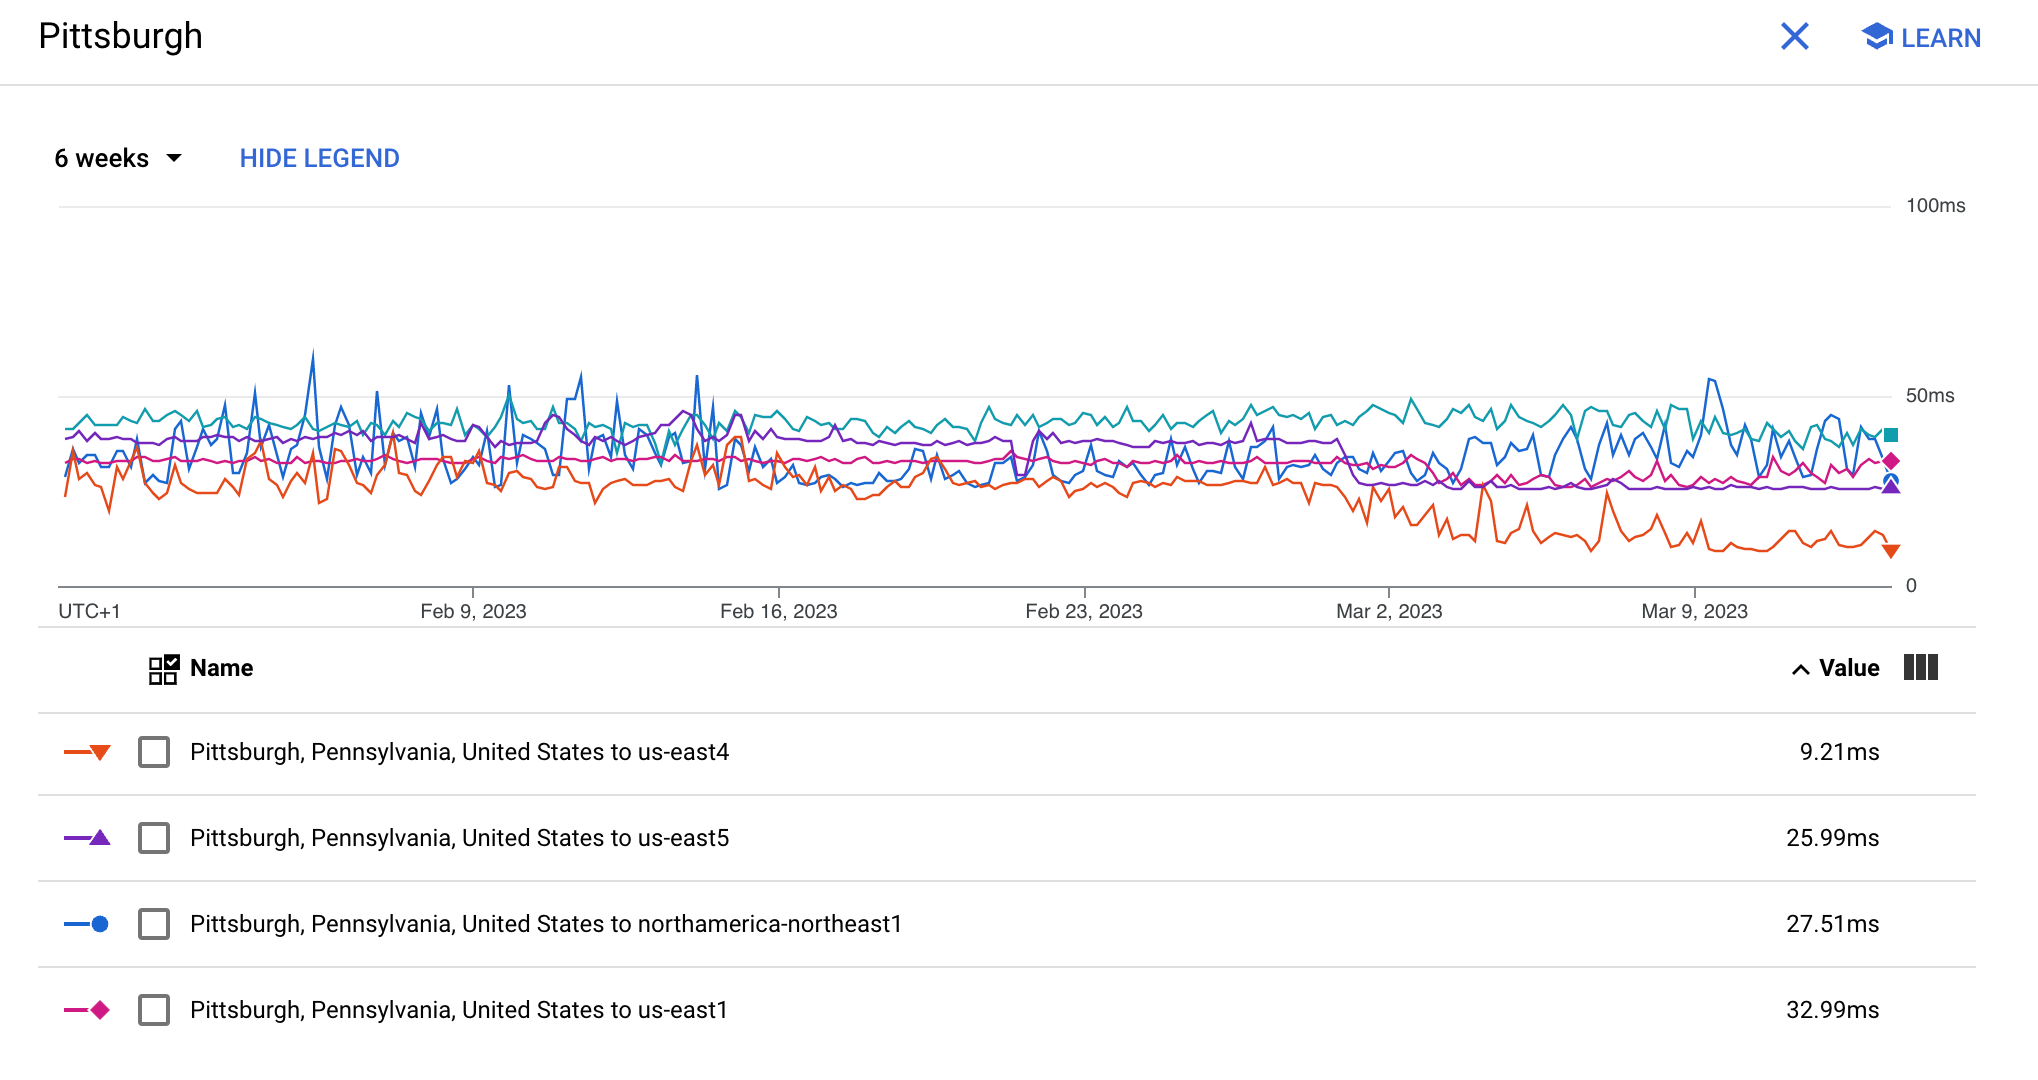
- 1 時間から 6 週間までのレイテンシを表示するには、選択したロケーションの [タイムラインを表示] をクリックして、間隔を選択します。
- 特定のリージョンのレイテンシの詳細を表示するには、リージョンを選択し、都市の上にポインタを置いて [タイムラインを表示] をクリックします。タイムラインの線は、そのトラフィック パスのレイテンシを示します。トラフィック パスは、選択した Google Cloud リージョンとインターネット ロケーションが宛先に到達するためにたどるルートです。
- ある期間のレイテンシの詳細を表示するには、地理的位置をクリックします。ロケーションの詳細がサイドバー パネルのタイムライン ビューに表示されます。ここには、選択したロケーションから VM インスタンスを含むリージョンへのトラフィックが表示されます。
リージョンとエンドポイントは、次の表に示すアイコンで表されます。
| アイコン | 説明 |
|---|---|
| 選択されていない Google Cloud リージョンを表します。 | |
| 選択されている Google Cloud リージョンを表します。 | |
| 都市を表します。世界地図上の都市を示す円の色は、その都市における特定の Google Cloud リージョンからのレイテンシを示します。青色が明るいほど、レイテンシは短くなります。 |
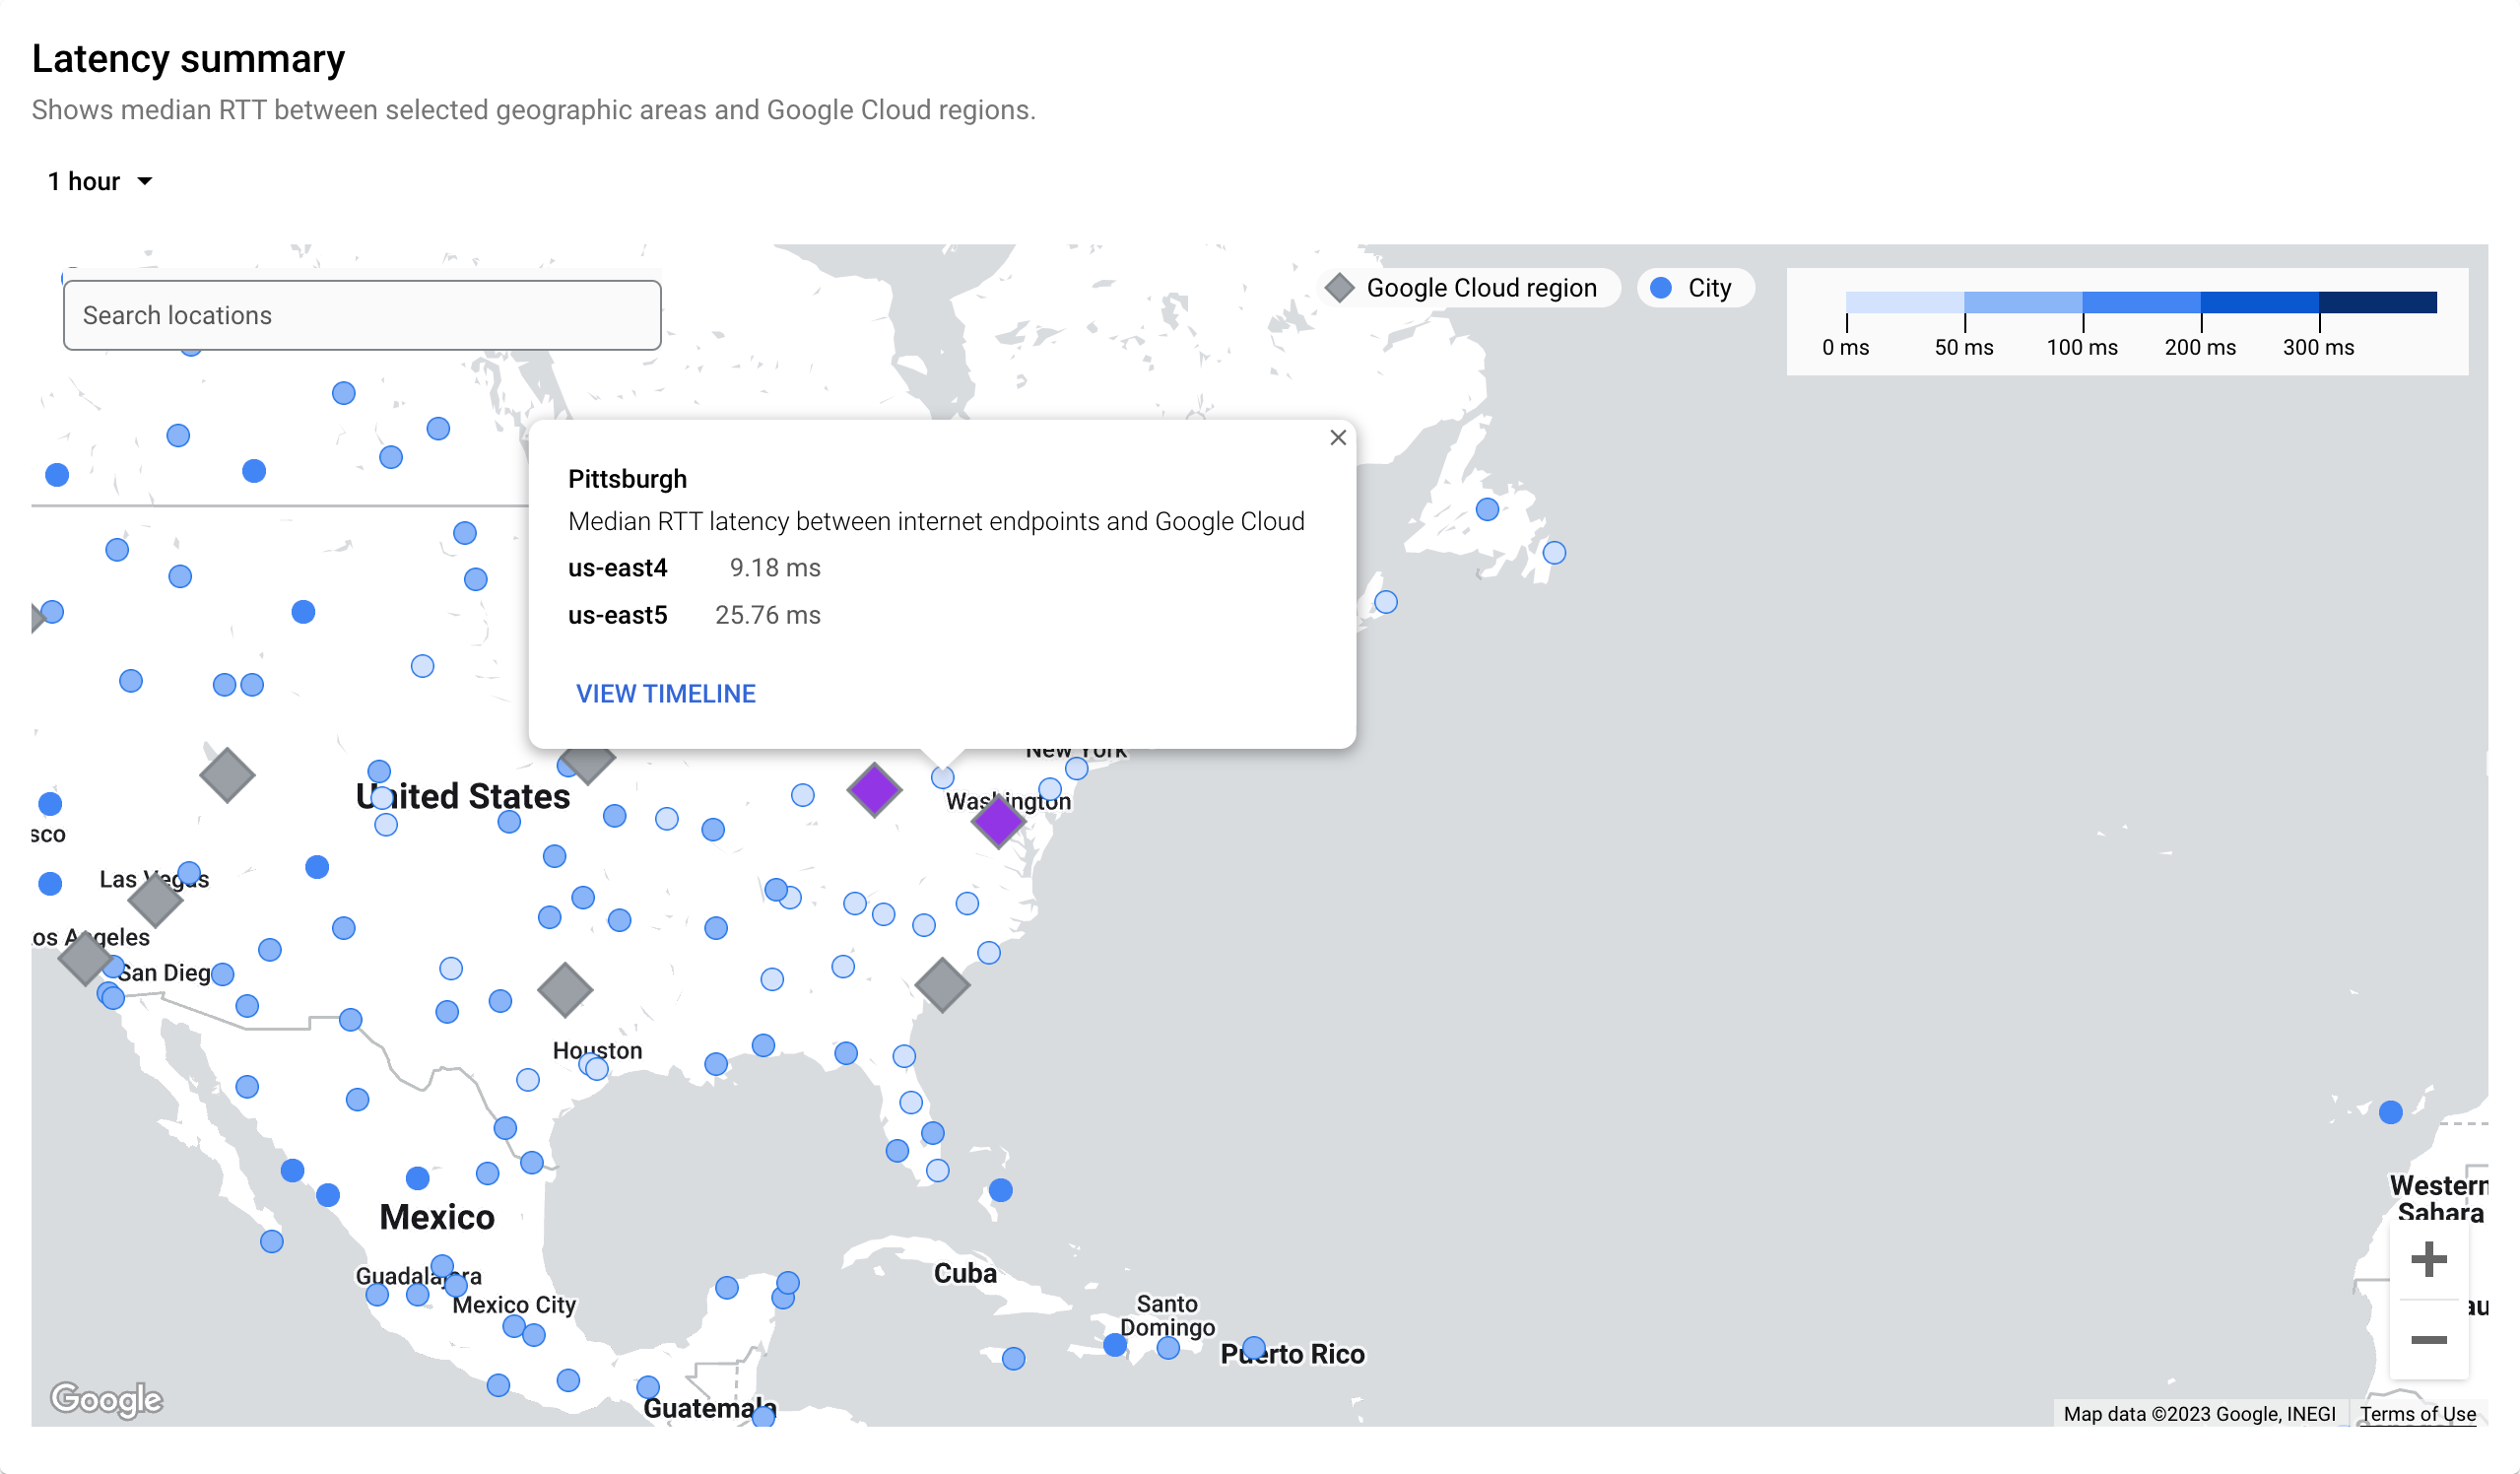
次の例は、ロケーション Pittsburgh、リージョン us-east4、us-east5 のレイテンシの概要を示しています。この地図では、us-east4 と Pittsburgh の間のレイテンシは 9.18 ミリ秒、Pittsburgh と us-east5 の間のレイテンシは 25.76 ミリ秒であることがわかります。
このデータを参考にすると、Pittsburgh のエンドユーザーのレイテンシが短いので今後のワークロードを us-east4 にデプロイまたは移動するよう決定できる可能性があります。
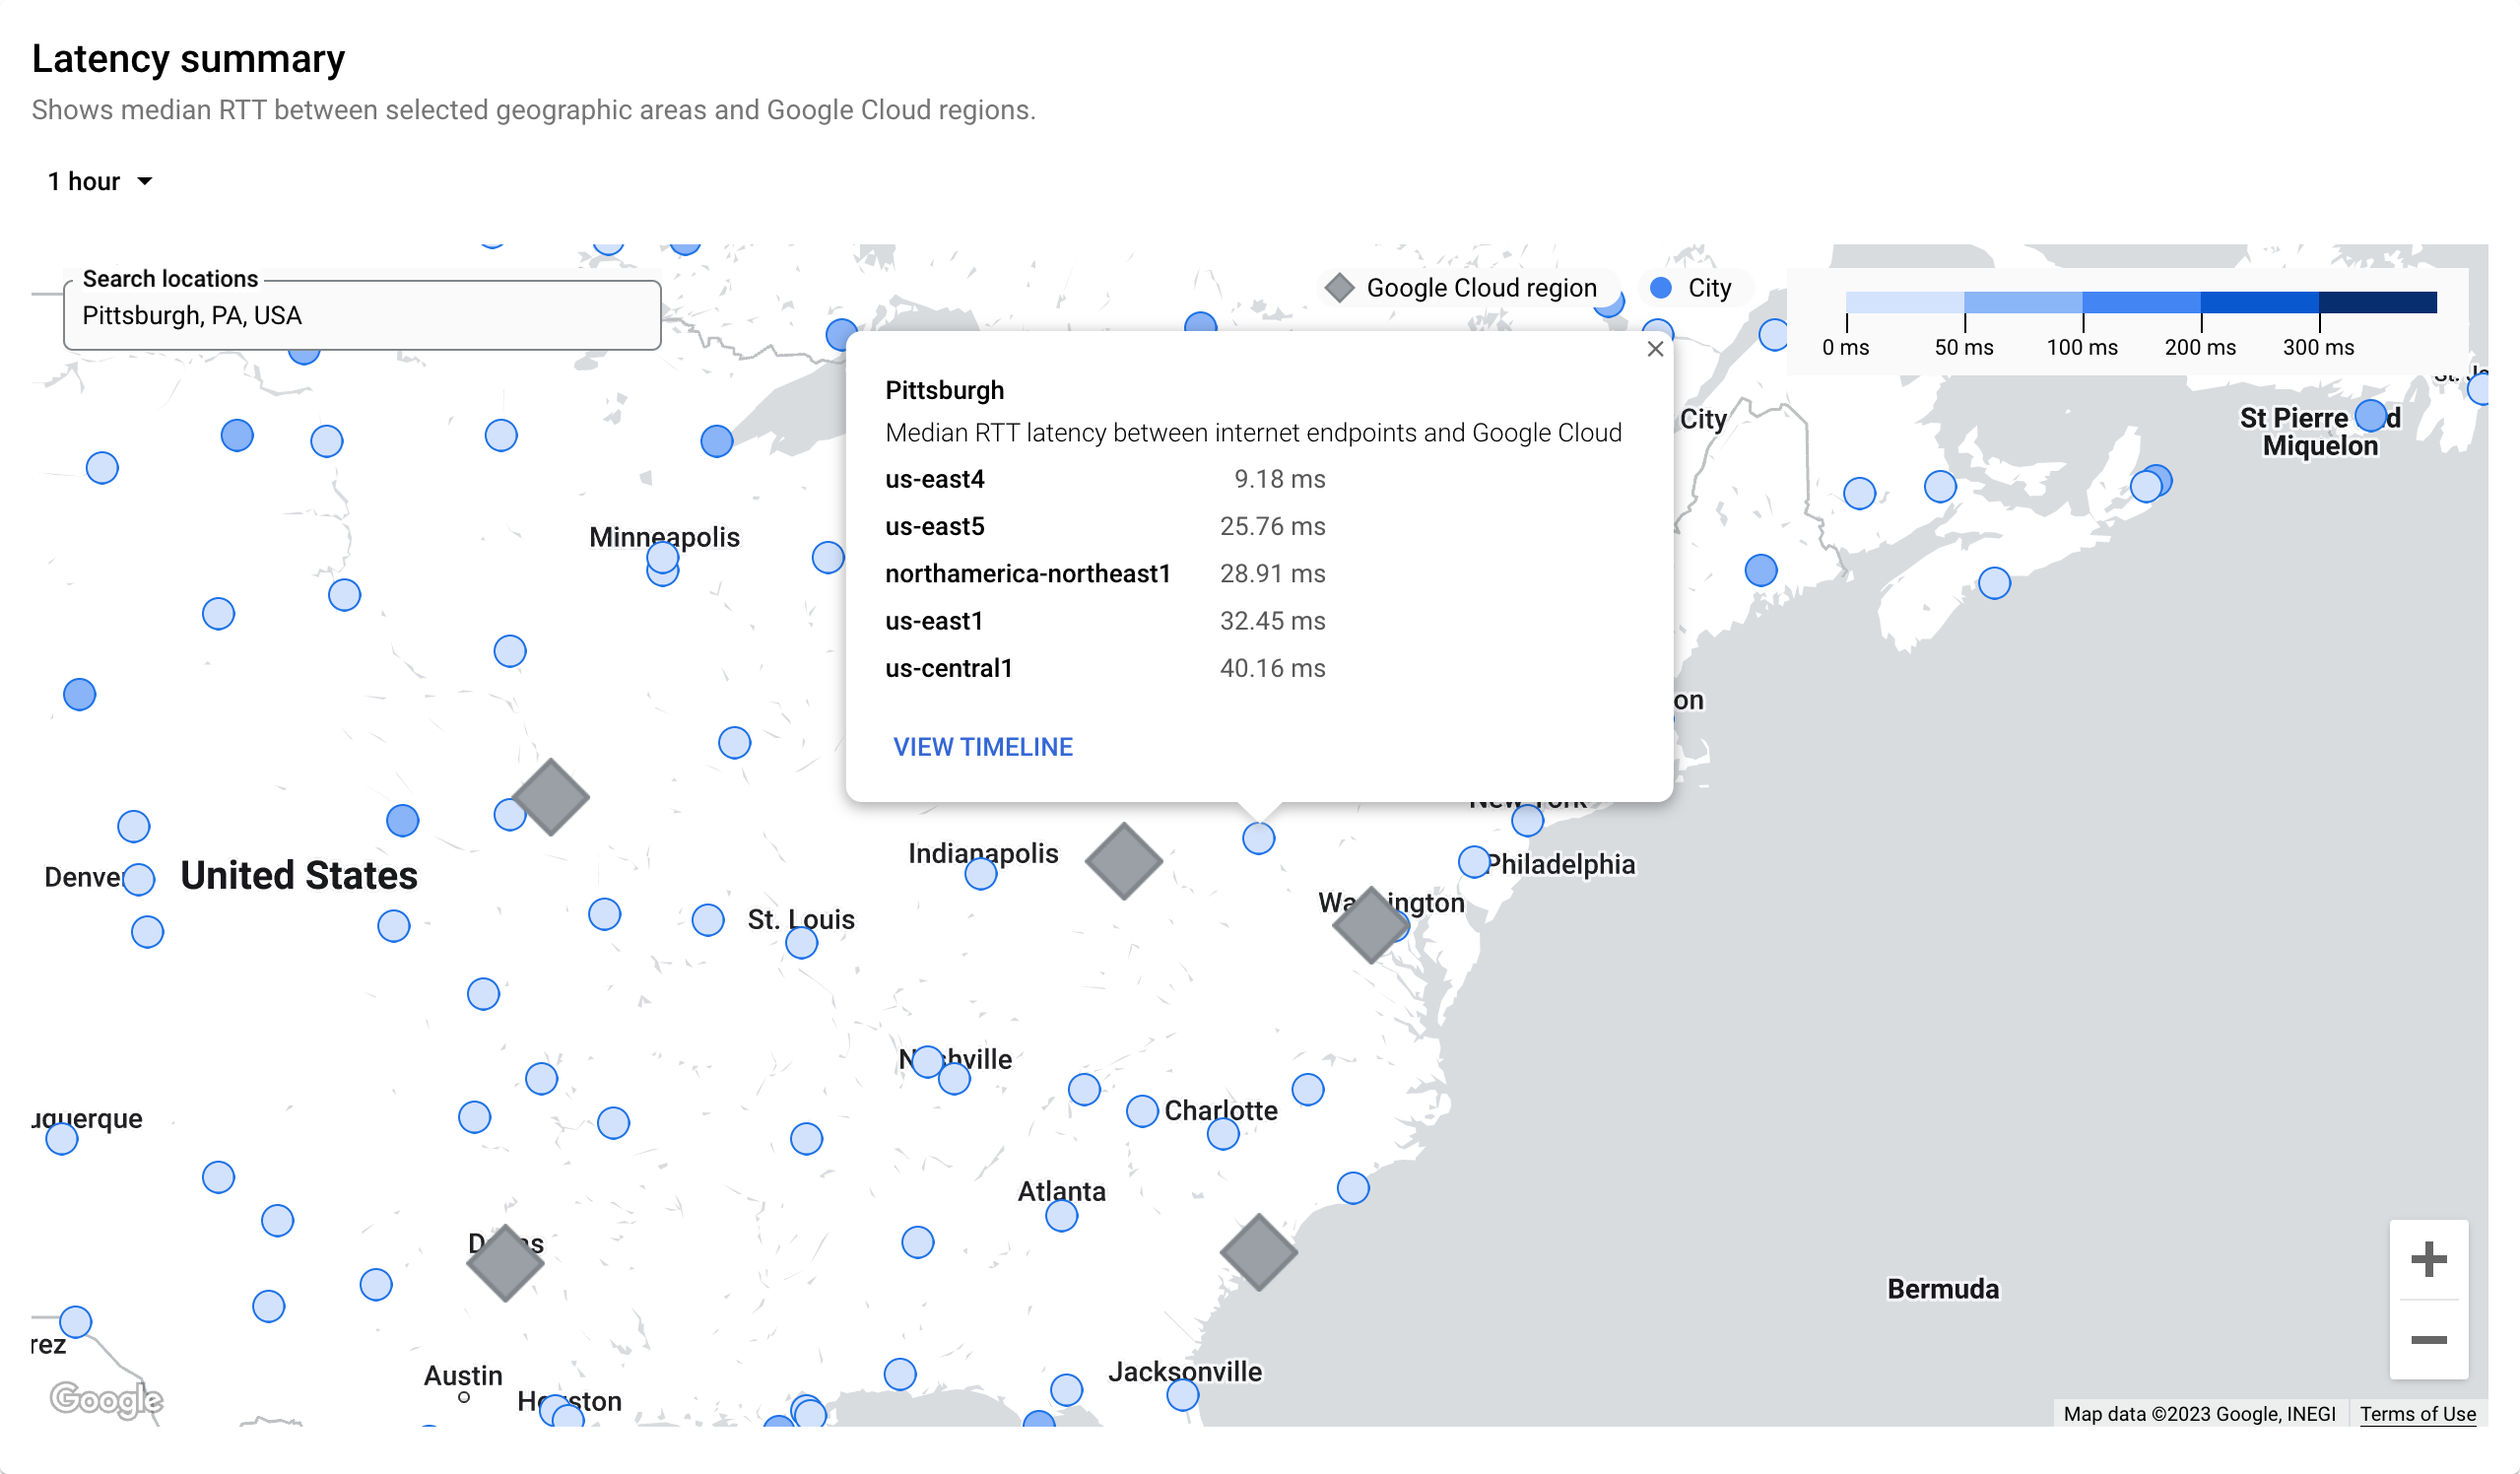
シナリオ: ある都市からのレイテンシが特に低い近隣の Google Cloud リージョンを特定する
大部分のユーザーがピッツバーグからアプリケーションにアクセスしているとします。この状況でエンドユーザーのレイテンシを最小限に抑える方法について考えてみましょう。
次の図は、ピッツバーグに近くレイテンシが特に低い Google Cloud リージョンを示しています。このリストは、ピッツバーグを検索すると表示されます。このリストは、レイテンシが最も低く、デプロイを最適化できるリージョンを選択する際に役立ちます。この例では us-east4 です。特定の期間のレイテンシ グラフを表示するには、[タイムラインを表示] をクリックします。
[パフォーマンス ダッシュボード] ページでレイテンシ情報を表示するには、 Google Cloud プロジェクトでは [プロジェクト] を、Google Cloud プロジェクト以外の場合は [Google Cloud] をクリックします。
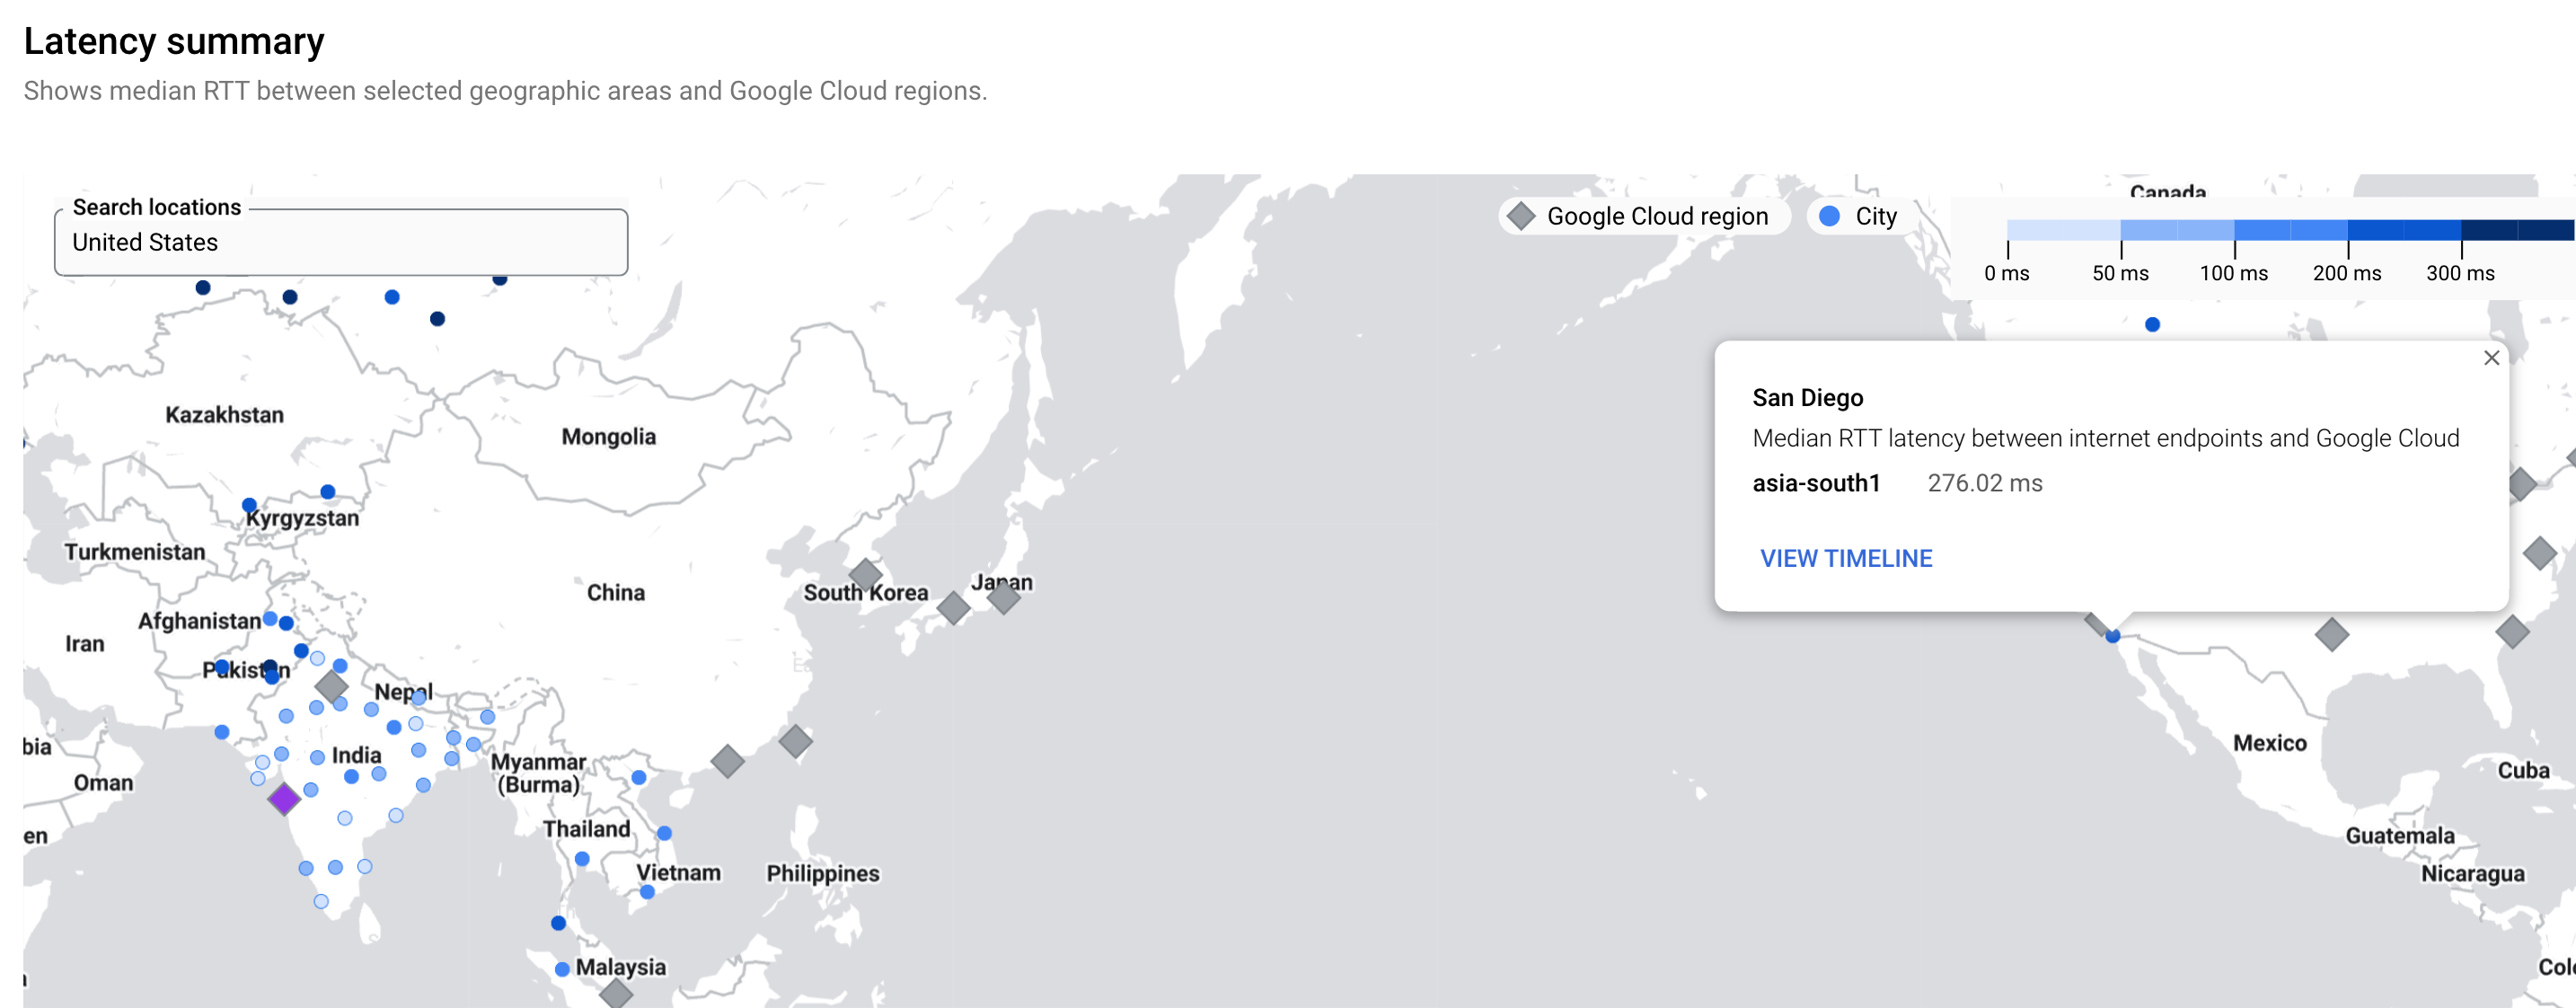
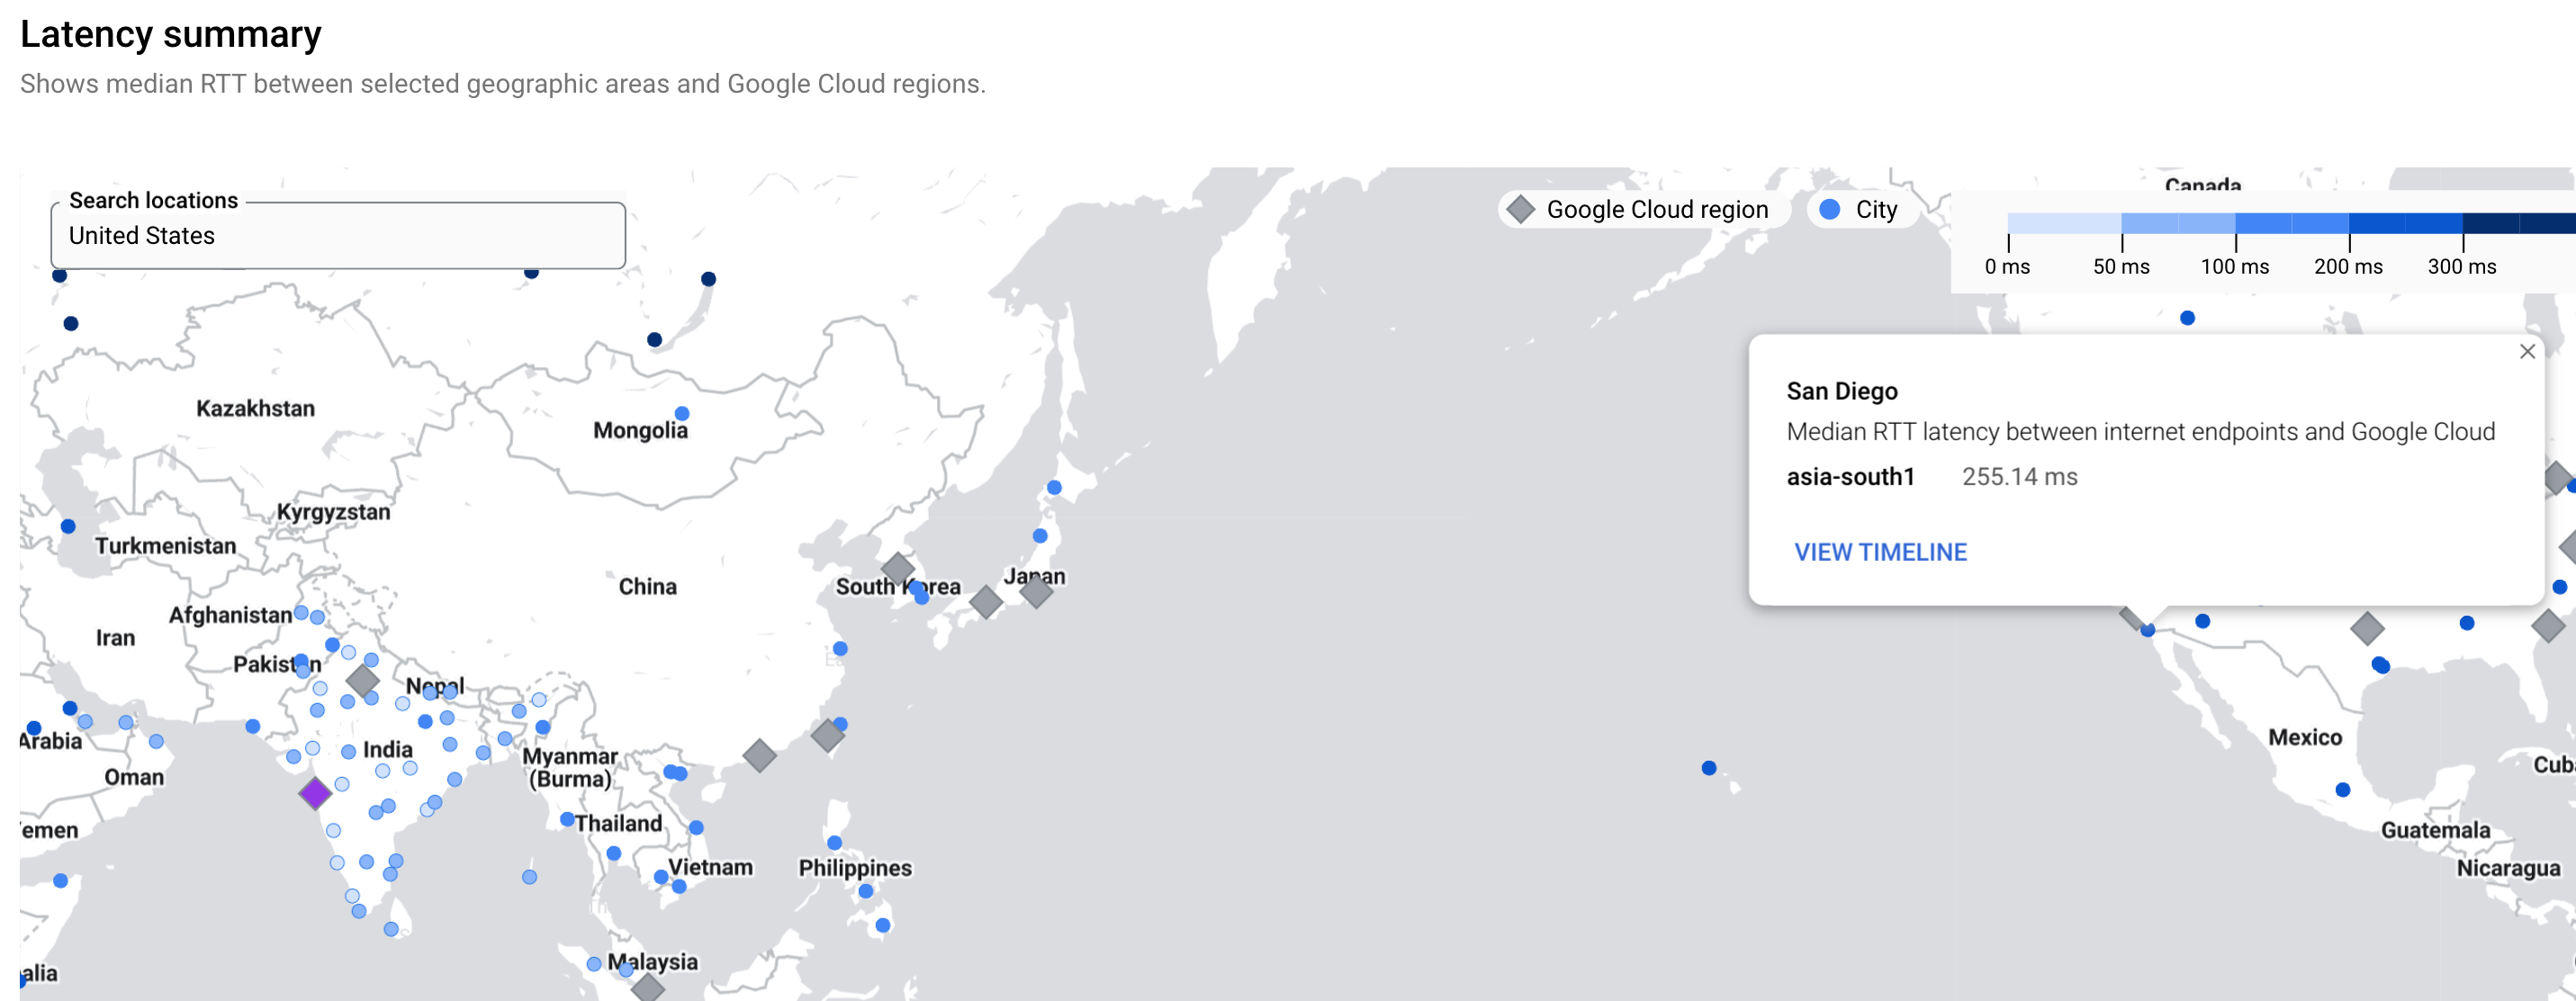
シナリオ: ある都市からある Google Cloud リージョンまでのレイテンシをスタンダード ティアとプレミアム ティアで比較する
都市から Google Cloudリージョンへのレイテンシ数値を、ネットワーク階層(スタンダード ティアとプレミアム ティア)で比較してみましょう。
パフォーマンス ダッシュボードで、次のオプションを選択してネットワーク階層を定義します。
- すべての階層のデータを表示: プロジェクトは 1 つの階層のみを使用します
- 選択した階層のデータのみを表示: トラフィック タイプに [インターネットへ] が選択されている場合にのみ使用できます。ネットワーク階層には、スタンダードまたはプレミアムを選択できます。ネットワーク サービス階層の詳細については、ネットワーク階層をご覧ください。
次の画像では、asia-south1 リージョンのレイテンシがスタンダード ティアで 276.02 ミリ秒、プレミアム ティアで 255.14 ミリ秒になっています。
次のステップ
- プロジェクト パフォーマンスのユースケース
- パフォーマンス計画のユースケース
- プロジェクト固有のパケットロス ダッシュボードを表示する
- Google Cloud パケットロス ダッシュボードを表示する
- パフォーマンス ダッシュボードをトラブルシューティングする