This page describes the metrics used to determine the performance of your Google Cloud project's resources and the performance of the entire Google Cloud. You can also find details about the various views that show further details about these performance metrics.
Metrics
Performance Dashboard provides two kinds of metrics: packet loss and latency (round-trip time, or RTT). To get packet loss metrics for your Google Cloud project, you need a sufficient number of VMs in the project. To get latency metrics, you need a sufficient amount of traffic. Additionally, Performance Dashboard requires no setup.
The following sections describe both metrics in more detail.
Packet loss
Packet loss metrics show the results of active probing between the following:
VMs within a single VPC network.
VMs in peered VPC networks, when one or both networks are within your project. If the peered networks are in different projects, packet loss is visible in the destination project.
VMs in a Shared VPC network that is used by your project. Packet loss between two projects that use a Shared VPC network is visible in the destination service project.
For example, suppose project A includes two VPC networks: network A, which has VMs only in zone A, and network M, which has VMs only in zone M. If those two networks are peered, project A's Performance Dashboard shows the packet loss data for the A/M zone pair. If the networks are not peered, Performance Dashboard does not show the packet loss metric for that zone pair.
If these two networks are not in the same project, note when the Performance Dashboard of each network shows the metrics. That is, suppose network A is part of project A, and network M is part of project M. When the networks are peered, project M's Performance Dashboard shows packet loss data for situations where zone M is the destination zone. Conversely, when zone A is the destination zone, the packet loss data is visible only to project A. If the networks are not peered, neither project's Performance Dashboard shows packet loss data for the zone pair.
The data gathered through all the probes is aggregated in Performance Dashboard. That is, Performance Dashboard does not let you isolate data about intra-project packet loss versus other types (such as packet loss related to a peered VPC network in another project). However, you can use Monitoring to view more detailed results. For more information, see Performance Dashboard metrics reference.
Performance Dashboard does not send probes over Cloud VPN connections.
Methodology
Performance Dashboard runs workers on the physical hosts that house your VMs. These workers insert and receive probe packets that run on the same network as your traffic. Because the workers run on the physical hosts and not on your VMs, these workers don't consume VM resources, and the traffic is not visible on your VMs.
The probes cover the entire mesh of VMs that can communicate with each other, which is not necessarily the same as your traffic pattern. Therefore, you might see indications of packet loss in Performance Dashboard, but no evidence of packet loss in your application.
For all probed VMs, Google Cloud tries to access the VM both by using its internal IP address and external IP address (if one exists). The probes don't leave Google Cloud, but by using external IP addresses, Performance Dashboard can cover part of the path that is used by external traffic, such as traffic coming from the internet.
Packet loss for internal IP addresses is measured by using UDP packets, and packet loss for external IP addresses is measured by using TCP packets.
Metric availability and confidence levels
Performance Dashboard probes a subset of all VM-VM pairs in the network. The data gathered is then used to estimate the packet loss that you might experience. Google's confidence in the data depends on the probing rate, and the probing rate depends on the number of VMs that you have in each zone, as well as the number of zones where you have VMs deployed. For example, having 10 VMs in two zones generates more confidence than having 10 VMs in 10 zones.
All VMs, including those created by Google Kubernetes Engine (GKE), count toward the total number of VMs.
The varying levels of confidence are described in the following table. Lower
levels of confidence are flagged in the heatmap with an asterisk
(*) or N/A.
| Level | Required number of VMs in each zone | What Performance Dashboard shows on the heatmap |
|---|---|---|
| 95% confidence | 10 VMs multiplied by the number of zones in the project. For example, if you have 12 zones in your project, you must have 120 VMs in each zone. | A measurement without any additional notations |
| 90% confidence | 2.5 VMs multiplied by the number of zones in the project. For example, if you have 12 zones in your project, you must have 30 VMs in each zone. | A measurement without any additional notations |
| Low confidence | A measurement with an asterisk | |
| Not enough probes to have meaningful data | N/A |
The Google Cloud packet loss metrics are always available. An asterisk (*) is displayed if there are fewer than 400 probes per minute.
Project-specific latency
Latency metrics are measured by using customer traffic between the following:
- VMs within a single VPC network
- VMs between peered VPC networks, if the networks sit in the same project
- VMs and internet endpoints
Additionally, the Performance Dashboard for a service project within a Shared VPC network shows data only for the zones within the service project. That is, suppose a VM in zone A and service project A uses the host project to communicate with a VM in zone B and service project B. Measurements about that traffic are not available to either service project or the host project.
Google Cloud latency
Latency metrics are measured by using actual customer traffic between the following:
- VMs within a single VPC network
- VMs between peered VPC networks
- VMs and internet endpoints
Methodology for project and Google Cloud latency
Latency is measured by using TCP packets.
Based on a sample of your actual traffic, latency is calculated as the time that
elapses between sending a TCP sequence number (SEQ) and receiving a
corresponding ACK that contains the network RTT and TCP stack-related delay. The
dashboard shows latency as the median of all relevant measurements.
The latency metric is based on the same data source and sampling methodology as VPC Flow Logs.
The project-specific latency is based on samples from your project. The Google Cloud latency is based on samples from all of Google Cloud.
The global latency metrics are derived from passive sampling of TCP traffic headers, and not through active probing from Google Cloud to internet endpoints.
Latency metric anomalies
Note the following latency metric anomalies:
For low rate environments, Network Intelligence Center uses sixty-second probes for latency metrics. Therefore, RTT metrics based on packet sampling might falsely report high latency levels when TCP-based services return a delayed application-level response. You can usually recognize inaccurate RTT levels by checking if they correspond with application-level delays.
Although the TCP-based service responds quickly with an
ACK, the sampling misses theACKand counts a later data response as the closingACKto a much earlier SEND, which distorts the overall RTT measurement. In these cases, you can disregard the RTT metrics.Sometimes, the project-specific latency data doesn't align with the global latency data. Such misalignment can happen if the global dataset also incorporates other network paths with significantly different latencies relative to the network path used by the specific project.
Metric availability
The Google Cloud latency metric is always available. The per-project latency metric is available only if TCP traffic is around 1,000 packets per minute or higher.
Metrics summary table
The following table summarizes the probing methods and protocols used for reporting packet loss and latency metrics.
| Packet loss | Latency | |
|---|---|---|
| Probing method | Active probing (synthetic VM traffic) | Passive probing (actual VM traffic) |
| Protocol | UDP (internal IP address), TCP (external IP address) | TCP (internal/external IP addresses) |
Latency views
The latency details for the Internet to Google Cloud traffic type are available in three views: Table view, Map view, and Timeline view.
Table view
The Table view shows the median RTT between the selected geographic areas and the regions that contain VM instances in your project. The table includes the following details:
- Country: The name of the country.
- Cities: The number of cities. You can view the latency details of each specific city in the country details graph.
- Destination regions: The number of destination regions with traffic for users from a given country.
- Median latency: The median RTT, in milliseconds, between the country and regions.
Map view
The Map view shows the geographic locations (metro areas or cities) and Google Cloud regions.
- View the median latency of specific locations and Google Cloud regions.
- Select a Google Cloud region and view the locations with traffic to the selected region.
- View location-specific details in a latency graph in the sidebar.
- Search for locations by using the search box in the map.
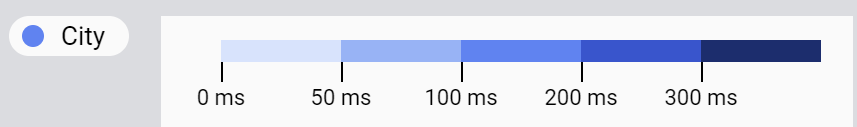
Locations are color-graded in different shades of blue to indicate the ranges of median latency on the map. In the following image, the color of a circle showing a given city on a global map can be one shade of blue. The darker the shade of blue, the greater the latency of that city from a given Google Cloud region.
Timeline view
The Timeline view shows the median RTT between the selected geographic areas and Google Cloud regions. It provides the current latency metrics and six weeks worth of historical data. You can use the filters to further aggregate the traffic to city, geographic region, and country levels. You can only view the latency metrics corresponding to specific region-geographic location pairs if there is sufficient Google Cloud traffic for that pair.