The Google Cloud performance view provides an average performance view for selected region or zone pairs. You can use the Google Cloud performance view in the Network Intelligence Center in the Google Cloud console to plan the performance management of your applications. The Google Cloud performance view helps you to identify the best regions and zones to deploy new resources or to optimize your existing workloads. For example, you are currently running in specific zones and regions, but you know they are accessed by users or other workloads from other regions.
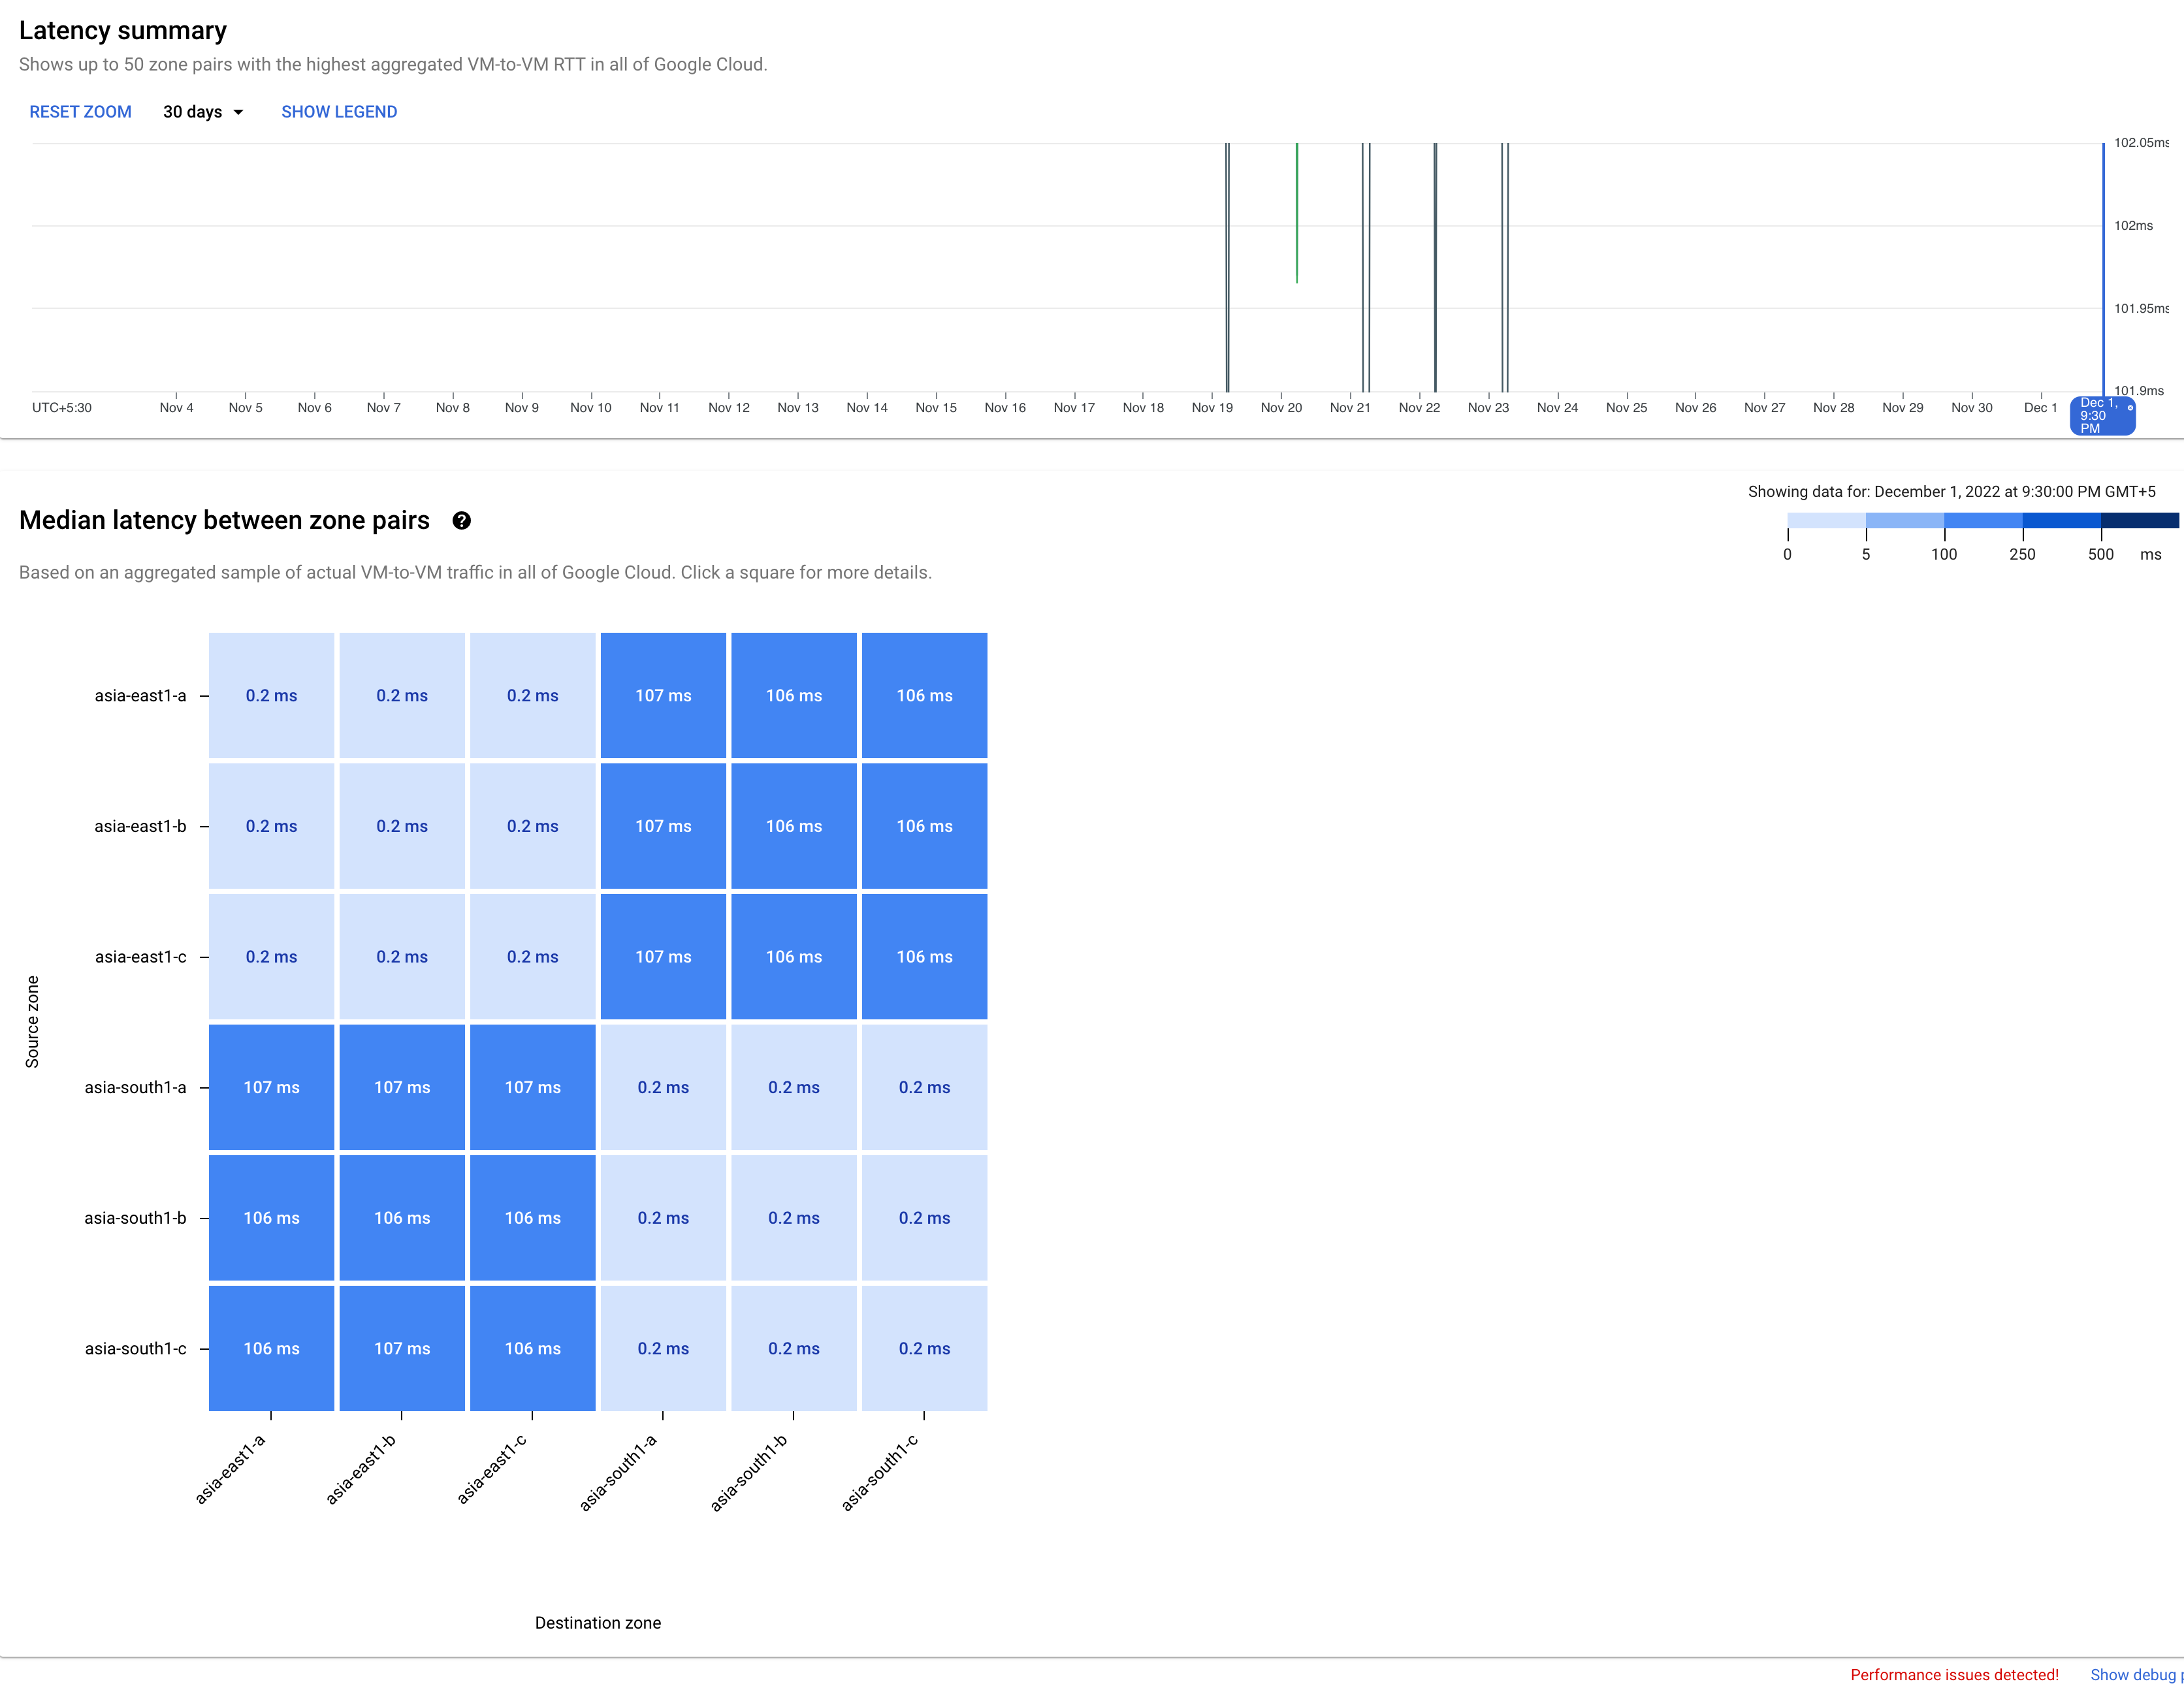
Scenario: Understand performance in new zones and regions
You want to add workloads to a region, and you want to know which zone best serves your requirements.
You use the source and destination region selection menu to select source-destination pairs where you want to see the global average metrics for latency or packet loss.
To view the zones within a region pair, you select the region pair from the heatmap.
In this example, you clicked the heatmap square for the region pair
asia-east1 and asia-south1 and adjusted the time selector to 30 days.
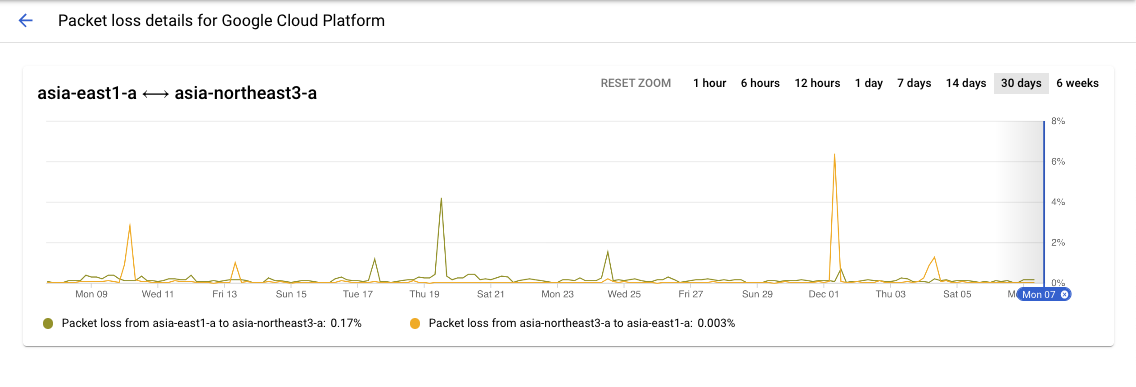
Scenario: View historical data for regions or zone pairs
Use the time series chart capability to display historical data for selected
zone pairs. In this example, you can see the heatmap square for the zone pair
asia-east1-a and asia-northeast3-a and the time selector adjusted to 30
days.
What's next
- Project performance use cases
- Planning for performance across geographies use cases
- View project-specific packet loss dashboard
- View Google Cloud packet loss dashboard
- Troubleshoot Performance Dashboard