Best practices for setting up a Cloud SQL for MySQL instance
While you can deploy MySQL manually on your own physical machine or even on a virtual machine and choose to self-manage it, an increasingly popular option is to use a managed offering from a cloud service provider, which handles the many operational aspects of managing MySQL.
Related Articles
Best practices
Cloud SQL for MySQL is a fully managed database service that helps you set up, maintain, manage, and administer your MySQL relational databases on Google Cloud. When you’re ready to create a Cloud SQL for MySQL instance, you have a few options, including the UI console, the gcloud CLI, Terraform, and a REST API. You can follow along with our documentation for details on each of these paths, but for the purposes of this article, we’ll use the UI to allow for illustration as we cover a variety of best practices for setting up an instance.
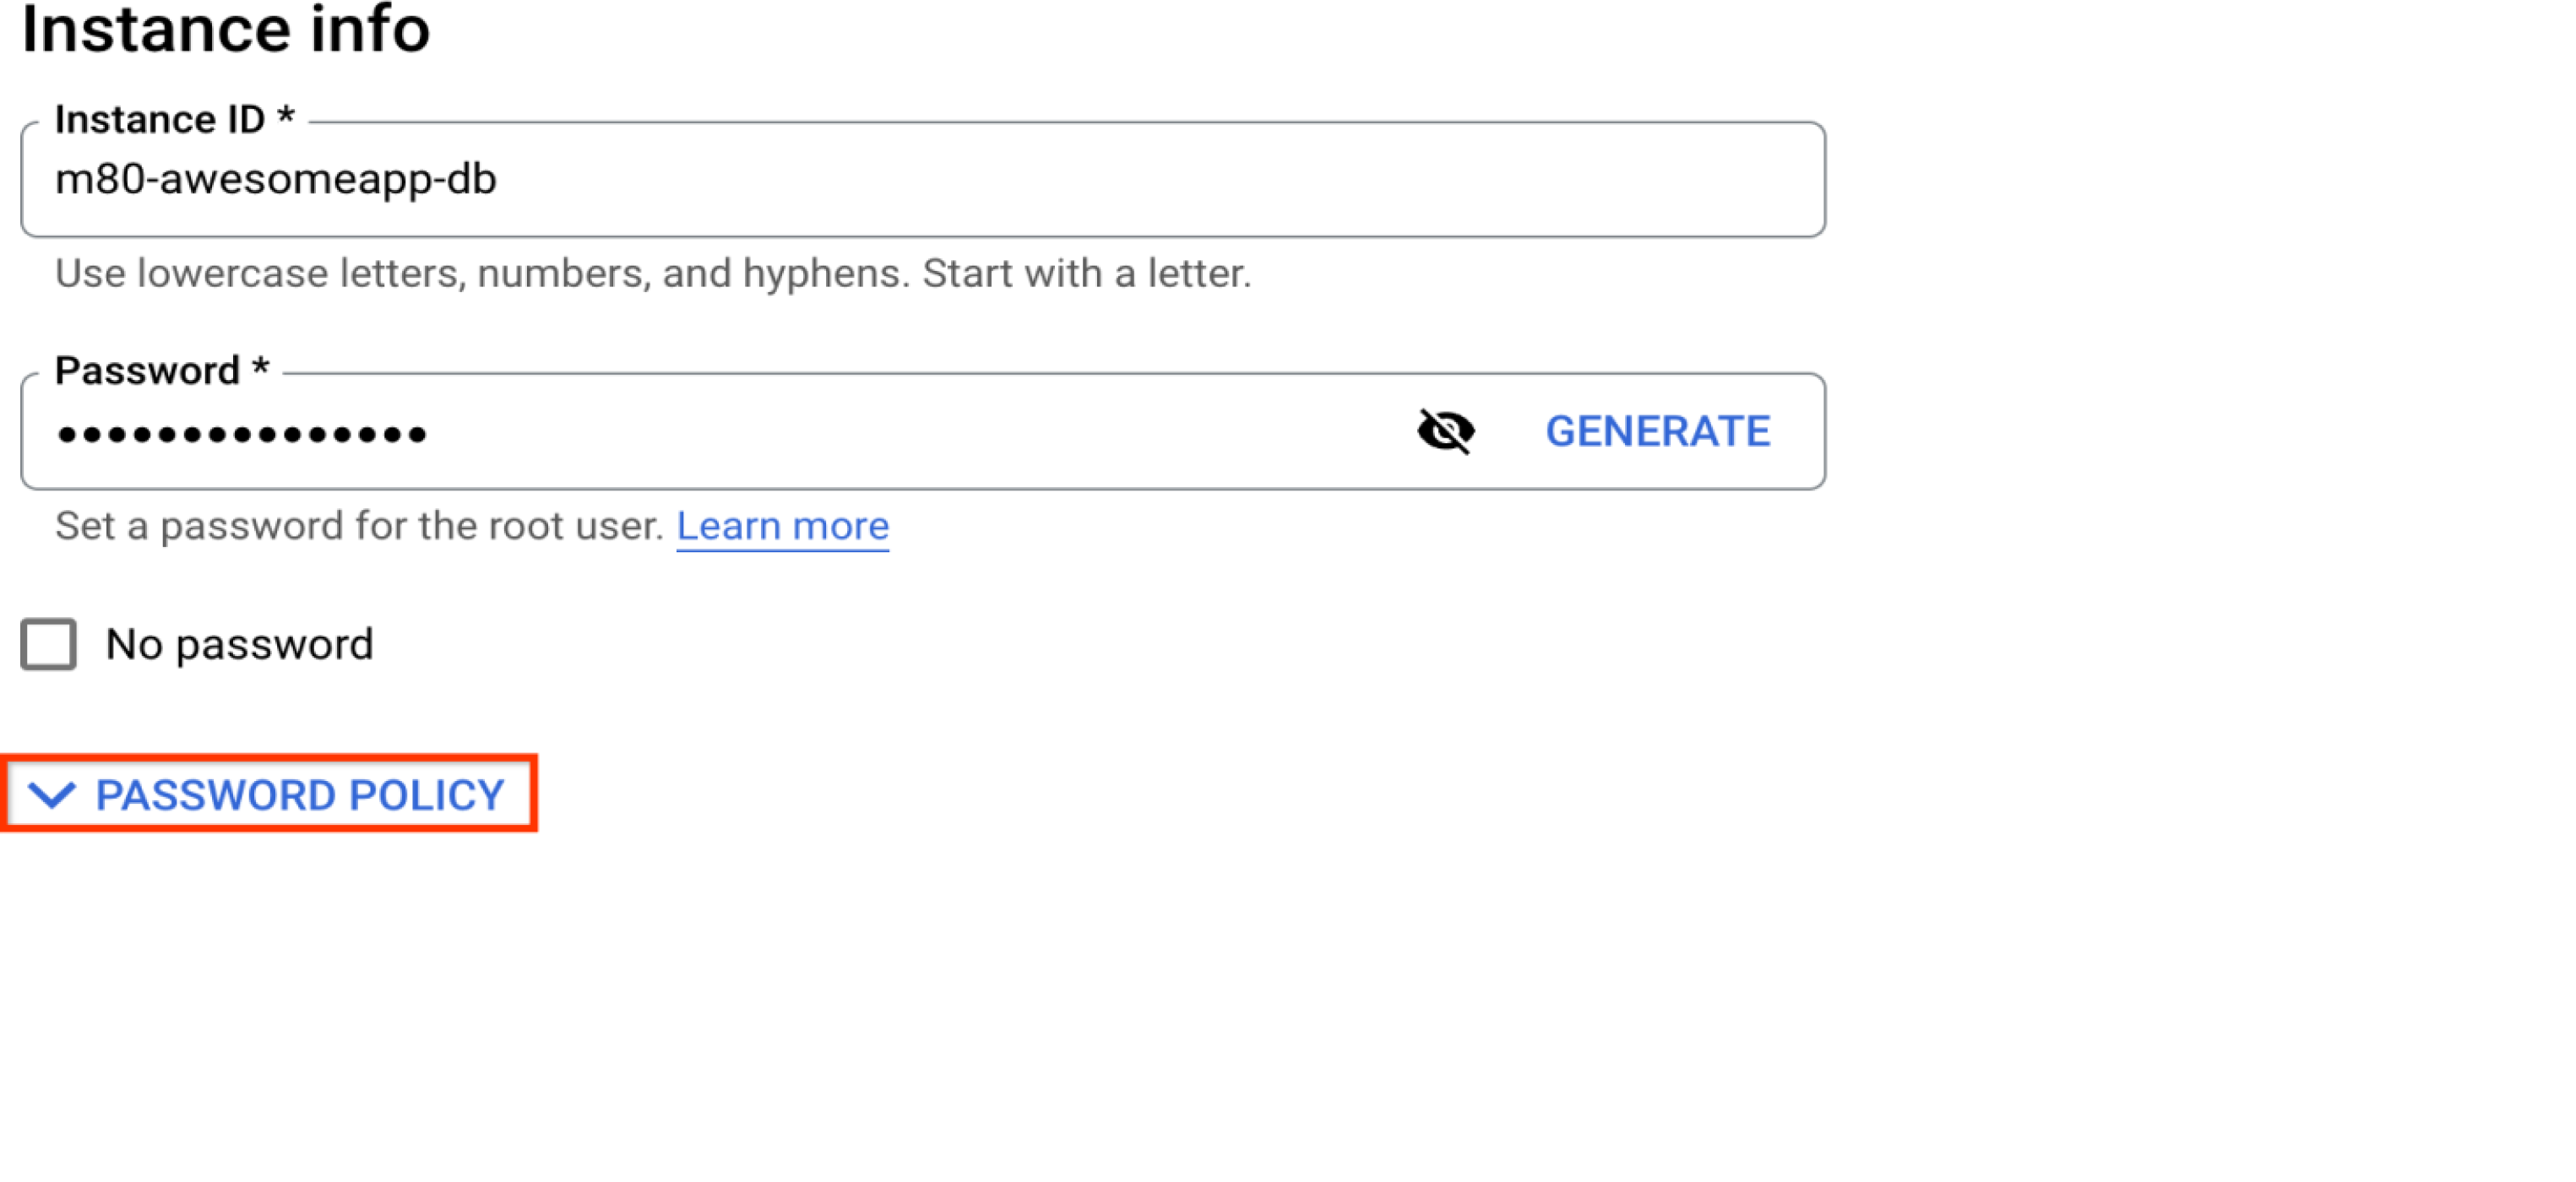
Instance info
Choose a strong password
This is the password for the default “root”@”%” database user which will be created with the instance. If you intend to keep the root user as the admin user, make sure to pick a strong password here. It is a good idea to use a not-so-common admin user instead of "root" for security concerns. Please refer to the "Manage database users" section.
Create an instance-level password policy
The password policy feature allows enhanced database security. It lets you configure policies on password length, complexity, expiration, and restricted reuse. Please refer to the Hardening a MySQL Instance for details.

Database version
Consider 8.0 for better performance
Cloud SQL MySQL supports multiple 8.0 minor versions, with v8.0.26 being the current default. Benchmark tests across a range of machine types show better query throughput with the 8.0 default version than the 5.7 and 5.6 versions.
Don’t put your production instance on the most recent GA version
Despite all testing efforts by Oracle and Cloud SQL, refresh releases of MySQL are not fully vetted with complex real world scenarios. We therefore recommend keeping your production instances on a stable version, and use your dev and staging instances to test out the latest minor version upgrades in Cloud SQL for MySQL.
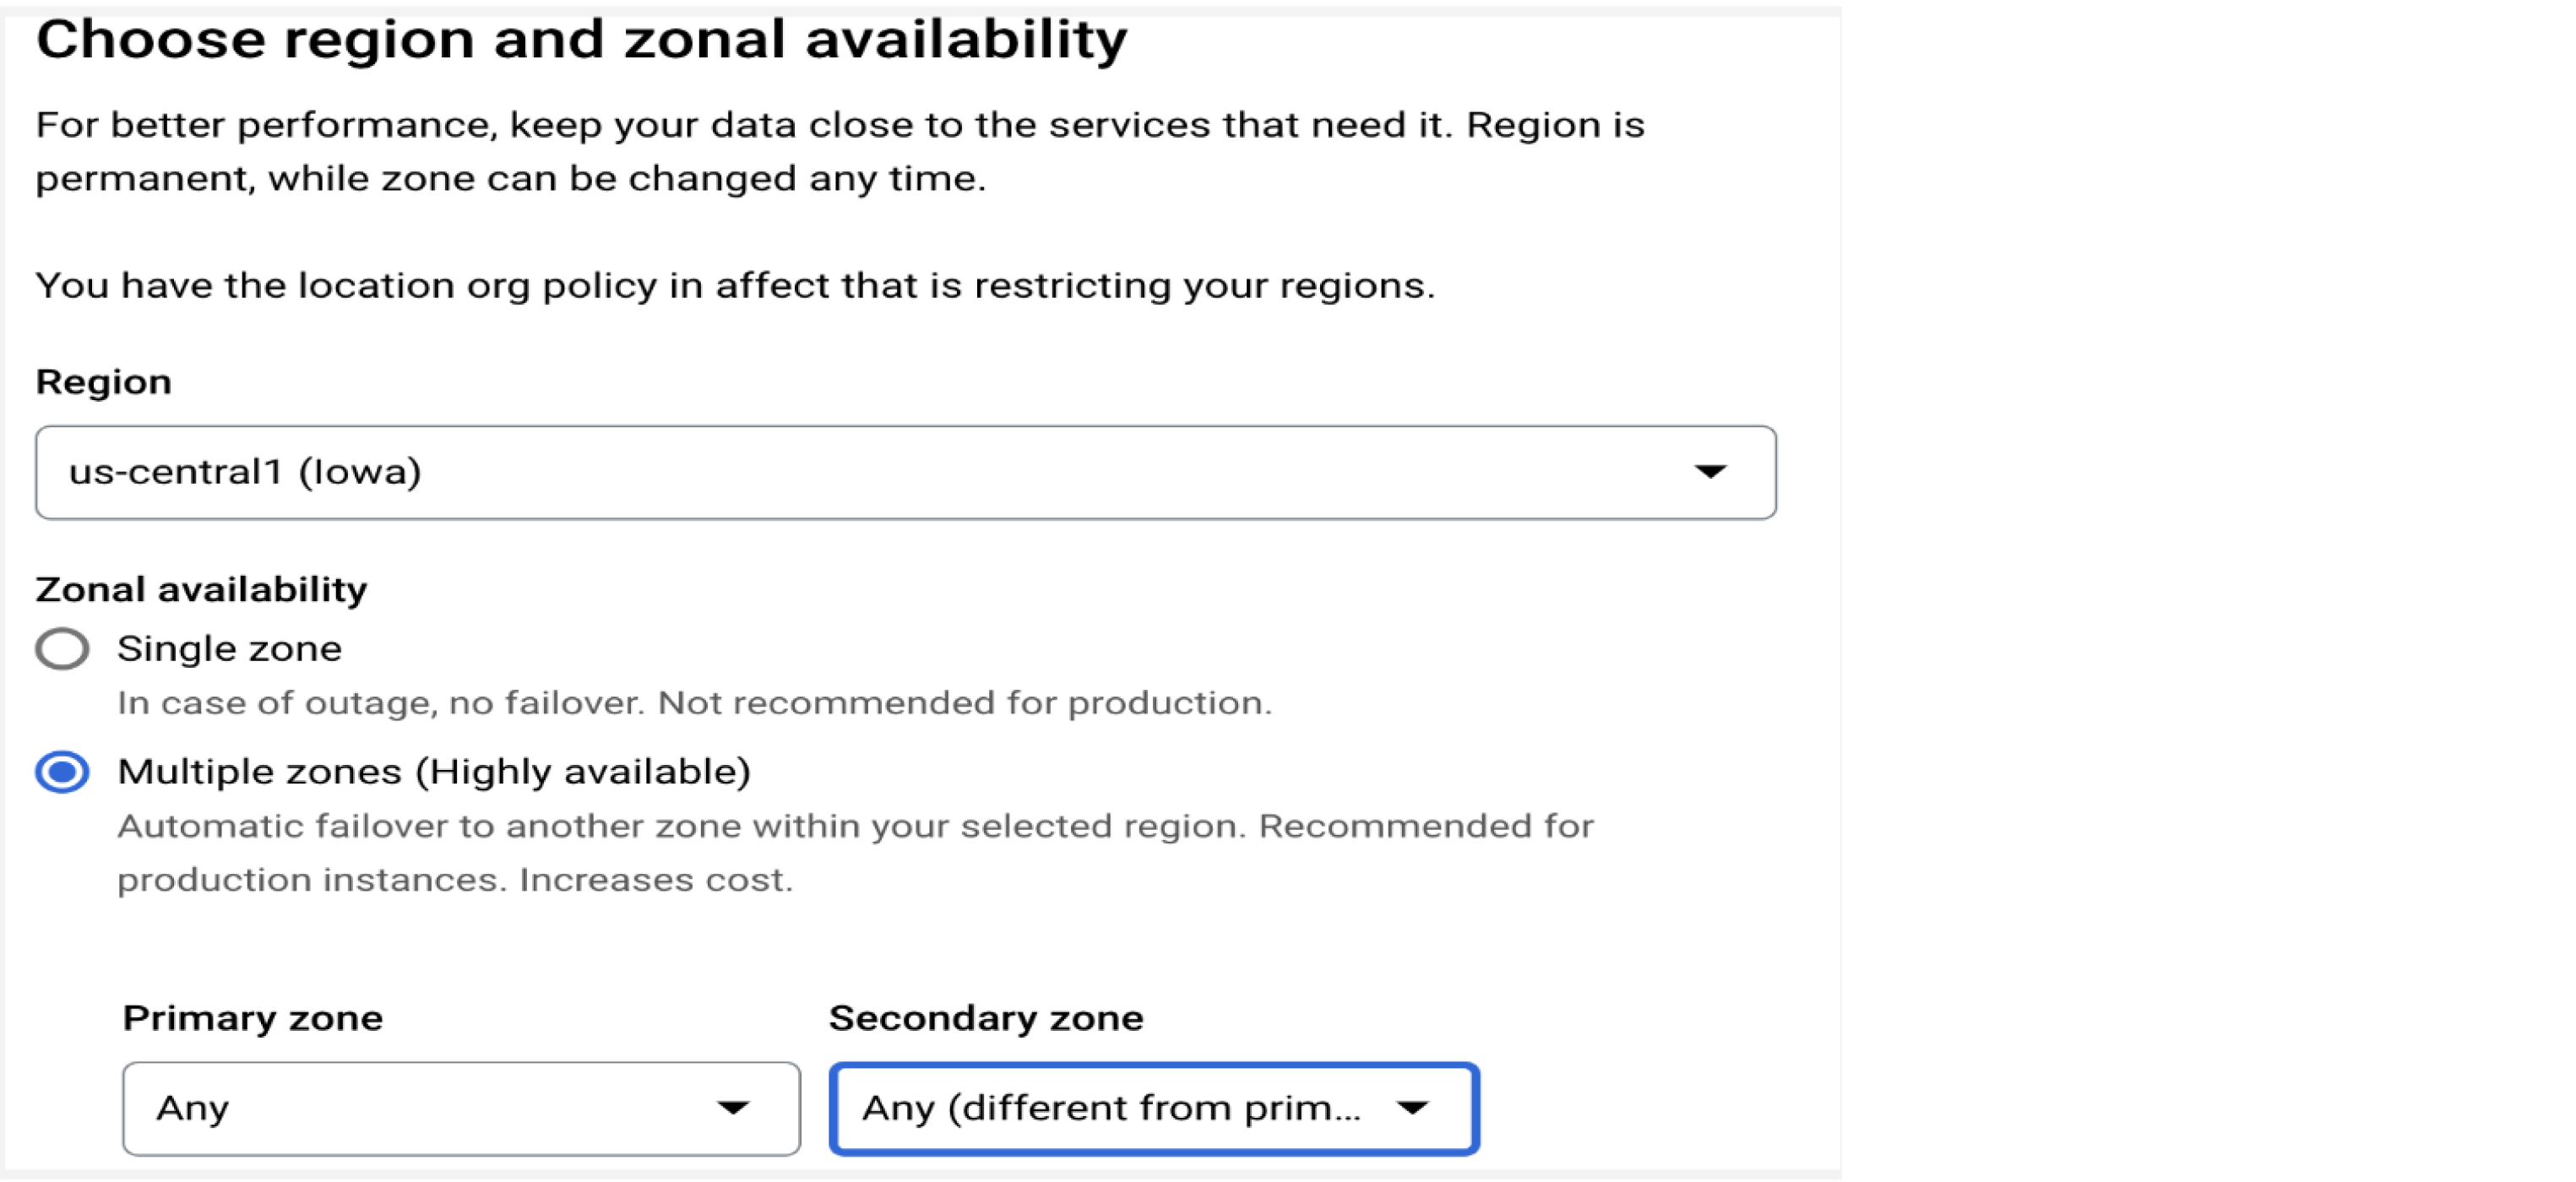
High availability
Configure multiple zones for your production instance
Cloud SQL for MySQL offers regional availability via automatic failover to a second zone as a high availability solution. For best availability, configure the multiple zones option for production instances so that you automatically have daily backups and point-in-time-recovery (see "Backup schedule" section for more information).

Machine type
Evaluate your current CPU/memory usage to make informed decisions for migration
When migrating an existing instance to Cloud SQL, your current workload can help you choose the proper VM size.
- CPU: What is your CPU usage under normal workload conditions? What about peak workload? Is the instance CPU-bound or I/O-bound? If the CPU percentage of the user and/or system is relatively high, that is an indication of a CPU-bound workload. If the percentage of I/O is relatively high, that’s an indication of an I/O-bound workload.
- Memory: Similarly, what is normal memory usage for the instance, and what is peak usage?
For reference, 1 vCPU in Cloud SQL for MySQL can support up to 6.5GB of memory.
Plan 20%-50% extra room for CPU and memory
Even in a generally stable instance, plan for at least 20% extra room for CPU and memory to absorb unplanned spikes. This is even more important for a growing business—consider an extra 50%.
Cloud SQL makes it easy to upgrade your machine type. Just note that there is downtime associated with an upgrade.
Customize storage
Use SSD for greater database performance
Cloud SQL for MySQL offers HDD as an economic storage option, but if you know you need a high performance database, go for the SSD option. Here is a comparison of I/O performance.
Plan to balance performance vs. cost when it comes to storage capacity
Disk IOPS and throughput correlate with persistent disk size. Higher capacity gives more IOPS and throughput within the instance limit.
For SSD, zonal and regional configurations will affect performance. See the zonal vs. regional SSD performance data for more details. If you selected multiple zones availability, refer to the regional SSD performance data. In short, both read and write IOPS are 30 per GB, and throughput is 0.48MB per GB. With regional SSD, the performance data is similar, except the per instance write IOPS and write throughput are lower.
Note that the max supported storage size is 64TB on a Cloud SQL instance.
Enable automatic storage increase and monitor disk growth
Cloud SQL has an automatic storage increase feature to prevent instances from running out of disk space (OOD). When the feature is enabled, storage is checked every 30 seconds, and incremental storage capacity will be added when needed.
While this feature guards against OOD, the increased capacity is permanent—you cannot downsize your instance later. Start by setting up alerts on your disk size so you can manage and plan for storage capacity.
Familiarize yourself with encryption options
Cloud SQL encrypts data-at-rest by default. However, there is an option to use a customer-managed encryption key (CMEK) instead of the default Google-owned and Google-managed key if that better suits your needs.

Configure connections
Assess the tradeoff between private IP and public IP
Private and public IP refer to types of addresses used by devices in a network. Private IP offers better network security and lower network latency compared to public IP. However, private IP requires additional API and IAM configurations to set up, and sometimes public IP is actually required. If you know you need to use public IP but want to improve security, you can choose to require an authorized network or use the Cloud SQL Auth proxy.
Consider Cloud SQL Auth proxy for secure connections
The Cloud SQL Auth proxy provides secure access to the Cloud SQL instance in lieu of configuring SSL or authorized networks. The application communicates to the Auth proxy client, which runs in the local environment and uses a secure tunnel to communicate to the proxy server on the Cloud SQL instance.
Set up backup schedule and retention
Enable backups and point-in-time recovery and review your retention policy
Regular data backups and verifiable data recovery are critical to healthy database management. These practices are invaluable in situations like data corruption or unintended data operations—neither of which can be mitigated by high availability.
Cloud SQL offers automated backups, backup verification and point-in-time recovery (PITR). They are enabled by default and are required on instances with multiple zones. Automatic backups are taken daily and the default retention policy is seven copies of backups and seven days of binary logs (required for PITR). You may adjust the retention policy in the Advanced Options section.

Configure database flags
Database flags are server configurations that go to the my.cnf file. There is a list of db flags that are configurable, and certain managed flags are not configurable. It is a good practice to review the db flags and configure them to the proper value at the instance creation time. Because some db flags are not dynamic, which means that changing them would trigger an instance restart.
Review character_set_server
On Cloud SQL for MySQL instances, the default character_set_server is utf8 on v5.6 and v5.7 and utf8mb4 on v8.0. The character_set_server sets character_set_client, character_set_connection, character_set_database, character_set_results to the same value. For character_set_system, it defaults to utf8mb3 on v8.0.
If you are migrating an instance and the current configuration uses a different character set (for example, latin1), be sure to set character_set_server explicitly on the new instance.
Review time_zone
The time zone defaults to system_time_zone, which is UTC. If you’d like to use a different time_zone, set it via default_time_zone. This flag takes two formats: timezone offset, for example, +08:00, and timezone names, for example, America/Los_Angeles. When the time zone is defined by timezone names, it automatically adjusts to daylight saving time (if relevant). The default_time_zone flag is not dynamic and requires db instance restart to make a change.
Enable slow query log
By default, the slow_query_log is set to OFF. We strongly recommend enabling the slow query log and set the long_query_time to a threshold that makes sense to the application. The slow query log helps capture long running queries for analysis and optimization. This information not only helps with individual queries, but also the overall server throughput and retrospective analysis of unexpected workloads.
Review innodb_buffer_pool_size
This is the most effective configuration for InnoDB performance. The more data that can buffer in memory, the better your server performance will be. At the same time, there needs to be sufficient memories reserved for global buffers and per-thread dynamic buffers.
In Cloud SQL, the default, minimum allowable, and maximum allowable values of the innodb_buffer_pool_size flag depend on the instance's memory as described in the documentation.
A good innodb_buffer_pool_size does not have to contain all the data, just the frequently accessed data. The status variables that reflect the buffer pool efficiency are Innodb_buffer_pool_reads/Innodb_buffer_pool_read_requests. The Innodb_buffer_pool_read_requests is the number of logical read requests, and Innodb_buffer_pool_reads is the number of logical reads that are not satisfied from the buffer pool and had to be read from disk. In an ideal case where data is fully in the buffer pool, the ratio of Innodb_buffer_pool_reads/Innodb_buffer_pool_read_requests would be close to zero. Monitoring these variables would give an idea of InnoDB buffer pool efficiency. If the innodb_buffer_pool_size is at maximum allowable value and the buffer pool efficiency is not good and the application is suffering from query performance issues, consider upgrading your instance to have larger memory.
This variable becomes dynamic in MySQL v5.7 and v8.0, while in v5.6, changing it would require an instance restart.
Review innodb_log_file_size
Prior to 8.0.30, innodb_log_file_size and innodb_log_files_in_group were not dynamic, and changing innodb_log_file_size required a clean shutdown. In 8.0.30, innodb_redo_log_capacity was introduced to replace innodb_log_file_size and innodb_log_files_in_group.
Cloud SQL for MySQL instances are configured with innodb_log_file_size=512MB, innodb_log_files_in_group=2 (or innodb_redo_log_capacity=1GB). This lets InnoDB hold more changes in the buffer pool without syncing to disk, which improves server performance. The downside of large redo log files is the increased crash recovery time. Depending on the instance’s HA requirements and setup, this decision requires a balance between performance and availability.
Generally, we recommend having redo log files large enough to hold one hour’s worth of write activities. One way to gauge this is to observe Innodb_os_log_written throughout a day and then ensure innodb_log_file_size * innodb_log_files_in_group is big enough for the peak observed hour.
Review innodb_log_buffer_size
In MySQL v5.6 and v5.7, innodb_log_buffer_size is not dynamic, and changing it requires an instance restart. Therefore, it’s best to set it at initialization.
When innodb_log_buffer_size is big enough to contain the whole transaction, there will be no additional flushing to disk during the transaction execution. By default, innodb_log_buffer_size is set to 16MB which is generally sufficient. But to get an idea of whether a large transaction may need a larger buffer, monitor the Innodb_log_waits status variable when you issue a large transaction. If the innodb_log_buffer_size is too small and needs to wait for a flush, Innodb_log_waits will increase by one.
Adjust dynamic variables as you go
Some performance-related db flags are dynamic, like table_open_cache, thread_cache_size. It is good to have the right size to start with, while it is recommended to establish measurements and tune as needed.
The table_open_cache is for the number of open tables. Having sufficient cache helps to reduce table open time, hence improve query performance.The status variable Opened_tables shows the number of tables that have been opened. If Opened_tables keeps growing, consider increasing table_open_cache.
The thread_cache_size is for caching threads for reuse after clients disconnect. If an instance expects a lot of simultaneous new connections, set a bigger size. The ratio of status variables Threads_created and Connections shows the efficiency of thread cache. A low ratio is better.
Be conservative on per-thread memory flags
There are per-thread memory buffers that impact query performance, for example, tmp_table_size, max_heap_table_size, join_buffer_size, sort_buffer_size, and more. These variables have both global and session scope. The global scope sets the per-thread value for all new connections, while the session scope is effective for subsequent queries in the current session. Larger memory for settings like these leads to better query performance. However, because they are dynamic and allocate one or more per thread, they can lead to out-of-memory (OOM) scenarios.
It’s best to use moderate numbers for global values and reserve larger numbers for specific sessions to achieve better performance in a controlled way.
Consider performance_schema
The performance_schema is default to OFF before MySQL v8.0.26 and requires a restart to turn it on. The performance_schema enables a variety of instrumentations and provides a rich set of data for analyzing the server operations but comes with both performance and memory costs. Default instrumentations yield around 5% performance dips, and this grows as more instruments are added. Benchmark instrumentations with your workload, as memory consumption can grow to 1GB or more. You can observe this memory consumption in the memory_summary_global_by_event_name table.
Manage database users
After creating the Cloud SQL instance, there is one database user available, ‘root’@’%’. You will likely need to create additional database users.
Restrict user access to the needed operations
Always restrict user access to the minimum necessities.
When creating a user via MySQL CLI, you will need to explicitly grant privileges.
When creating a user via the Cloud console, the user will have the same privileges as the ‘root’@’%’ user. In MySQL v5.6 and v5.7, the default privileges include all privileges with grant option except SUPER and FILE privileges. In v8.0, the user comes with dynamic privileges, and while SUPER and FILE privileges are still restricted, more admin roles are available to the users (for example, APPLICATION_PASSWORD_ADMIN, CONNECTION_ADMIN, ROLE_ADMIN, SET_USER_ID and XA_RECOVER_ADMIN). You will need to revoke any unnecessary privileges via MySQL CLI. On v8.0 instances, the partial_revokes variable is enabled.
Consider replacing ‘root’@’%’ with a specific admin user
The ‘root’@’%’ user is the default and most popular super user and therefore is often targeted by hackers. We recommend creating your own admin users with the same set of privileges as the ‘root’@’%’ user and then replace it for better security.
Set up monitoring
It’s very important to monitor and track various aspects of the database operations and system resources. It lets you review and analyze the operational health of your instance over time, which can also help with resource planning.
- The Cloud console overview page comes with a list of core metrics.
- Cloud Monitoring offers additional metrics. You can create a dashboard with selected metrics for your db instances. On the Cloud Console, from the top left Navigation menu, choose OPERATIONS --> Monitoring to access Cloud Monitoring.
- Use Query Insights in Cloud SQL for query performance analysis. Its overview section displays the CPU load sliced by database, user, or client address. The CPU usage is also broken down to show I/O wait and lock wait. It also lists the top queries by the query digest. For each query digest, you can see the average execution time, number of queries, and average rows scanned and returned. These metrics are very helpful to identify hot spots and queries to be optimized.
- You can also supplement the above with home-grown monitoring tools and/or third-party tools. The main goal is to understand your database operations that can influence both server and query optimization and troubleshooting.
Set up alerting
Proper alerts are critical for server health. They help prevent service interruptions such as out of memory (OOM) or system stalls due to CPU saturation.
If you use Cloud Monitoring, then you can create metric-based alerts. Refer to the documentation for details.
If you use other monitoring tools, be sure to configure alerting.
Configure replicas
To scale reads, consider adding read replicas. You may use HAProxy, ProxySQL, or another load balancer to distribute reads among multiple read replicas.
Cloud SQL also supports chained replication, which you can learn about under cascading replicas.
The read replicas are created with the same MySQL version as the primary instance. After creation, you may choose to upgrade the replica to primary.
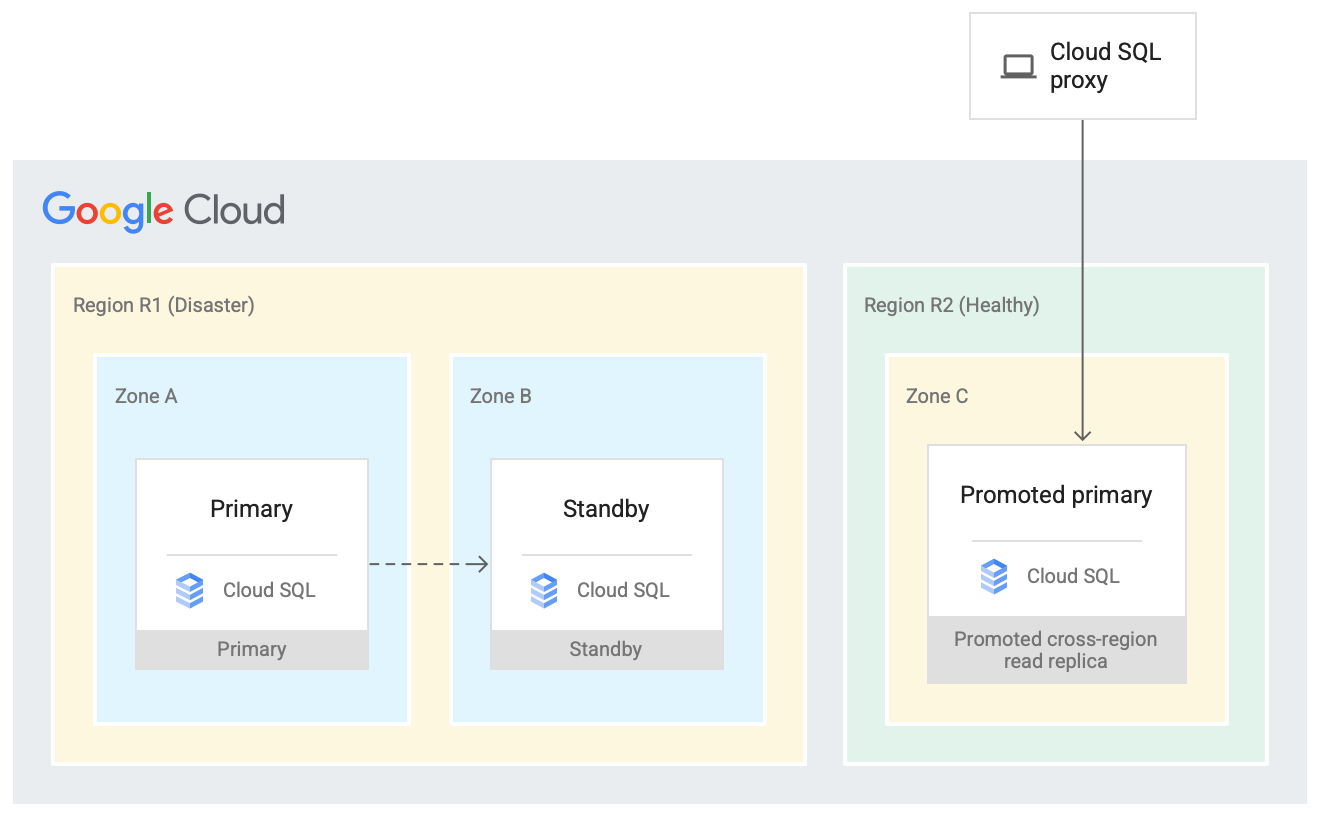
Plan for disaster recovery
The high availability solution provides data redundancy at a secondary zone within the same region. In a disaster, one region might become unavailable. Cross-region read replicas are a strong resource in a disaster recovery plan, as they can be promoted to a primary instance when needed. Refer to the documentation for more information.

Take the next step
Start building on Google Cloud with $300 in free credits and 20+ always free products.
Need help getting started?
Contact salesWork with a trusted partner
Find a partnerContinue browsing
See all products


