This page describes how to troubleshoot issues that might occur while provisioning a user cluster in GDC.
Unable to schedule pods
To get the permissions needed to troubleshoot issues with scheduling pods in a user cluster, ask your Organization IAM Admin to grant you the User Cluster Admin role.
To troubleshoot unschedulable pods in a user cluster, complete the following steps:
Fetch the Grafana URL:
echo https://console.ORGANIZATION_NAME.GDC_URL/platform-obs/grafanaReplace the following variables:
ORGANIZATION_NAME: the name of the organization.GDC_URL: the domain name you use to access your GDC instance.
Navigate to the Grafana URL in a browser.
Open the KUB-R0101 - Cluster cannot deploy more pods dashboard on the Grafana home page.
View the Number of unschedulable pods chart to see which user cluster has one or more unschedulable pods.
From the Number of unschedulable pods chart, hold the pointer over data points to find the unschedulable pod's name and namespace.
Export the pod's name and namespace as variables:
export POD_NAME=POD_NAME
export NAMESPACE=NAMESPACE
Run the following command to print information about the affected pod:
kubectl --kubeconfig USER_CLUSTER_KUBECONFIG \
    describe pod -n "${NAMESPACE}" -p "${POD_NAME}"
If you are seeing the following warning, your pod has insufficient memory:
Warning FailedScheduling 40s (x98 over 2h) default-scheduler 0/1 nodes are available: 1 Insufficient memory (1).Proceed to the next step for details on how to mitigate this issue.
Increase the number of pods available in your worker node pool. See the Resize node pools section for information on how to increase a user cluster's node pool size.
After you scale up your worker node pool, validate you've fixed the issue by verifying the Number of unschedulable pods chart in Grafana is zero.
Degraded performance for workloads
To get the permissions needed to troubleshoot issues with degraded performance in a user cluster, ask your Organization IAM Admin to grant you the User Cluster Admin role.
To troubleshoot degraded performance for workloads in a user cluster, complete the following steps:
Fetch the Grafana URL:
echo https://console.ORGANIZATION_NAME.GDC_URL/platform-obs/grafanaReplace the following variables:
ORGANIZATION_NAME: the name of the organization.GDC_URL: the domain name you use to access your GDC instance.
Navigate to the Grafana URL in a browser.
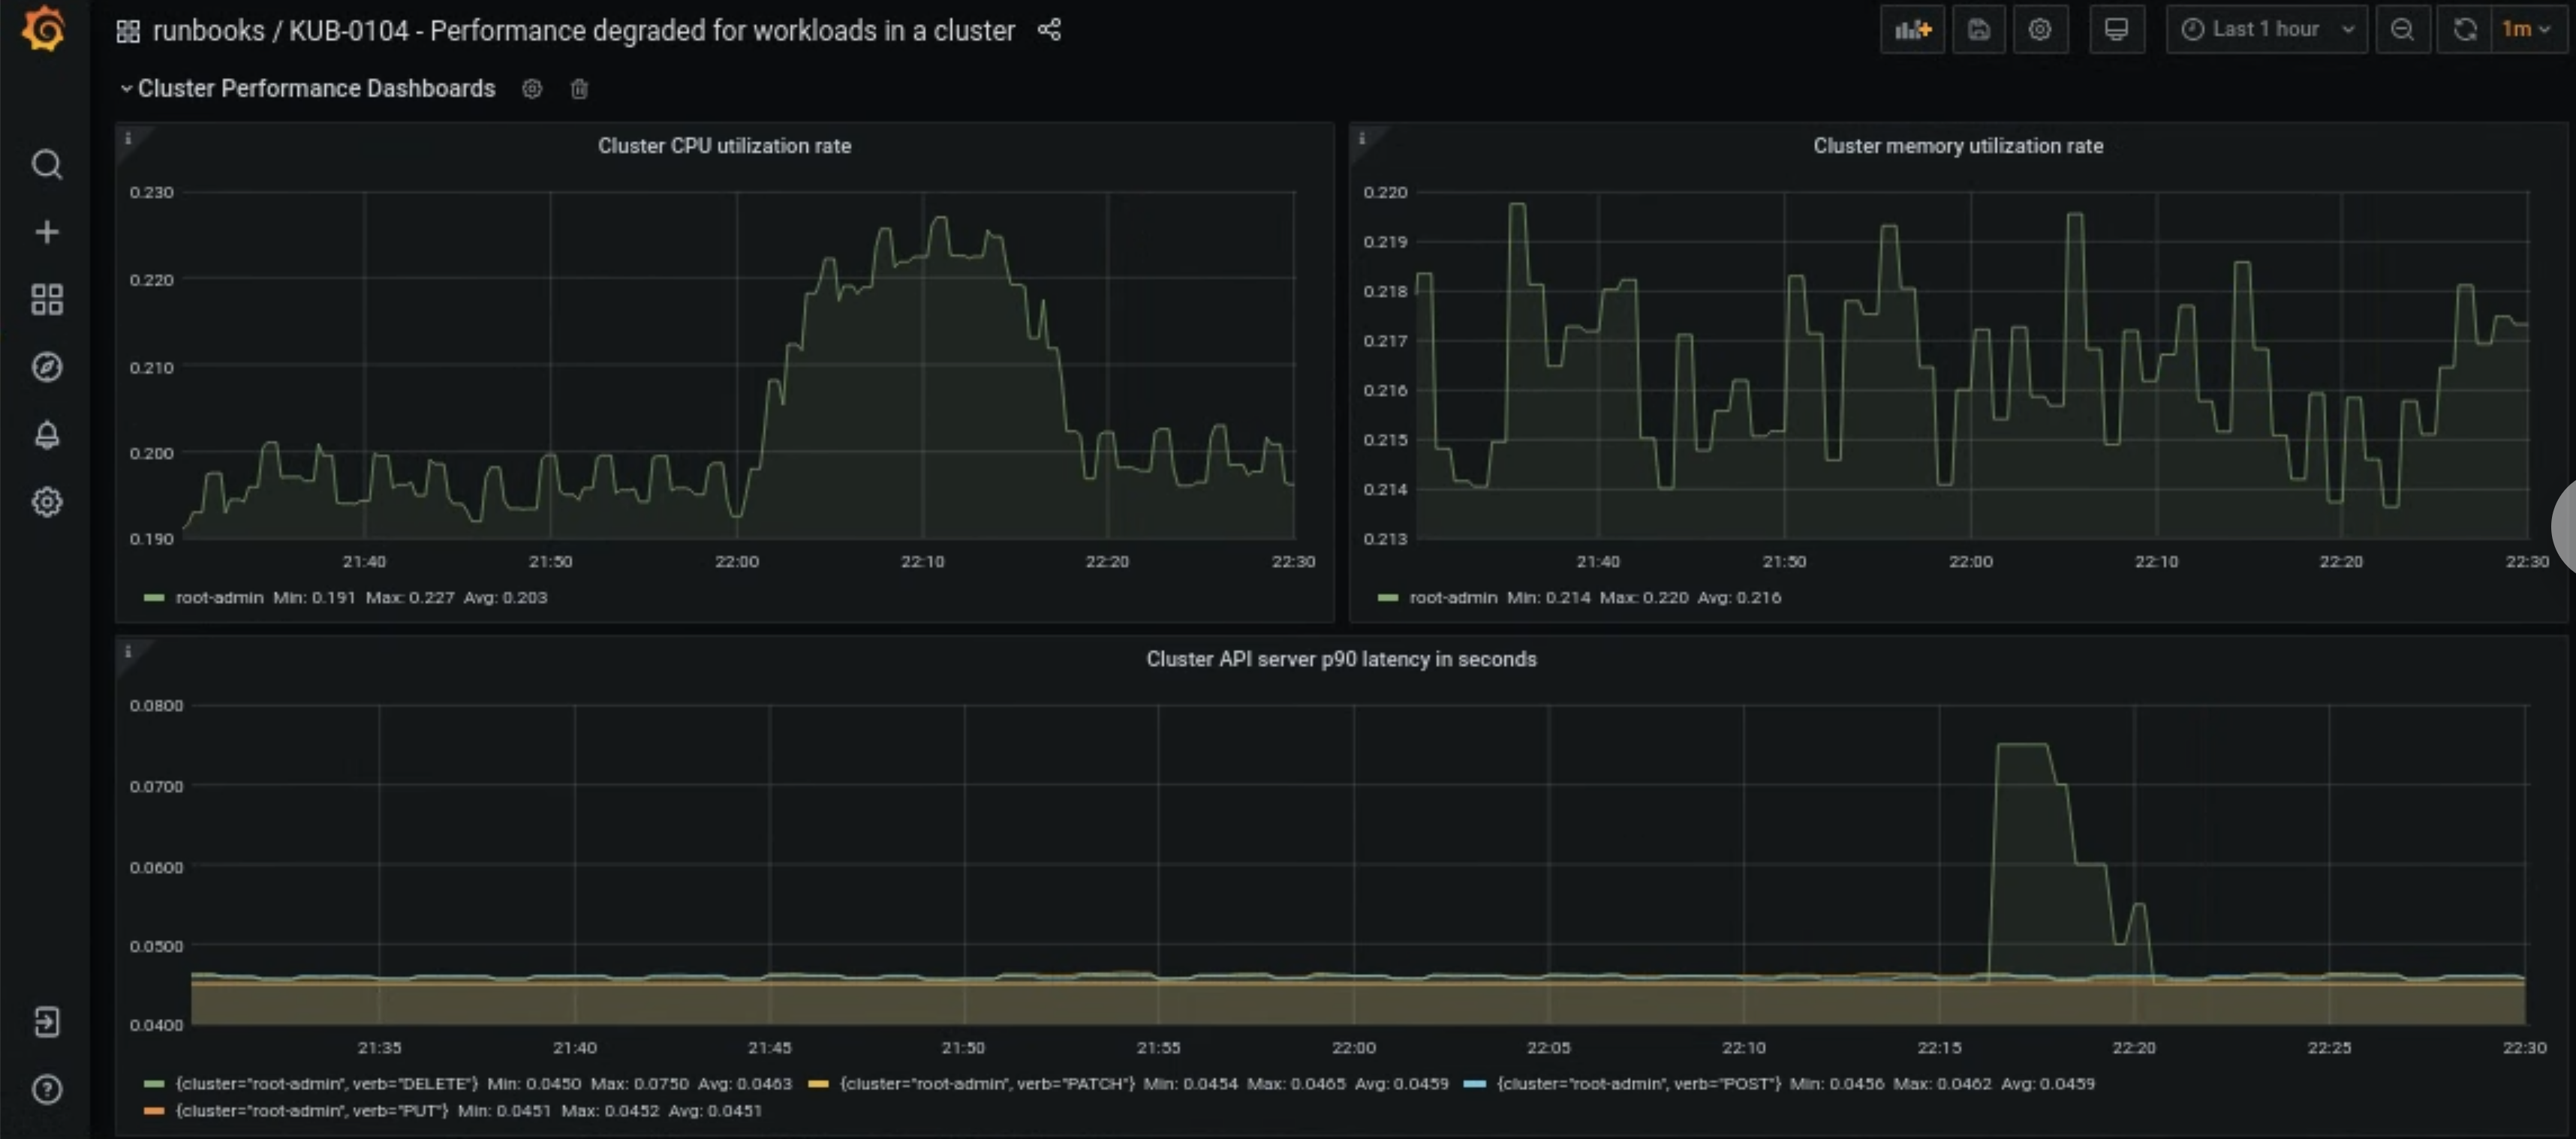
Open the KUB-R0104 - Performance degraded for workloads in a cluster dashboard on the Grafana home page.
There are three charts that show whether the CPU, memory, or API latencies are too high for a user cluster:

There are many reasons a user cluster's CPU, memory, or API server latencies suddenly increase. First, find the impacted user cluster from the Grafana dashboard depending on the issue.
If it's related to a user cluster's high CPU or memory issue, check the Node CPU utilization rate and Node memory utilization rate in the same dashboard to find which nodes are affected.
If the affected nodes are worker nodes, increase the number of pods available in your worker node pool. If a node does not have the keyword
adminin its name, it is a worker node. See the Resize node pools section for information on how to increase a user cluster's node pool size.
