This page describes the process to create and manage dashboards in your system monitoring instance. Use dashboards to perform monitoring operations in your project, such as network monitoring and server monitoring.
After the Observability platform collects the metrics produced by workloads deployed in your GDC project, the configuration saves the associated metric labels and aggregates files from all data sources. Then, you can create customized dashboards to query and visualize specific metrics from the user interface (UI) of the monitoring instance.
A dashboard is a dynamic visual arrangement of one or more customizable panels that interact with Prometheus metrics configured in data sources. By making queries, you can use each of these panels to visualize and expose specific metrics from your GDC components.
The Observability platform exposes an API that lets you configure customizations for the visual arrangement of your metrics. For example, establish acceptance thresholds, display proper signals, label graphs, and choose a consistent time resolution.
Available dashboards
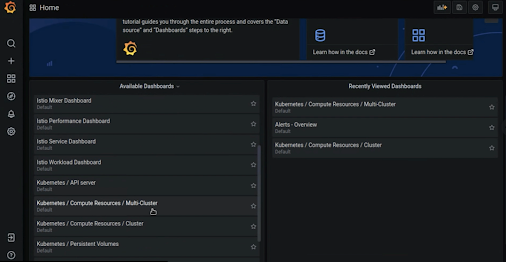
Assuming your environment is up and running, you immediately see a few metrics dashboards in the home page of the monitoring instance. For example, you can observe switch status and health of system components.
Use the switch and cluster dashboards for monitoring clusters and node metrics. Access the logging and monitoring dashboards to observe admin clusters.

The most relevant Platform Administrator (PA) metrics are the following:
- Kubernetes / API server: Shows API server healthiness per cluster in the organization.
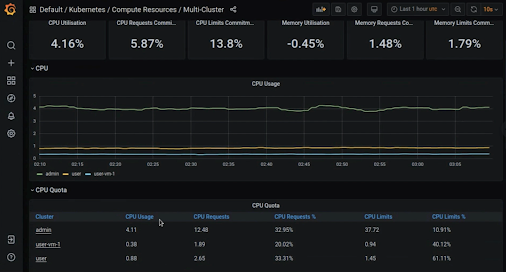
- Kubernetes / Compute Resources / Multi-Cluster: Shows organization-wide resource utilization.
- Kubernetes / Compute Resources / Cluster: Shows resource utilization per cluster.
- Kubernetes / Persistent Volumes: Shows utilization of Kubernetes persistent volumes in each cluster.
- Node Status: Shows resource usage on each node of each cluster.
- Pod Status: Shows resource consumption of each pod in each cluster.
The following image shows an example for the Kubernetes / Compute Resources / Multi-Cluster dashboard.

Access the monitoring instance of your project
You must obtain authorization to access monitoring dashboards. To get the permissions you need to log in and view metrics in the monitoring instance of your project, ask your Organization IAM Admin to grant you the Organization Grafana Viewer (organization-grafana-viewer) role. The Organization IAM Admin can grant you access by creating a role binding:
kubectl --kubeconfig ADMIN_KUBECONFIG create rolebinding pa-grafana-viewer-binding -n platform-obs --user=USER_NAME --clusterrole=organization-grafana-viewer
Replace the following:
- ADMIN_KUBECONFIG: the path of the kubeconfig file for the admin cluster.
- USER_NAME: the account name of the user that requires the role binding.
Check the following resources for more information about role assignments:
- For a description about the Organization Grafana Viewer role, see Predefined role descriptions.
- For instructions on adding and removing roles from the UI, see Grant access to resources.
Create Grafana dashboards
This section describes the process to create and manage dashboards in your Grafana instance.
Work through the following steps to create a dashboard in GDC:
- Complete the prerequisites from the Before you begin section.
- Open the Grafana endpoint of your project.
- Create a
ConfigMapobject for your dashboard. - Create a
Dashboardcustom resource (CR).
Before you begin
Before creating dashboards, you must obtain access to the monitoring instance. For more information, see Get access to dashboards.
- Collect metrics from your GDC project before creating dashboards.
- To sign in, create dashboards, and visualize metrics, ask your Project IAM Admin to grant you the Project Grafana Viewer (
project-grafana-viewer) role. Set the path of the kubeconfig file as an environment variable:
export KUBECONFIG=KUBECONFIG_FILEReplace KUBECONFIG_FILE with the path of the kubeconfig file on the admin cluster where you want to create the dashboard.
Monitoring endpoint
Open the following URL to access the endpoint of your project:
https://GDC_URL/PROJECT_NAMESPACE/grafana
Replace the following:
- GDC_URL: The URL of your organization in GDC.
- PROJECT_NAMESPACE: The namespace of your project.
Create a ConfigMap object for your dashboard
Follow these steps to create a ConfigMap object containing the JSON model of the dashboard:
- Go to the endpoint of your project.
- From the navigation menu, click the Add button.
- From the drop-down menu that is displayed, click Dashboard. The instance creates an empty dashboard.
On the empty dashboard, add all the panels that you want. You can customize your details and edit your panels to supply your queries or make other updates.
From the menu bar, click the Dashboard settings button to open the Settings page.
From the navigation menu, click the JSON Model option.
Copy the JSON model of the dashboard and paste it in a plain-text file to keep it available to you.
Replace the top-level
idanduidfields with thenullvalue in the JSON model.Create a
ConfigMapobject from the command line. In thedatasection of yourConfigMapobject, paste the JSON model that you previously copied inside a.jsonfile:cat <<EOF | kubectl --kubeconfig ${KUBECONFIG} apply -f - apiVersion: v1 kind: ConfigMap metadata: namespace: PROJECT_NAMESPACE name: DASHBOARD_CONFIGMAP_NAME data: JSON_FILE_NAME.json: | { <JSON model of the dashboard> } EOFReplace the following:
- PROJECT_NAMESPACE: The namespace of your project.
- DASHBOARD_CONFIGMAP_NAME: The name you want to give to your
ConfigMapobject. - JSON_FILE_NAME: The name you want to give to the file where you paste the JSON model of the dashboard.
For an example of what this object must look like, see the
ConfigMapexample for a dashboard.Deploy the
ConfigMapobject of your dashboard into the admin cluster.
ConfigMap example for a dashboard
The following YAML file shows an example of the ConfigMap object of a dashboard for metrics in the platform-obs namespace:
  apiVersion: v1
  kind: ConfigMap
  metadata:
    namespace: platform-obs
    name: my-project-dashboard-configmap
  data:
    my-project-dashboard.json: |
      {
      "annotations": {
        "list": [
          {
            "builtIn": 1,
            "datasource": "-- Grafana --",
            "enable": true,
            "hide": true,
            "iconColor": "rgba(0, 211, 255, 1)",
            "name": "Annotations & Alerts",
            "type": "dashboard"
          }
        ]
      },
      "editable": true,
      "graphTooltip": 0,
      "id": null,
      "links": [],
      "panels": [],
      "schemaVersion": 27,
      "style": "dark",
      "tags": [],
      "templating": {
        "list": []
      },
      "time": {
        "from": "now-6h",
        "to": "now"
      },
      "timepicker": {},
      "timezone": "",
      "title": "Sample dashboard",
      "uid": null,
      "version": 0
      }
Create a Dashboard custom resource
Follow these steps to create a Dashboard custom resource (CR) and enable the dashboard on your given project:
Create a
DashboardCR from the command line and configure the file with the name you gave to theConfigMapobject of your dashboard:cat <<EOF | kubectl --kubeconfig ${KUBECONFIG} apply -f - apiVersion: observability.gdc.goog/v1alpha1 kind: Dashboard metadata: namespace: PROJECT_NAMESPACE name: CUSTOM_RESOURCE_NAME spec: configMapRef: name: DASHBOARD_CONFIGMAP_NAME namespace: PROJECT_NAMESPACE key: JSON_FILE_NAME.json foldername: Default EOFReplace the following:
- PROJECT_NAMESPACE: The namespace of your project.
- CUSTOM_RESOURCE_NAME: The name you want to give to your
Dashboardcustom resource. - DASHBOARD_CONFIGMAP_NAME: The name you gave to the
ConfigMapobject for your dashboard. - JSON_FILE_NAME: The name you gave to the file that contains the JSON model of the dashboard in the
ConfigMapobject.
Deploy the
DashboardCR into the project namespace. This action configures the Observability service to import the pre-defined dashboard to the monitoring instance of your project.
Dashboards are isolated from other projects, as are metrics and logs. Consequently, if you want to use the same dashboard in multiple projects, deploy a Dashboard CR in each one. Also, the logging and monitoring data that the dashboard accesses must be available in all those projects.
The process that handles the dashboards detects changes to both the Dashboard CR and the ConfigMap object. If you modify one or the other, the program reflects the change in the monitoring instance. To update or delete a dashboard, you must apply the changes in the CR and deploy it again. You can't save any updates performed directly in the monitoring UI.
To create a dashboard in a folder or change the folders, modify the foldername value in the spec section of the Dashboard CR. Otherwise, leave it as Default. The process automatically creates folders if they don't exist.
