This page provides detailed instructions on how to query and visualize your logs using the Grafana user interface to gain insights into your service events and activity.
After collecting logs from your deployed workloads and services in Google Distributed Cloud (GDC) air-gapped appliance, you can start analyzing them. To analyze logs, you can visualize and filter them on informative Grafana panels or gRPC calls for programmatic access.
You can access your logs in the following method:
- Grafana panels: Gain insights into your project's activity record through the Log panel of your Grafana instance. This panel lets you query and pinpoint specific logs, providing granular data observability tailored to your needs. Grafana provides a user-friendly interface for filtering and analyzing your workload data, creating customized dashboards and panels for comprehensive visualization.
Before you begin
To get the permissions that you need to query and visualize logs on the Grafana user interface, ask your Organization IAM Admin or Project IAM Admin to grant you one of the predefined Organization Grafana Viewer or Project Grafana Viewer roles. Depending on the level of access and permissions you need, you might obtain Grafana roles in an organization or a project.
Alternatively, to get the permissions that you need to query logs from the Log Query API, ask your Project IAM Admin to grant you the Log Query API Querier role in your project namespace.
For more information about these roles, see Prepare IAM permissions.
Build queries for your logs
Querying logs from the UI of the system monitoring instance lets you choose the data source to retrieve operational logs from your project and get an integrated view of your queries. To filter results, search for logs by labels using query language expressions. For example, you can set the cluster and namespace labels in your queries to the values that identify your cluster and project namespace, respectively.
System monitoring instance endpoint
For Application Operator (AO)
The following URL is the endpoint of the monitoring instance of your project:
https://GDC_URL/PROJECT_NAMESPACE/grafana
Replace the following:
- GDC_URL: The URL of your organization in GDC.
- PROJECT_NAMESPACE: The namespace of your project.
For Platform Admin (PA)
The following URL is the endpoint of the monitoring instance of your project:
https://GDC_URL/platform-obs/grafana
Replace GDC_URL with the URL of your organization in GDC.
Query and filter your logs
Select one of the following methods to build queries and filter logs from your project workloads:
This section describes how to access your logs using the Log panel in Grafana.
Identify your Grafana endpoint
For Application Operator (AO)
The following URL is the endpoint of the monitoring instance of your project:
https://GDC_URL/PROJECT_NAMESPACE/grafana
Replace the following:
- GDC_URL: The URL of your organization in GDC.
- PROJECT_NAMESPACE: The namespace of your project.
For Platform Admin (PA)
The following URL is the endpoint of the monitoring instance of your project:
https://GDC_URL/platform-obs/grafana
Replace GDC_URL with the URL of your organization in GDC.
View logs in the Grafana user interface
Query logs in the Grafana user interface:
- In the GDC console, select your project.
- In the navigation menu, select Operations > Logging.
- Click View all in Grafana Loki.
A new page opens your Grafana endpoint and displays the user interface.
- On the user interface, click explore Explore from the navigation menu to open the Explore page.
- From the menu at the Explore bar, select a data source to retrieve logs, according to your universe type:
Single-zone universes: Select one of the following data sources to display logging data from the single zone of your universe:
Operational logs: Display operational logs.
Audit logs: Display audit logs.
Operational logs ZONE_NAME: Display perational logs from a particular zone.
Audit logs ZONE_NAME: Display audit logs from a particular zone.
Additionally, to have cross-zone data visualizations in a single dashboard and add multiple zones to your query, select Mixed as the data source.
Enter a query to search for logs from the Log panel using LogQL (Log Query Language) expressions. You can do this step in either of the following ways:
- Use the interactive query-builder interface. Then, click Run query.
- Enter your query directly in the text field and press Shift+Enter to run the query.
The page displays the logs matching your query. After querying logs, you can export them. Click Export to download logs in plain text or CSV formats. You can also select a time range for your logs.
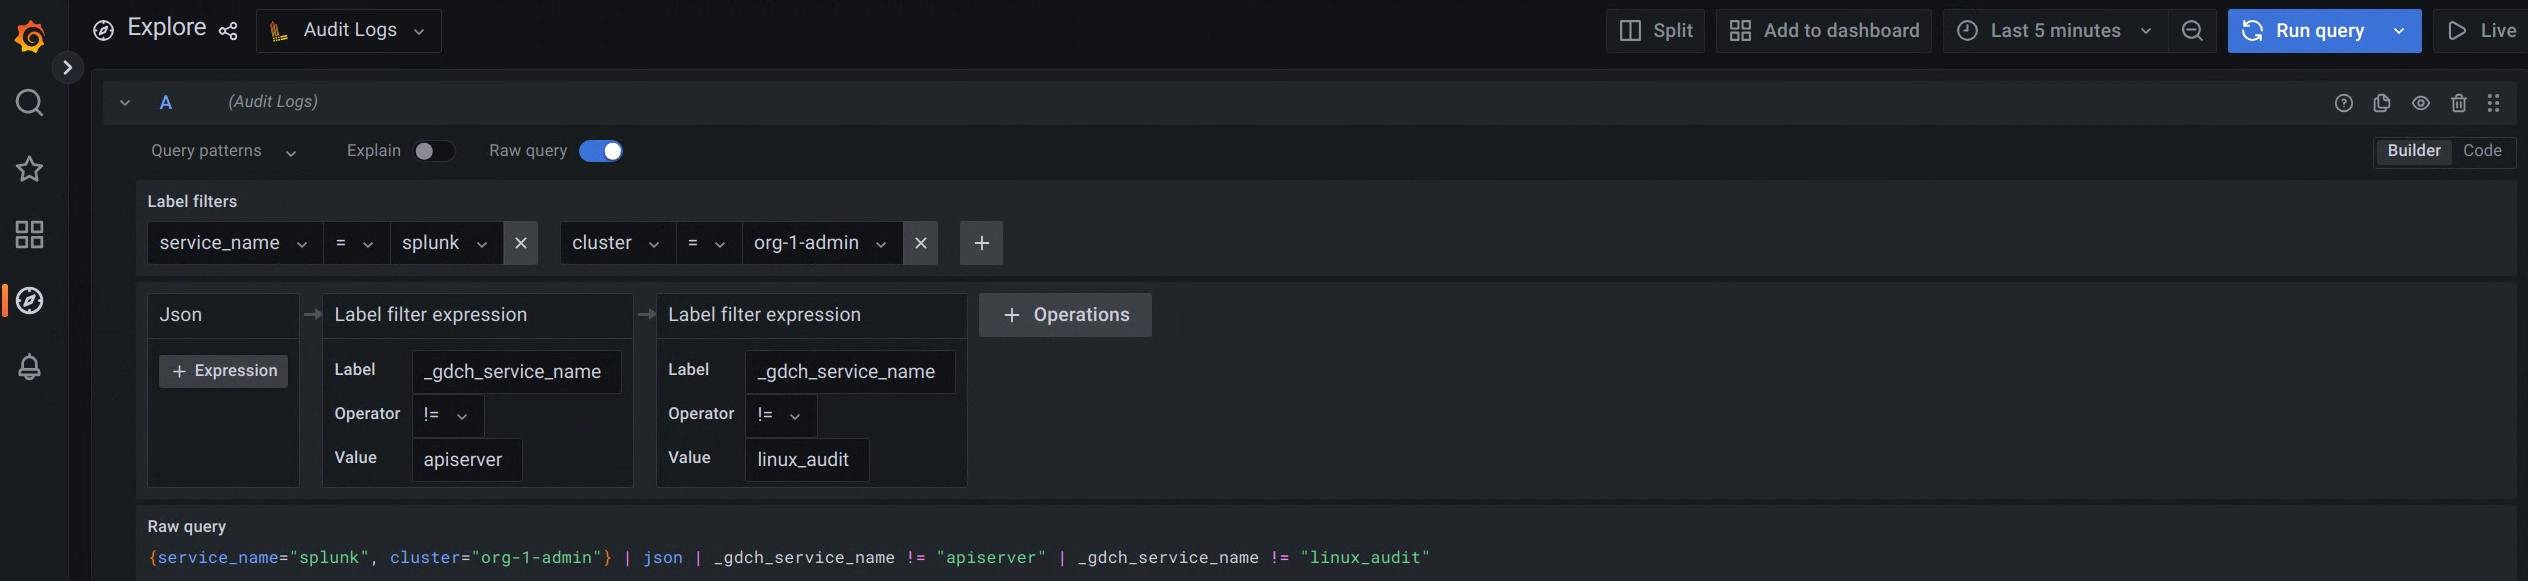
Figure 1. Menu option to query audit logs from the Grafana user interface.
In figure 1, the Audit logs option displays the interface that lets you build queries from Grafana to retrieve audit logs.
For examples of labels and values to query different logs, see Sample queries and labels.
Select a time range for your logs
To query logs in a time range, follow these steps:
Click the Time Picker menu in Grafana.
From the menu, perform one of the following actions:
- Select relative time range options, for example, the last 30 minutes.
- Set custom absolute time ranges by choosing specific dates and times from the calendar and clicking Apply time range.
Optionally, click Change time settings to change the Timezone and Fiscal year settings from the time range controls.
Time settings are saved on a per-dashboard basis. For more information about queries over a range of time, see https://grafana.com/docs/loki/latest/reference/api/#query-loki-over-a-range-of-time.
Send a query
Send a query to the Log Query API endpoint using HTTP or gRPC clients.
HTTP
Follow the instructions to directly access the API with an HTTP client. You can rely on
kubectlto manage the authentication or handle the authentication yourself.Query the Log Query API using HTTP clients like
curl,wget, or an HTTP client that you create and manage. The following example uses thecurltool to query the API, and you can use a similar format forwgetcommands:Authenticate the cURL request:
- Download and install the gdcloud CLI.
Set the gdcloud
core/organization_console_urlproperty:gdcloud config set core/organization_console_url https://GDC_URLReplace
GDC_URLwith the URL of an organization in GDC.Sign in with the configured identity provider:
gdcloud auth loginUse your user and password to authenticate and sign in.
Export the identity token for the specified account to an environment variable:
export TOKEN="$($HOME/gdcloud auth print-identity-token --audiences=https://LOG_QUERY_API_ENDPOINT)"Replace
LOG_QUERY_API_ENDPOINTwith the Log Query API endpoint from where you want to query logs and the domain you want to connect to. Therefore, the value for theaudiencesflag can be, for example,https://operational-log-query-api.org-1.zone1.google.gdch.test.When the login is successful, you can use the authorization header in your cURL request through the
gdcloud auth print-identity-tokencommand. For more information, see gdcloud auth print-identity-token.
If you want to list all labels for a project, send the following query:
curl -H "Authorization: Bearer ${TOKEN}" \
https://LOG_QUERY_API_ENDPOINT/v1/projects/PROJECT_NAMESPACE/labels \
-H "Content-Type: application/json" -v
Replace the following:
LOG_QUERY_API_ENDPOINT: the Log Query API endpoint from where you want to query logs.PROJECT_NAMESPACE: your project namespace.
If you want to list specific label values for a project, send the following query:
curl -H "Authorization: Bearer ${TOKEN}" \
https://LOG_QUERY_API_ENDPOINT/v1/projects/PROJECT_NAMESPACE/labels/labels/LABEL/values \
-H "Content-Type: application/json" -v
Replace the following:
LOG_QUERY_API_ENDPOINT: the Log Query API endpoint from where you want to query logs.PROJECT_NAMESPACE: your project namespace.LABEL: the specific label for which you want to query its value.
If you want to query logs for a specific project, construct a
logs_filterquery and include it in the body of the request:curl -X GET -H "Authorization: Bearer ${TOKEN}" \ https://LOG_QUERY_API_ENDPOINT/v1/projects/PROJECT_NAMESPACE/logs \ -H "Content-Type: application/json" -d \ '{"logs_filter": {"labels_equal": {"LABEL": "LABEL_VALUE"}}}' -vReplace the following:
LOG_QUERY_API_ENDPOINT: the Log Query API endpoint from where you want to query logs.PROJECT_NAMESPACE: your project namespace.LABEL: the specific label for which you want to query logs.LABEL_VALUE: the label value for which you want to query logs.
Refer to the API documentation to see all options for constructing a
logs_filterquery.
gRPC
gRPC is widely supported across programming languages and provides a more efficient communication method compared to HTTP clients.
To query logs using gRPC, you must meet the following prerequisites:
- Create your own client library based on Google-supplied protocol buffers.
- Implement authentication in the client.
- Implement retries.
For information about the protocol buffers, see the API documentation.
The following example shows how to query logs from a Go program using a non-authenticated gRPC client. The example assumes you created a golang package that includes a Bazel build file to import code dependencies:
Save the following code to a Go program named
client.go:package main import ( "context" "crypto/tls" "flag" "fmt" "google.golang.org/grpc/credentials" "google.golang.org/grpc/metadata" pb "<import path to generated log query api protos>/pkg/apis/public/logging/v1/proto" "google.golang.org/grpc" ) var serverAddr = flag.String("server", "localhost:8080", "server address") func main() { flag.Parse() tc := credentials.NewTLS(&tls.Config{InsecureSkipVerify: true}) conn, err := grpc.Dial(*serverAddr, grpc.WithTransportCredentials(tc)) if err != nil { panic(error.Error(fmt.Errorf("create client connection failed: %v", err))) } defer conn.Close() c := pb.NewLogsClient(conn) md := metadata.Pairs("clienttest", "test") ctx := metadata.NewOutgoingContext(context.Background(), md) err = listLabels(ctx, c, "project-foo") if err != nil { panic(error.Error(err)) } if err := listLabelValues(ctx, c, "project-foo", "resource-bar"); err != nil { panic(error.Error(err)) } if err := listLogs(ctx, c, "project-foo", &pb.ListLogsFilter{ LabelsEqual: map[string]string{"resource-bar": "resource-bar-value"}, OrderAscending: true, }); err != nil { panic(error.Error(err)) } } // List all labels for a project. func listLabels(ctx context.Context, c pb.LogsClient, project string) error { lbr := &pb.ListLabelsRequest{ Parent: project, PageSize: 1000, // PageSize can be configured to limit the number of responses per page. } resp, err := c.ListLabels(ctx, lbr) if err != nil { return fmt.Errorf("list labels: %v", err) } fmt.Printf("%v", resp) return nil } // List specific label values for a project. func listLabelValues(ctx context.Context, c pb.LogsClient, project string, label string) error { lbr := &pb.ListLabelValuesRequest{ Parent: project, Label: label, PageSize: 1000, // PageSize can be configured to limit the number of responses per page. } resp, err := c.ListLabelValues(ctx, lbr) if err != nil { return fmt.Errorf("list label values: %v", err) } fmt.Printf("%v", resp) return nil } // List logs for a specific project. func listLogs(ctx context.Context, c pb.LogsClient, project string, lf *pb.ListLogsFilter) error { lbr := &pb.ListLogsRequest{ Parent: project, LogsFilter: lf, PageSize: 5, // PageSize can be configured to limit the number of responses per page. } resp, err := c.ListLogs(ctx, lbr) if err != nil { return fmt.Errorf("list logs: %v", err) } fmt.Printf("logs: %v", resp) return nil }Run the Go program:
go run PATH_TO_API/client.go -server=LOG_QUERY_API_ENDPOINT:443Replace the following:
PATH_TO_API: the path to the API file.LOG_QUERY_API_ENDPOINT: the Log Query API endpoint from where you want to query logs.
If the server flag is not specified, the default request gets to
localhost.
Sample queries and labels
The following are some of the default labels that you can use to query logs:
cluster: the name of the cluster.namespace: your project namespace.node: the node name.pod: the pod name.container: the container name.
The following code samples show the use of labels and values to query different logs:
Select server logs:
{cluster="admin", namespace="kube-system", resources="k8s_container", container="kube-apiserver"}Select cluster audit logs:
{cluster="admin", resources="k8s_audit"}