This page outlines how to troubleshoot appliance inaccessibility issues post-bootstrapping. You might encounter the following issues:
- Error messages such as
Unable to connect to the server: dial tcp 198.18.0.64:443: i/o timeoutwhen attempting to query using kubectl. Webpage not availableerror when trying to access the UI.- Deployed applications on the appliance are not working, or you cannot deploy any new applications.
Troubleshooting UI inaccessible issue
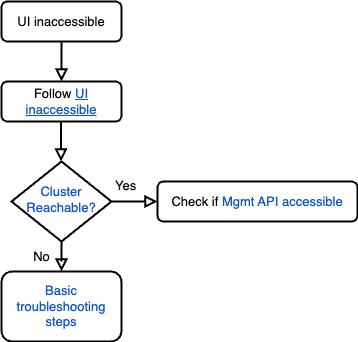
- Follow the UI inaccessible runbook to troubleshoot the issue.
- Check if the cluster is reachable by following the Cluster reachability section.
- If the cluster is responsive, verify if the management API is accessible by following the Management API accessible section.
- If the cluster is not reachable and returns errors like
Connection timed outori/o timeout error, refer to the troubleshooting guide for further troubleshooting steps.
Basic troubleshooting steps
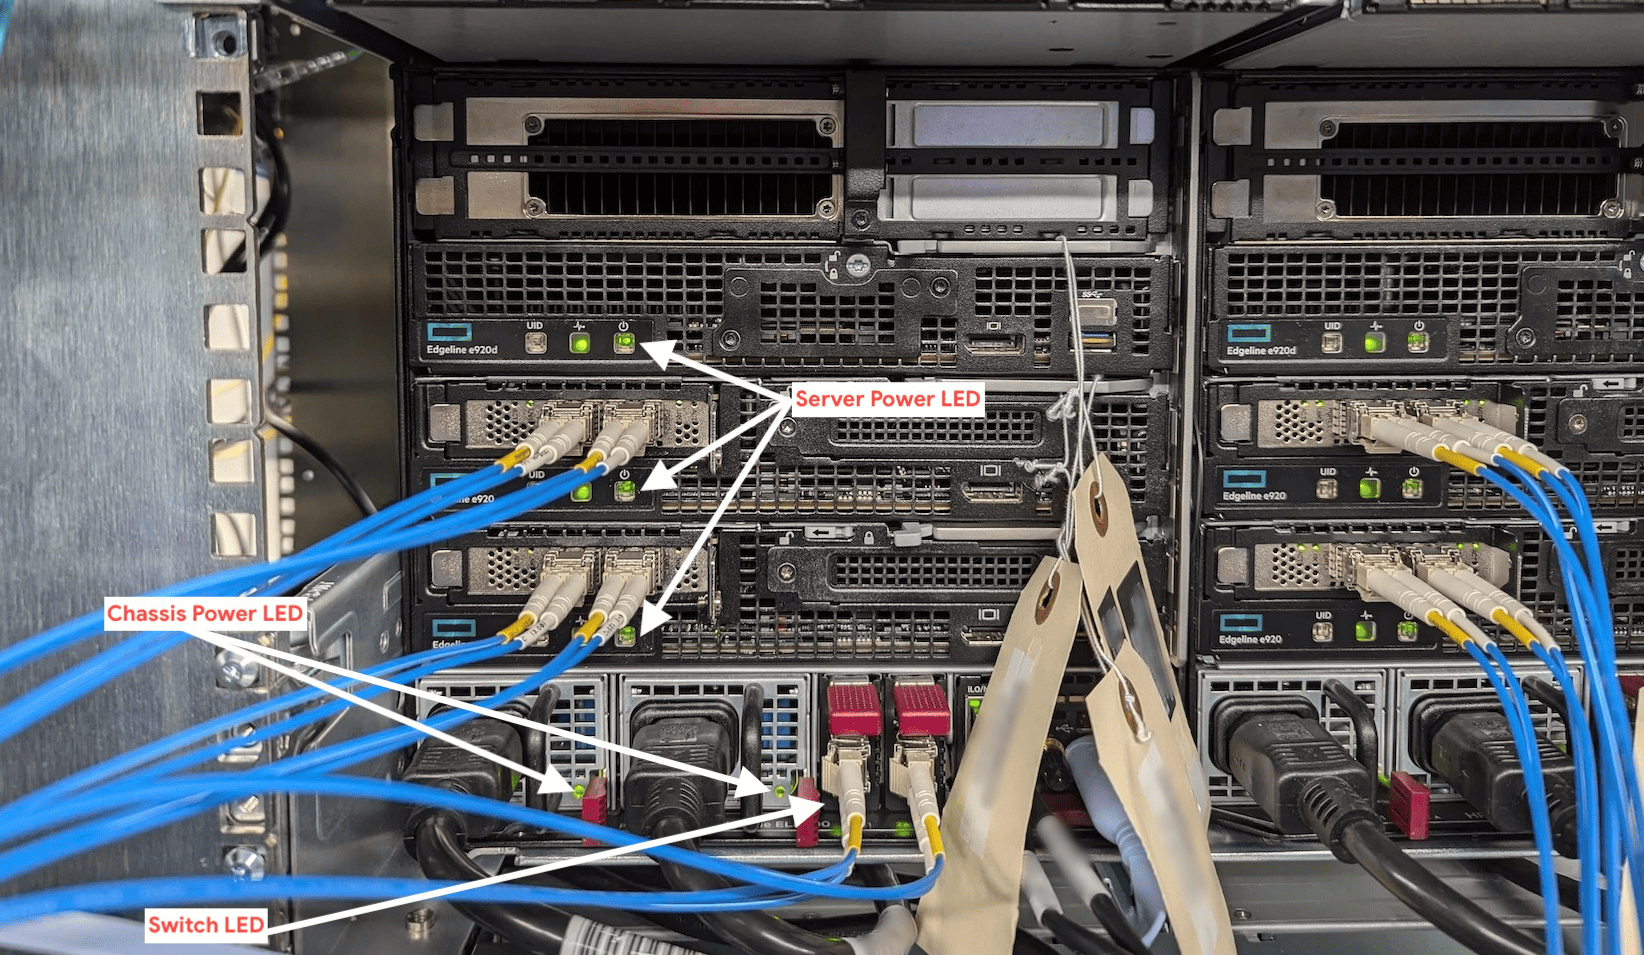
Verify the power supply of the chassis by checking if the indicator lights (green) on either of the two power supplies are illuminated, as indicated by the arrows in the image.
LED light status Description Solid Green System On and normal operation Flashing Green Standby power present (power supply off) Solid Amber Power supply failed (overvoltage/undervoltage, overtemperature, overcurrent, short-circuit), fan failed, or input overvoltage protection Flashing Amber Power supply error Off No power present or standby power failed (overvoltage/ undervoltage, overtemperature, overcurrent, short-circuit, fan lock) If the indicator lights are off, first ensure the power cord is receiving power. If the power cord is functioning properly, the power supplies are likely faulty and need to be replaced. For replacement instructions, refer to the Power Supply Replacement Guide.
If the power supplies are functioning but the device is still not working, check for any loose or damaged connections.
Verify the LEDs of the switch and servers are illuminated as indicated by the arrows in the image.
If the Link LED of the switch is solid green, verify it is operational by following Verify switch operational section.
If the switch health and configuration is correct, log in to iLO using the steps mentioned in Steps to log in to iLO. to check the health of the device.
- If any of the fans are critical, contact HPE support team to get a replacement of the critical fan and follow the Fan Replacement Guide to replace it.
- If any blades are powered off, turn them on by navigating to the Blades section, selecting the blade, and pressing the power button.
- If any of the blades are in a critical state, navigate to the Blades section, select the critical blade, go to the Power section, and initiate a Force System Reset.
- If the chassis health is critical, you can also try resetting the chassis by going to the Power and Thermal tab. Select the Management Power section, click Reset EL8000CM Button. This process resets the chassis manager firmware and might take a few minutes, during which the chassis is unavailable.
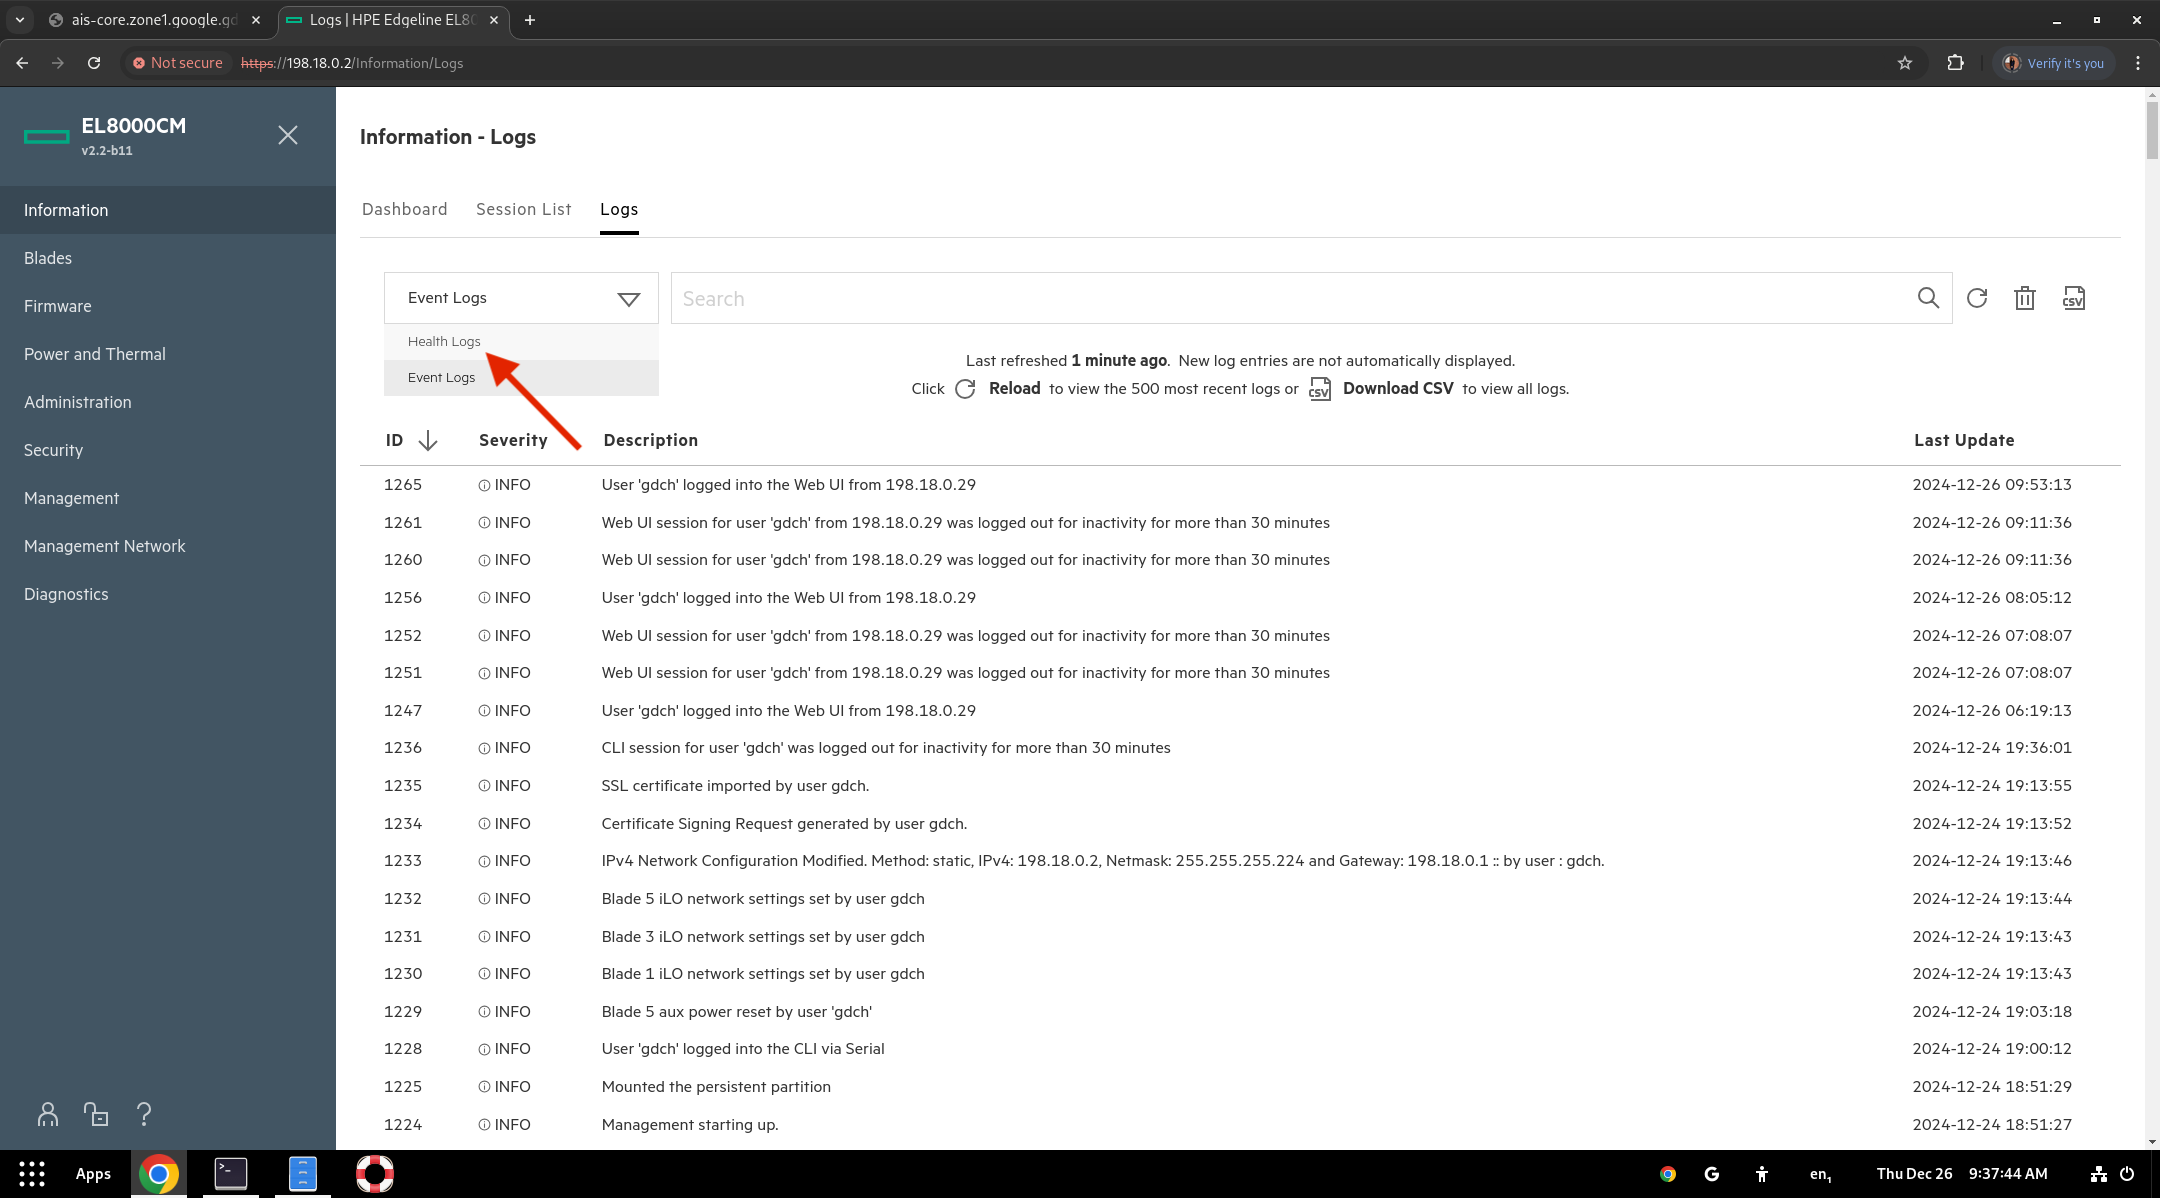
- If the issue persists, go to the Information tab, select Logs, choose Health Logs from the drop-down menu, and download them as a CSV file. Raise a ticket with Google and attach the logs to request hardware replacement.
If the Power LEDs on the blades are illuminated, perform a ping test to the following blade IP addresses from a machine connected to the appliance:
    ping 198.18.0.7  //BM01
    ping 198.18.0.8  //BM02
    ping 198.18.0.9  //BM03
If the ping test is successful, it indicates that the nodes are operational.
If all the nodes fail the ping test, escalate to Google Support.
If the issue persists after following all the steps outlined in this section, escalate the issue to Google Support for further assistance.
Loose or damaged connections
Verify that all connections are secure and properly seated. For guidance on checking and securing cable connections within the appliance, refer to check cables.
Inspect the cables for any visible damage. If any cables are damaged, replace them.
Verify switch operational
Sign in to the switch's serial console. If the login is successful, run the following command to check the health of the switch. This command displays the uptime and resource consumption of the switch.
show versionIf the serial console is responsive, validate the BGP configuration on the switch by referring to Validate BGP Summary.
If the Link LED is off or the serial console is unresponsive, the switch might be faulty. Escalate the issue to Google Support for a replacement.
Verify cluster reachability
Log in to the gdcloud session with IO credentials:
gdcloud auth loginIf you are unable to log in, locate the emergency credential backed up during the appliance setup to be used with the command -: root-admin-kubeconfig.
Check if the cluster is reachable:
kubectl --kubeconfig root-admin-kubeconfig get servers -A
Verify Management API accessibility
Log in to the gdcloud session with IO credentials:
gdcloud auth loginIf the login fails, log in with management plane credentials.
The AIS database can sometimes malfunction or be misconfigured causing login failure. Refer to IAM-R0009 - AIS Database.
If you are unable to resolve issues with login, locate the emergency credential backed up during the appliance setup to be used with the command -: root-admin-kubeconfig.
Fetch the management plane kubeconfig:
kubectl --kubeconfig root-admin-kubeconfig -n management-kube-system get secret kube-admin-remote-kubeconfig -ojsonpath='{.data.value}' | base64 -d > kube-admin-remote-kubeconfigGet the health status of the cluster:
kubectl --kubeconfig kube-admin-remote-kubeconfig get --raw='/readyz?verbose'