You can create a Monitoring alert that notifies you when a Dataproc cluster or job metric exceeds a specified threshold.
Create an alert
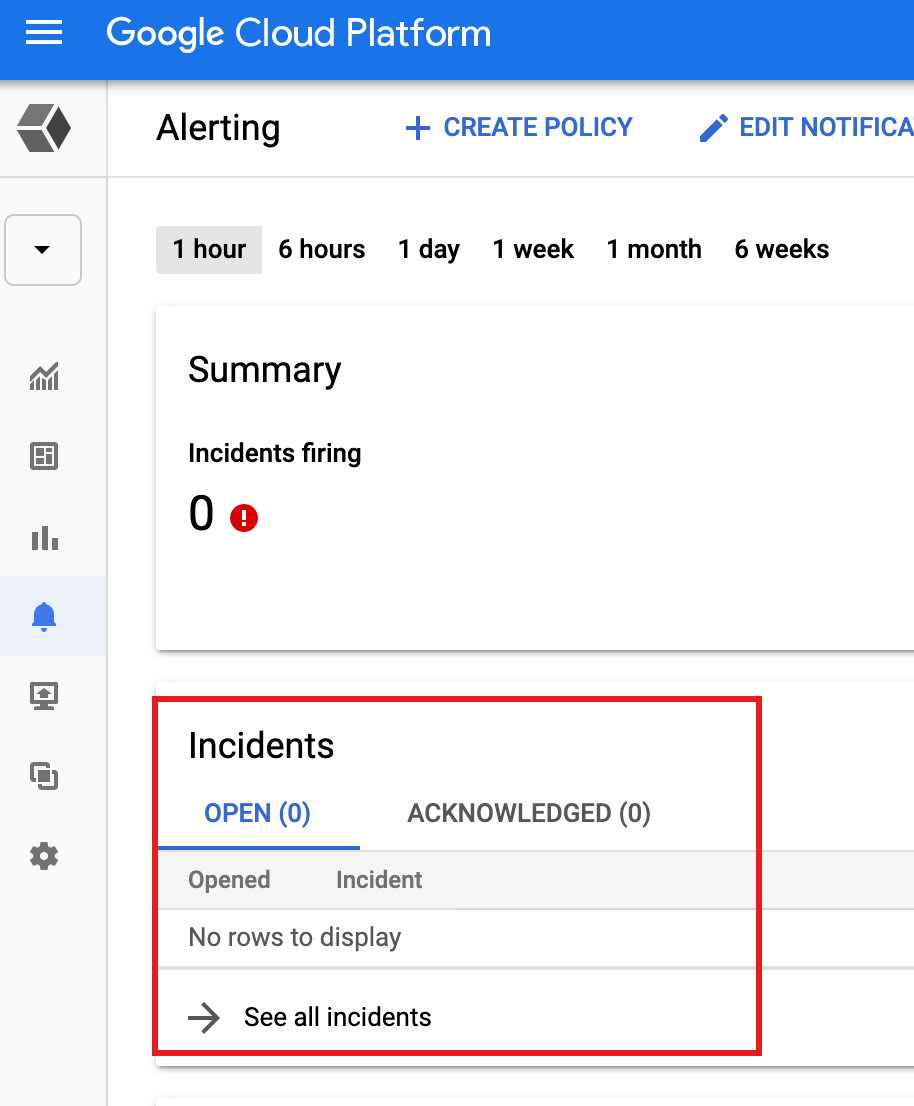
Open the Alerting page in the Google Cloud console.
Click + Create Policy to open the Create alerting policy page.
- Click Select Metric.
- In the "Filter by resource or metric name" input box, type "dataproc" to list Dataproc metrics. Navigate through the hierarchy of Cloud Dataproc metrics to select a cluster, job, batch, or session metric.
- Click Apply.
- Click Next to open the Configure alert trigger pane.
- Set a threshold value to trigger the alert.
- Click Next to open the Configure notifications and finalize alert pane.
- Set notification channels, documentation, and the alert policy name.
- Click Next to review the alert policy.
- Click Create Policy to create the alert.
Sample alerts
This section describes a sample alert for a job submitted to the Dataproc service and an alert for a job run as a YARN application.
Long-running Dataproc job alert
Dataproc emits the dataproc.googleapis.com/job/state metric,
which tracks how long a job has been in different states. This metric is found
under the Google Cloud console Metrics Explorer under the Cloud Dataproc Job
(cloud_dataproc_job) resource.
You can use this metric to set up an alert that notifies you when the job's
RUNNING state exceeds a duration threshold.
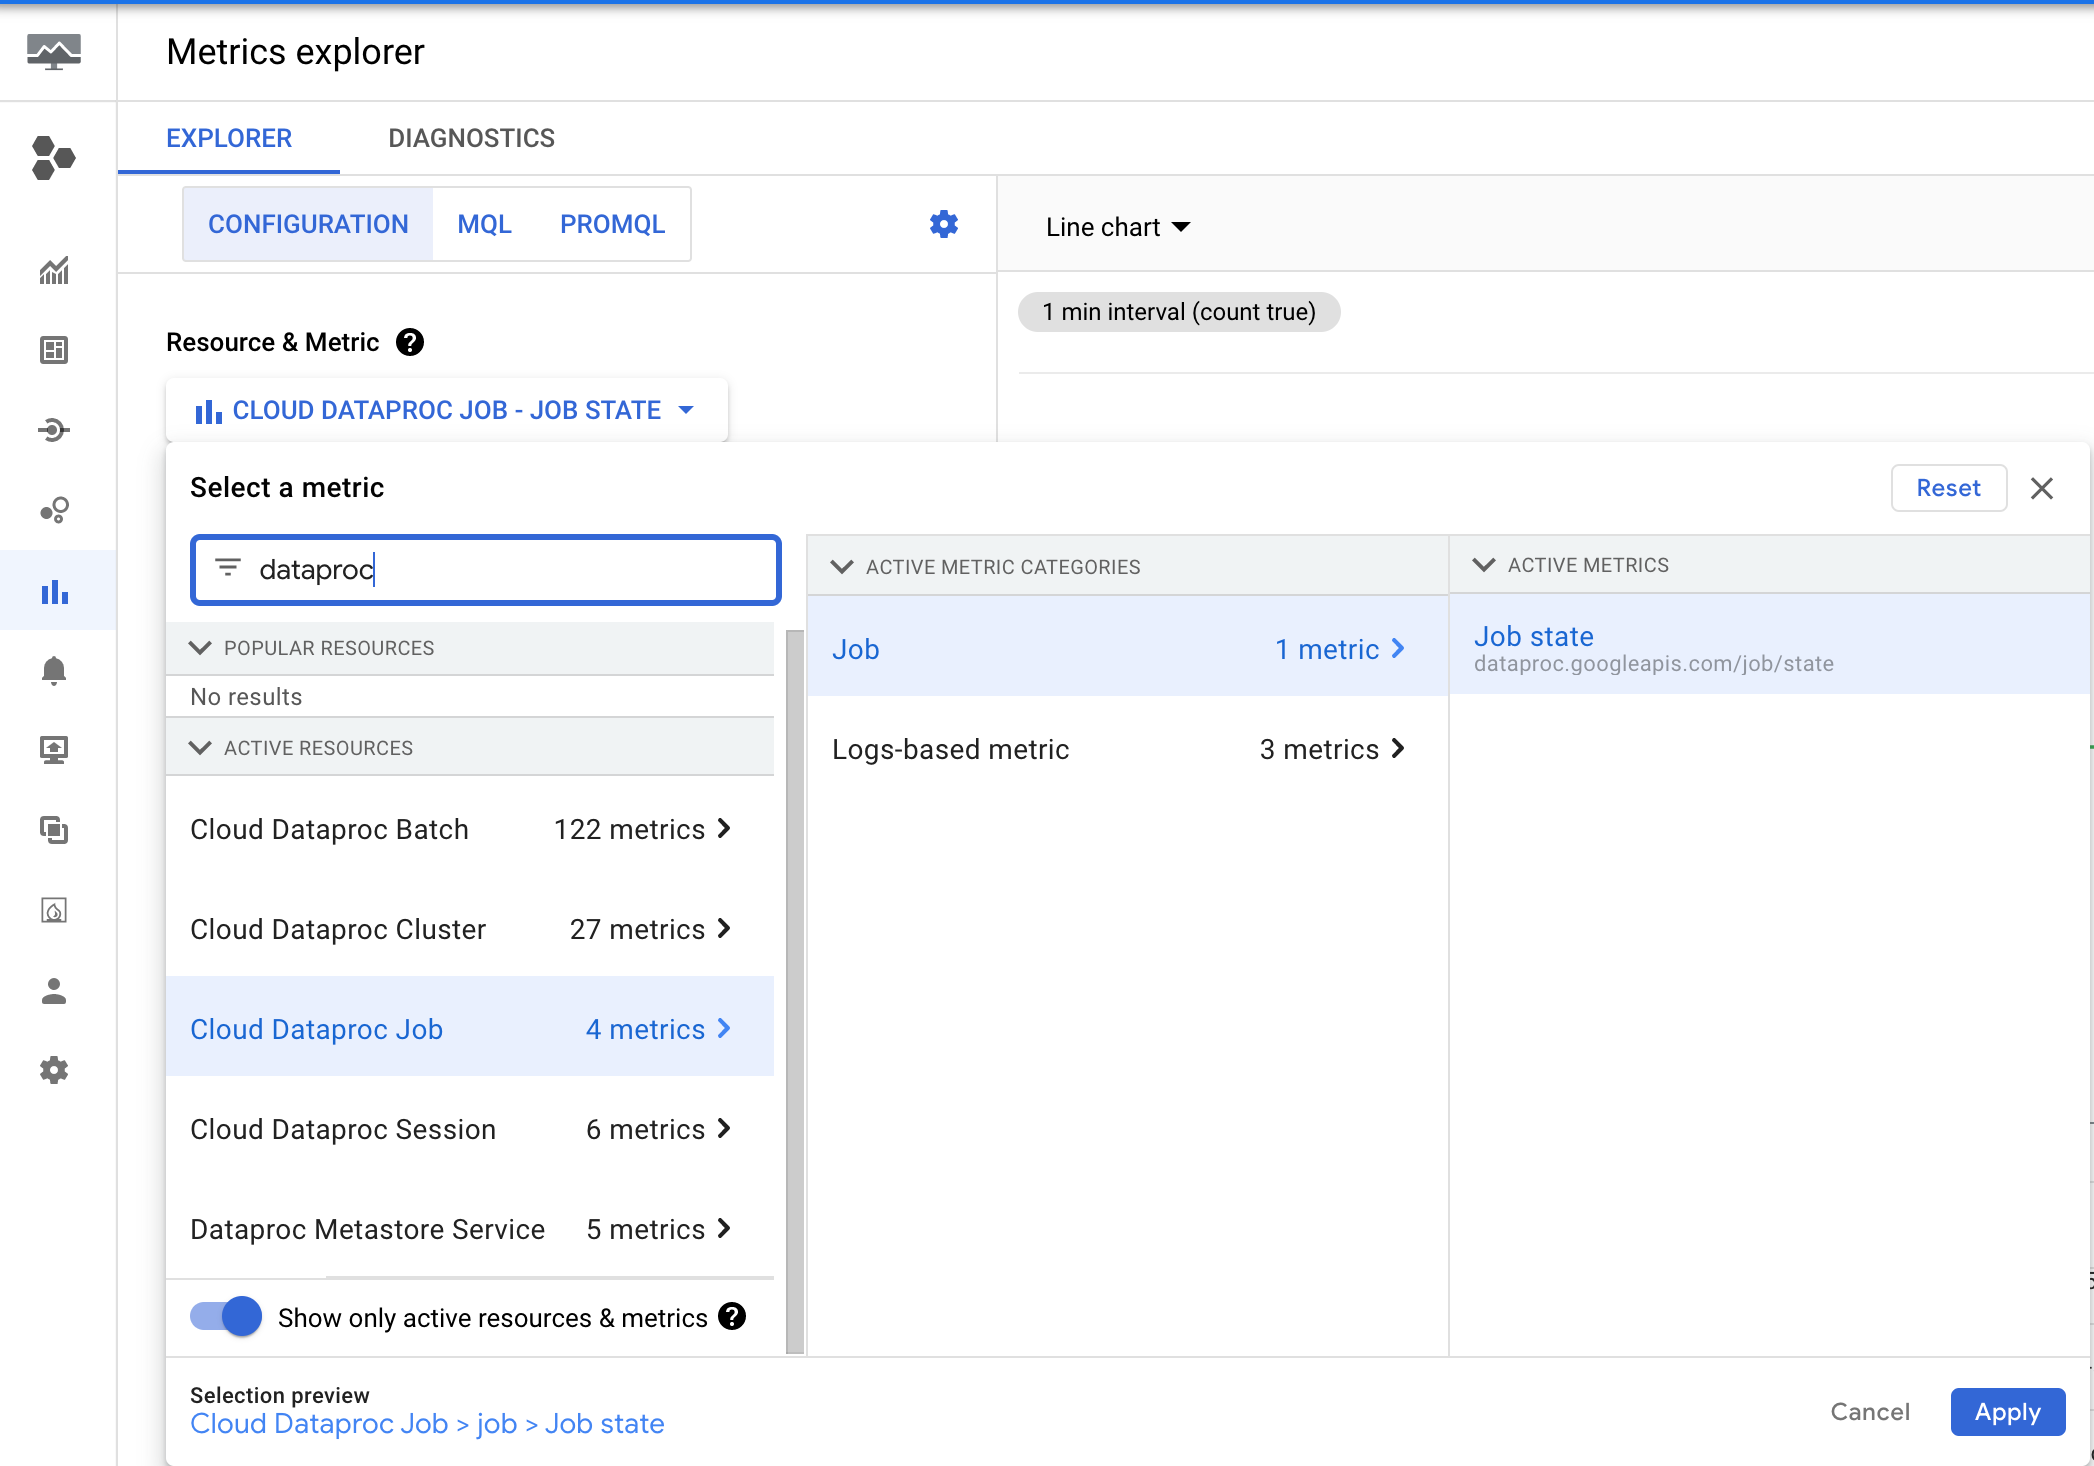
Job duration alert setup
This example uses the Monitoring Query Language (MQL) to create an alert policy (see Creating MQL alerting policies (console)).
fetch cloud_dataproc_job
| metric 'dataproc.googleapis.com/job/state'
| filter metric.state == 'RUNNING'
| group_by [resource.job_id, metric.state], 1m
| condition val() == true()
In the following example, the alert triggers when a job has been running for more than 30 minutes.
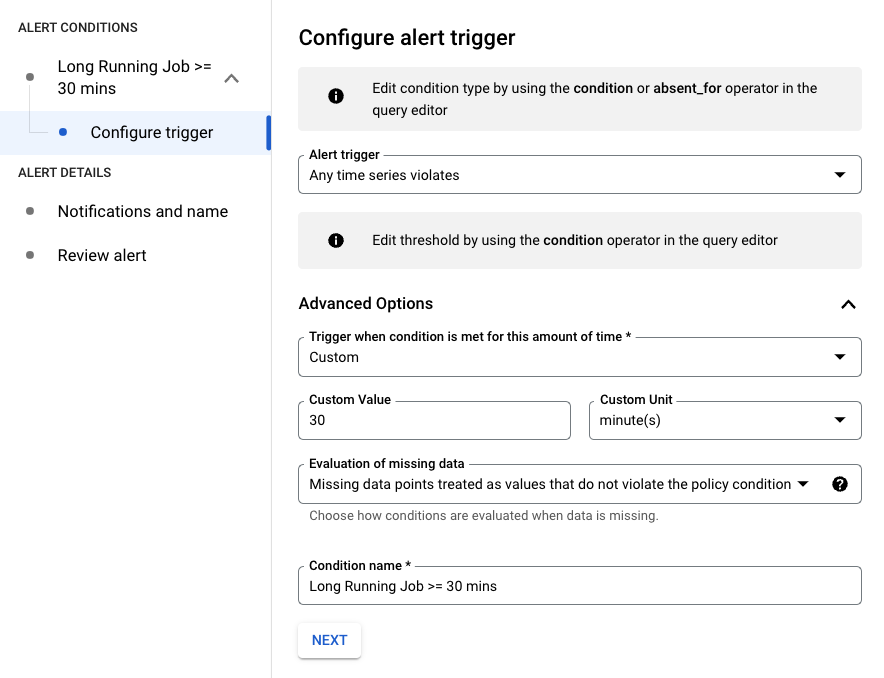
You can modify the query by filtering on the resource.job_id to apply it
to a specific job:
fetch cloud_dataproc_job
| metric 'dataproc.googleapis.com/job/state'
| filter (resource.job_id == '1234567890') && (metric.state == 'RUNNING')
| group_by [resource.job_id, metric.state], 1m
| condition val() == true()
Long-running YARN application alert
The previous sample shows an alert that is triggered when a Dataproc job runs longer
than a specified duration, but it only applies to jobs submitted to the Dataproc
service using the Google Cloud console, the Google Cloud CLI, or by direct calls to the
Dataproc jobs API. You can also use OSS metrics
to set up similar alerts that monitor the running time of YARN applications.
First, some background. YARN emits running time metrics into multiple buckets.
By default, YARN maintains 60, 300, and 1440 minutes as bucket thresholds
and emits 4 metrics, running_0, running_60, running_300 and running_1440:
running_0records the number of jobs with a runtime between 0 and 60 minutes.running_60records the number of jobs with a runtime between 60 and 300 minutes.running_300records the number of jobs with a runtime between 300 and 1440 minutes.running_1440records the number of jobs with a runtime greater than 1440 minutes.
For example, a job running for 72 minutes will be recorded in running_60, but not in running_0.
These default bucket thresholds can be modified by passing new values to the
yarn:yarn.resourcemanager.metrics.runtime.buckets
cluster property
during Dataproc cluster creation. When defining custom buckets thresholds,
you must also define metric overrides. For example, to specify bucket thresholds
of 30, 60, and 90 minutes, the gcloud dataproc clusters create command
should include the following flags:
bucket thresholds:
‑‑properties=yarn:yarn.resourcemanager.metrics.runtime.buckets=30,60,90metrics overrides:
‑‑metric-overrides=yarn:ResourceManager:QueueMetrics:running_0, yarn:ResourceManager:QueueMetrics:running_30,yarn:ResourceManager:QueueMetrics:running_60, yarn:ResourceManager:QueueMetrics:running_90
Sample cluster creation command
gcloud dataproc clusters create test-cluster  \
   --properties ^#^yarn:yarn.resourcemanager.metrics.runtime.buckets=30,60,90  \
   --metric-sources=yarn  \
   --metric-overrides=yarn:ResourceManager:QueueMetrics:running_0,yarn:ResourceManager:QueueMetrics:running_30,yarn:ResourceManager:QueueMetrics:running_60,yarn:ResourceManager:QueueMetrics:running_90
These metrics are listed in the Google Cloud console Metrics Explorer under the VM Instance (gce_instance) resource.
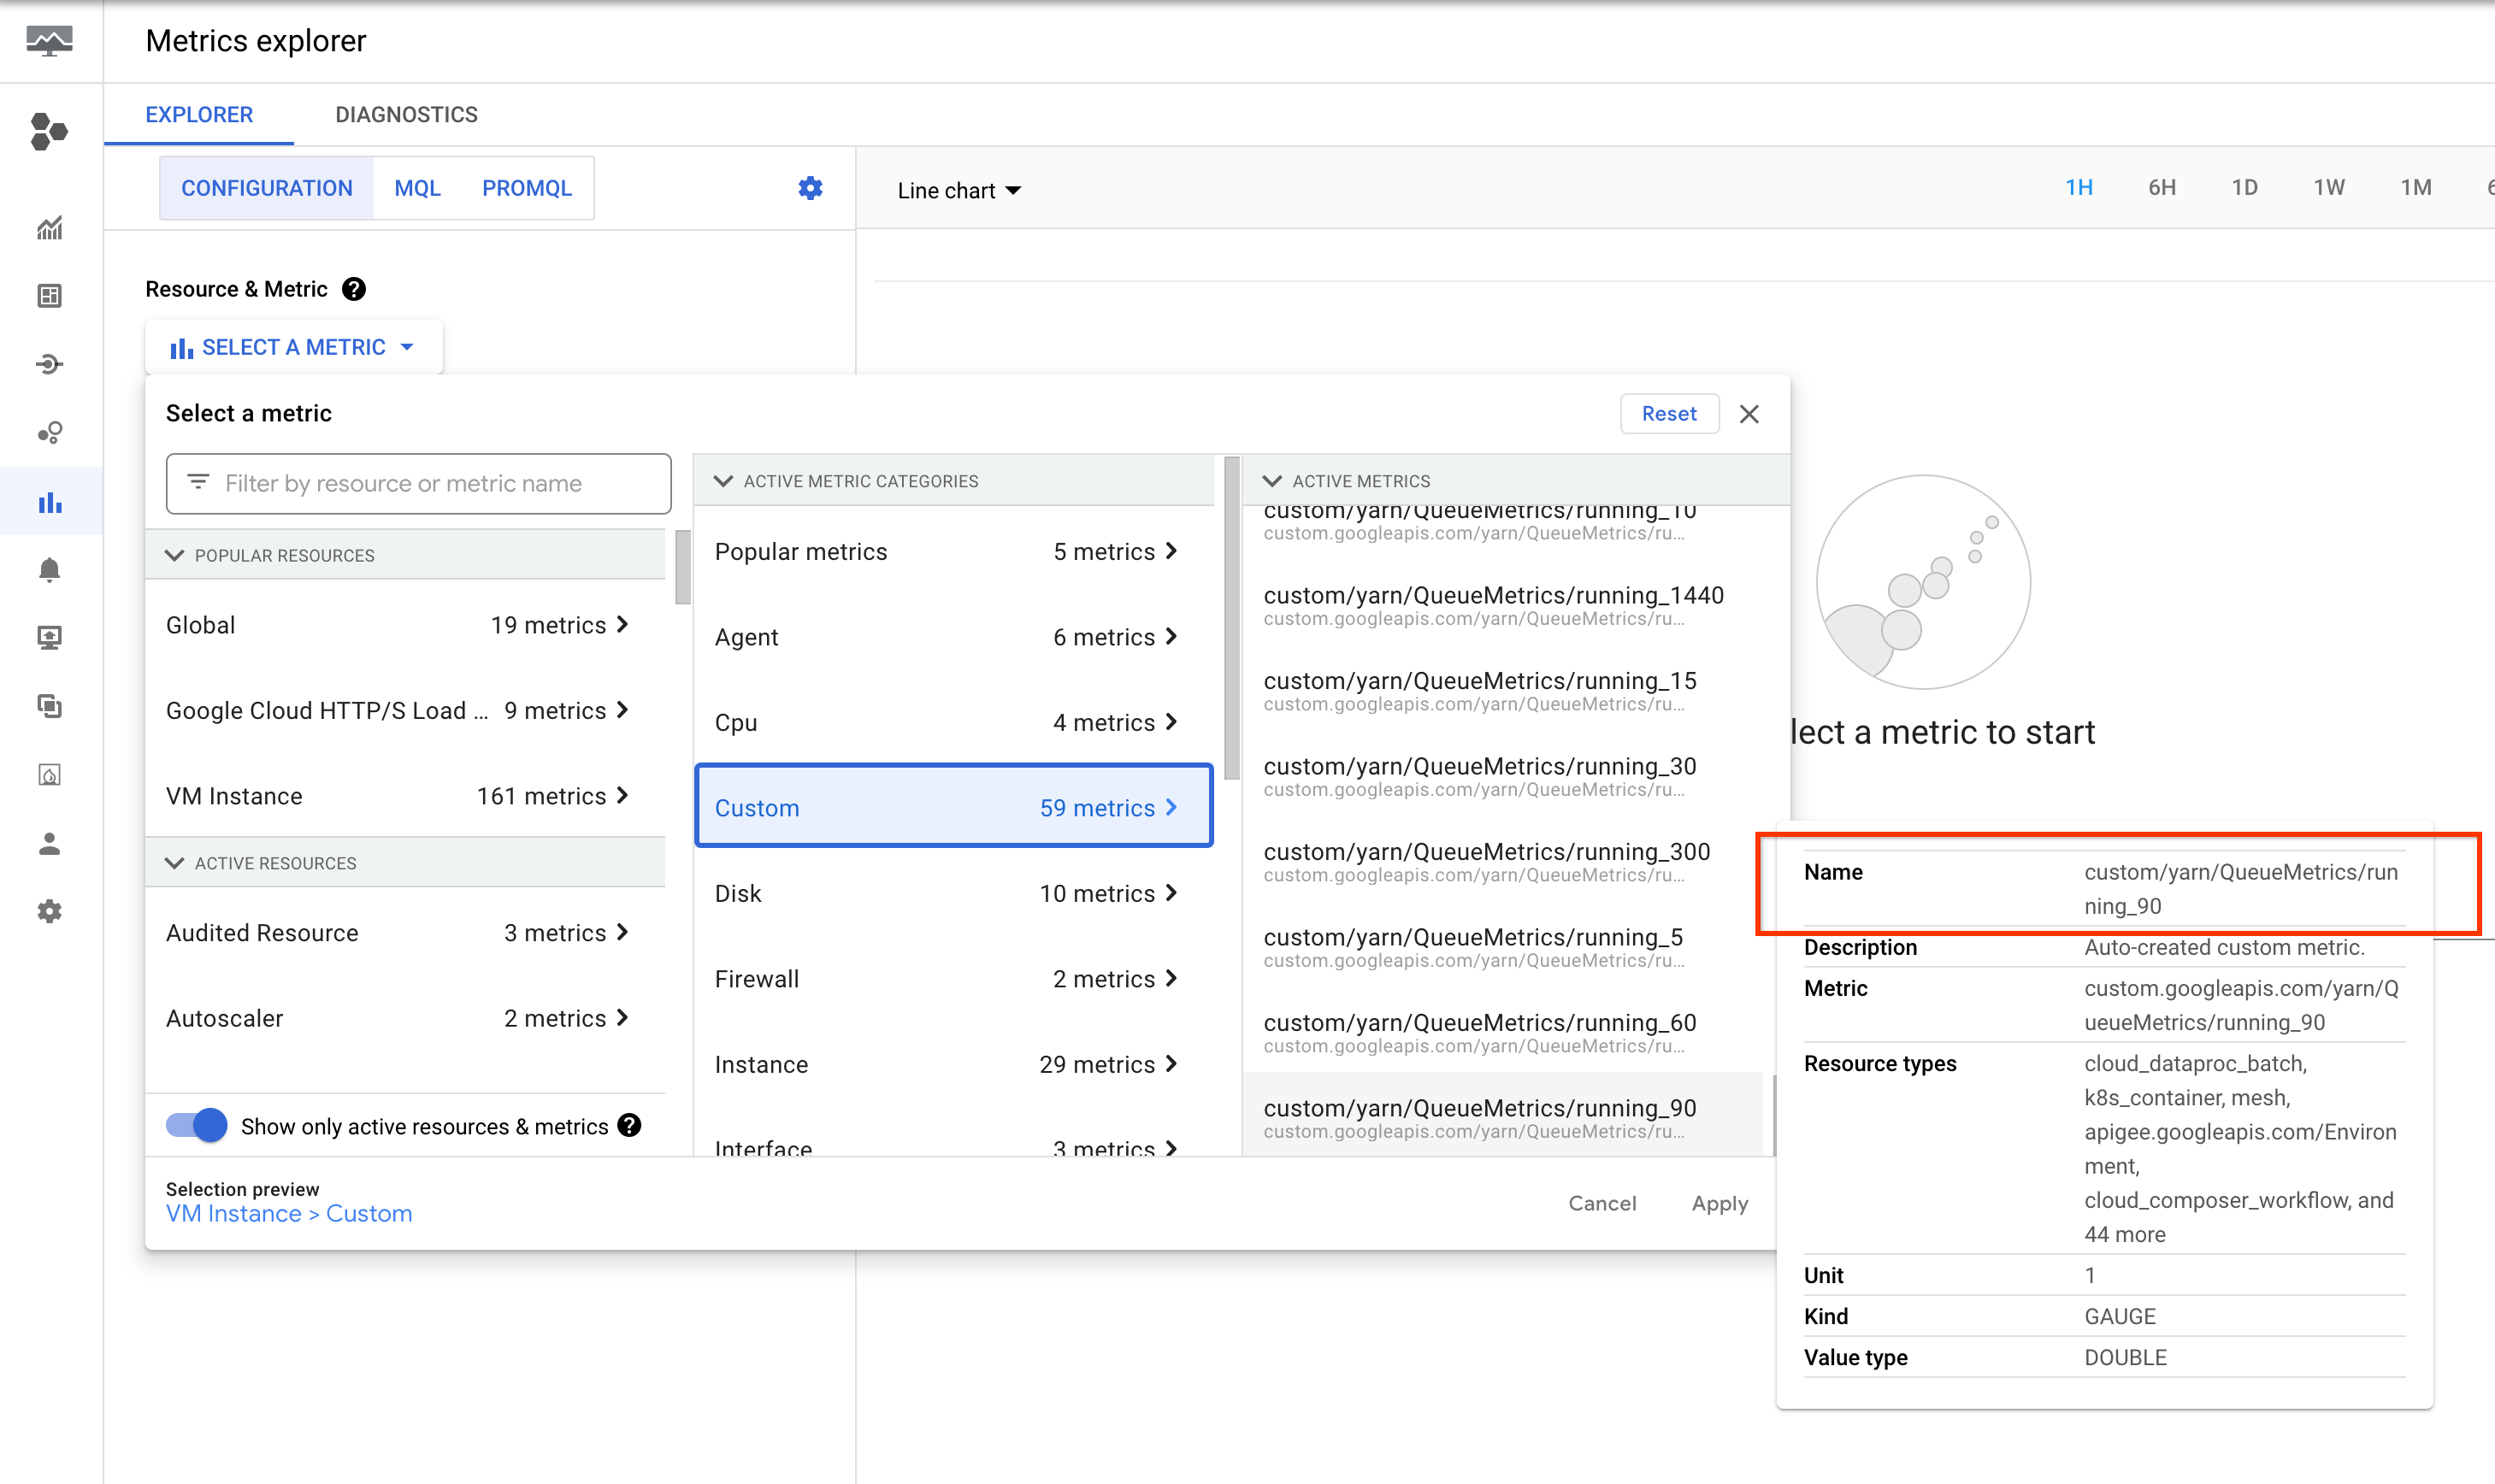
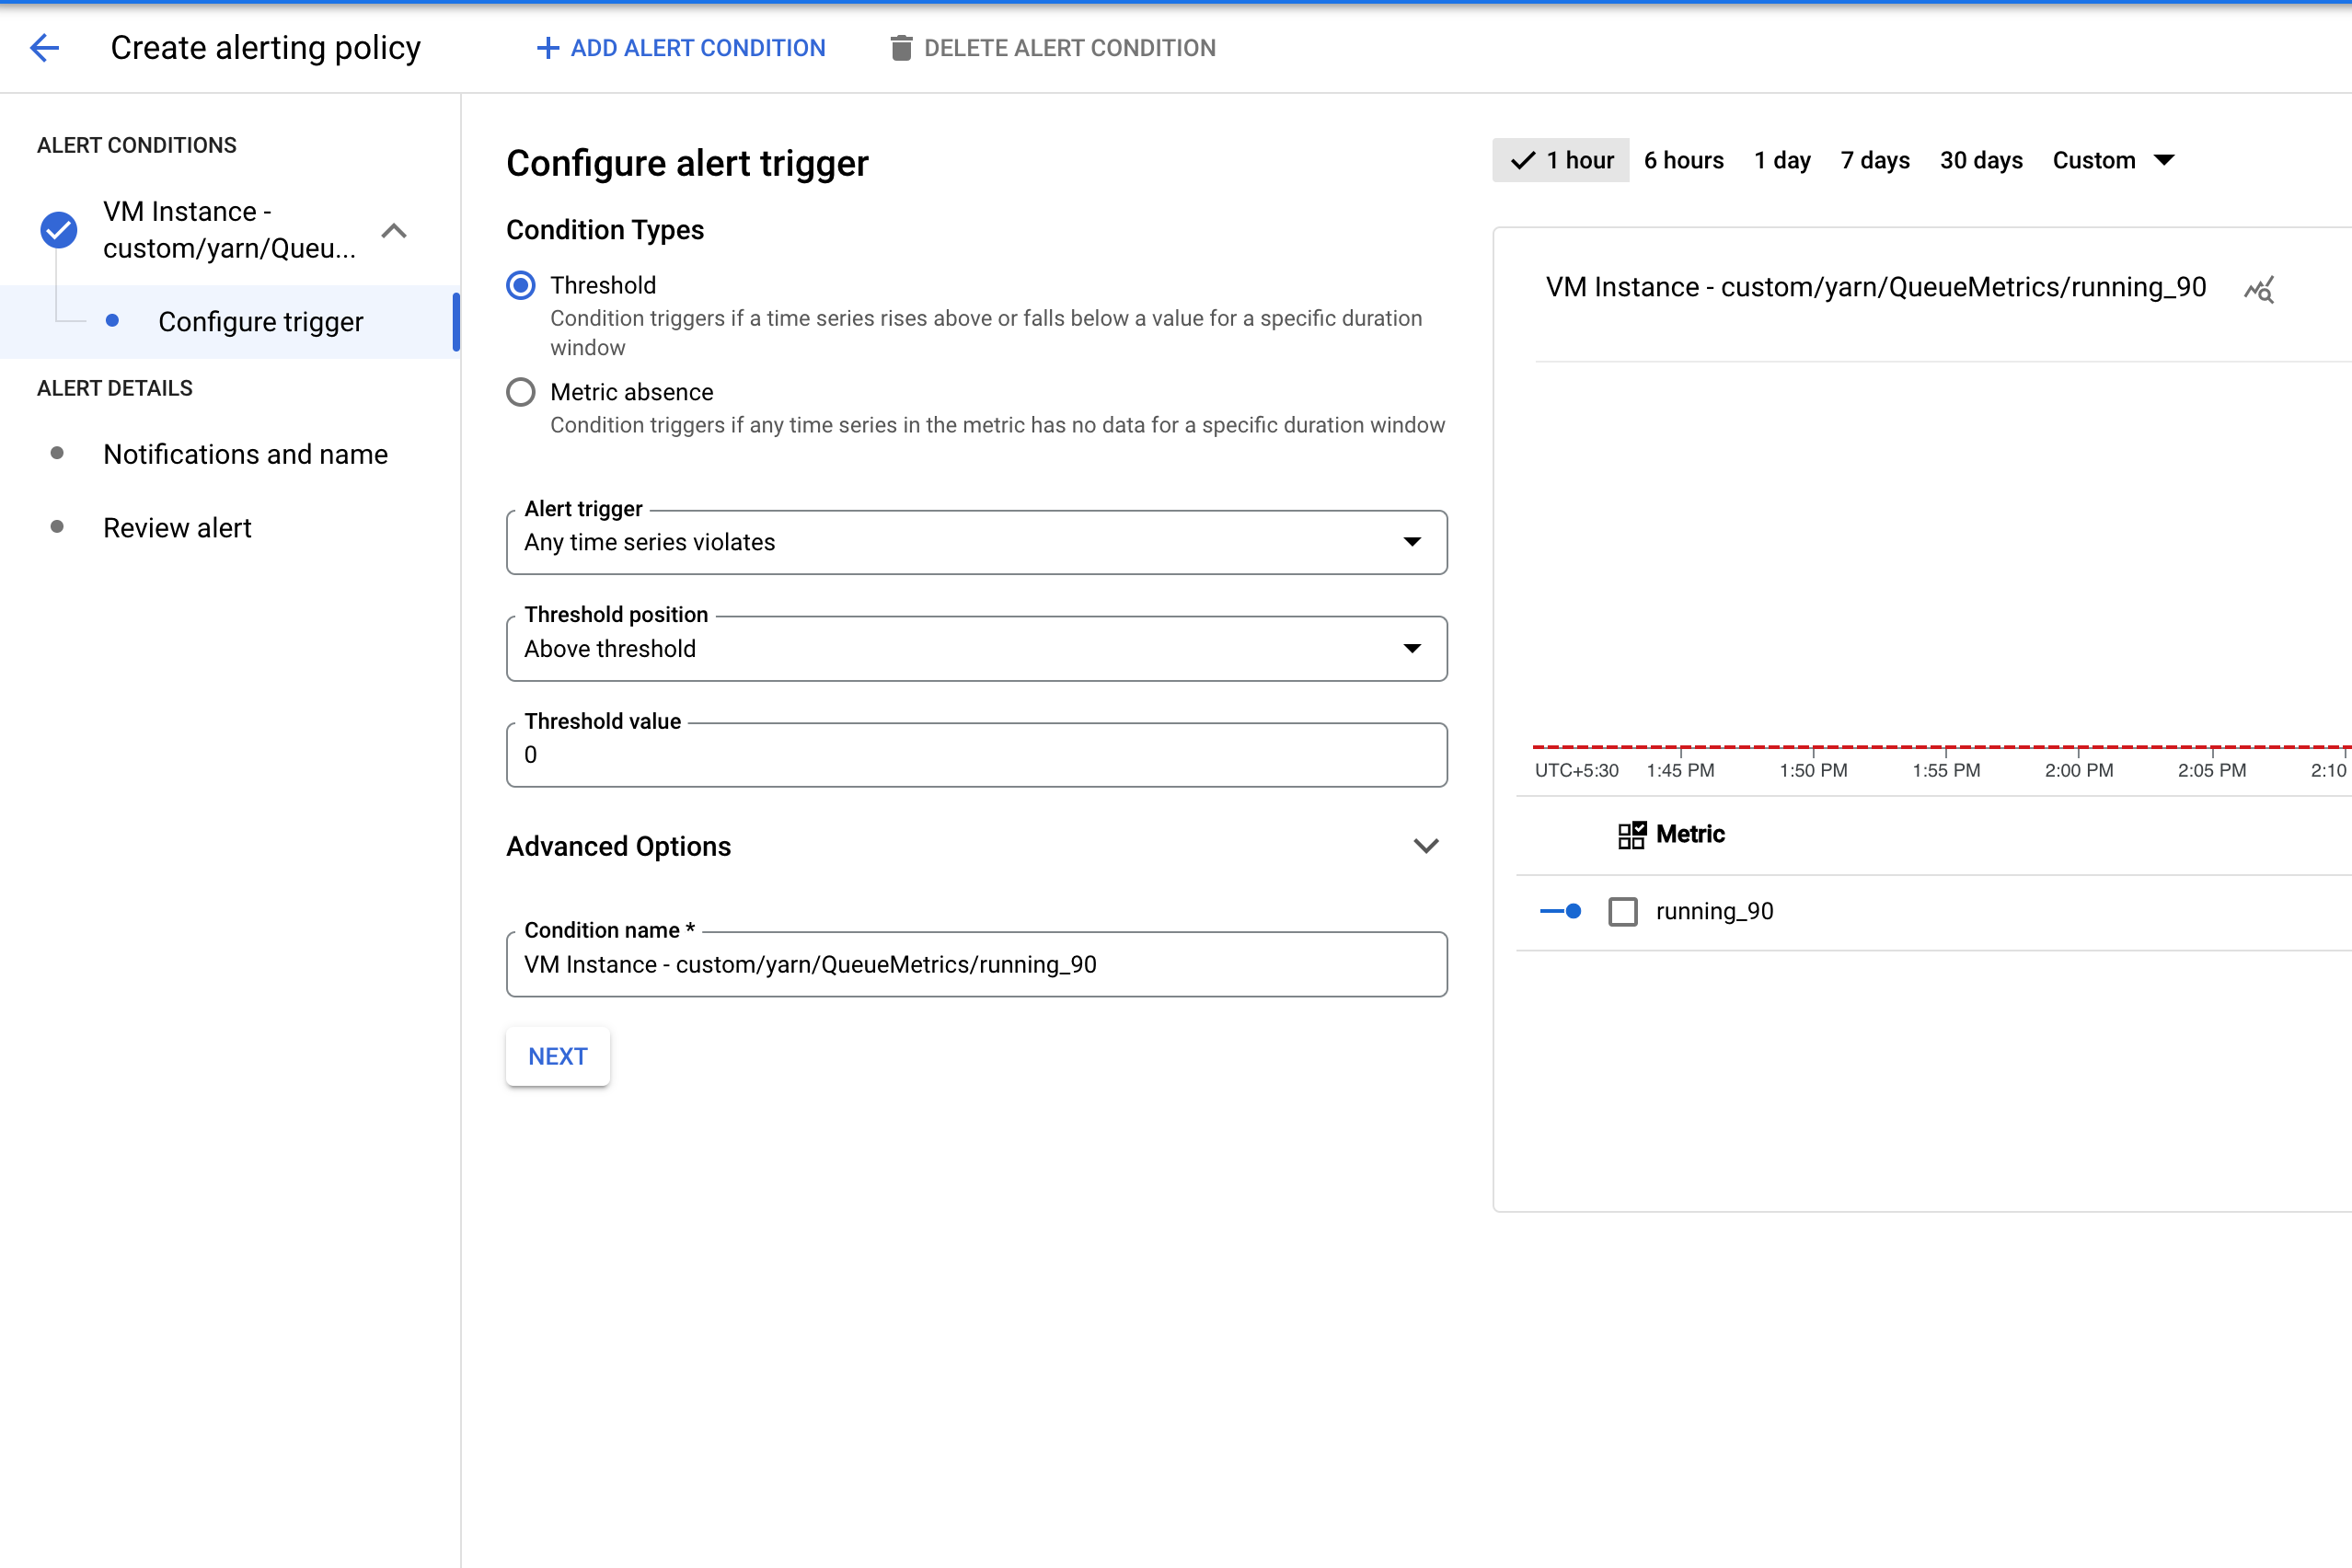
YARN application alert setup
Create a cluster with required buckets and metrics enabled .
Create an alert policy that triggers when the number of applications in a YARN metric bucket exceed a specified threshold.
Optionally, add a filter to alert on clusters that match a pattern.
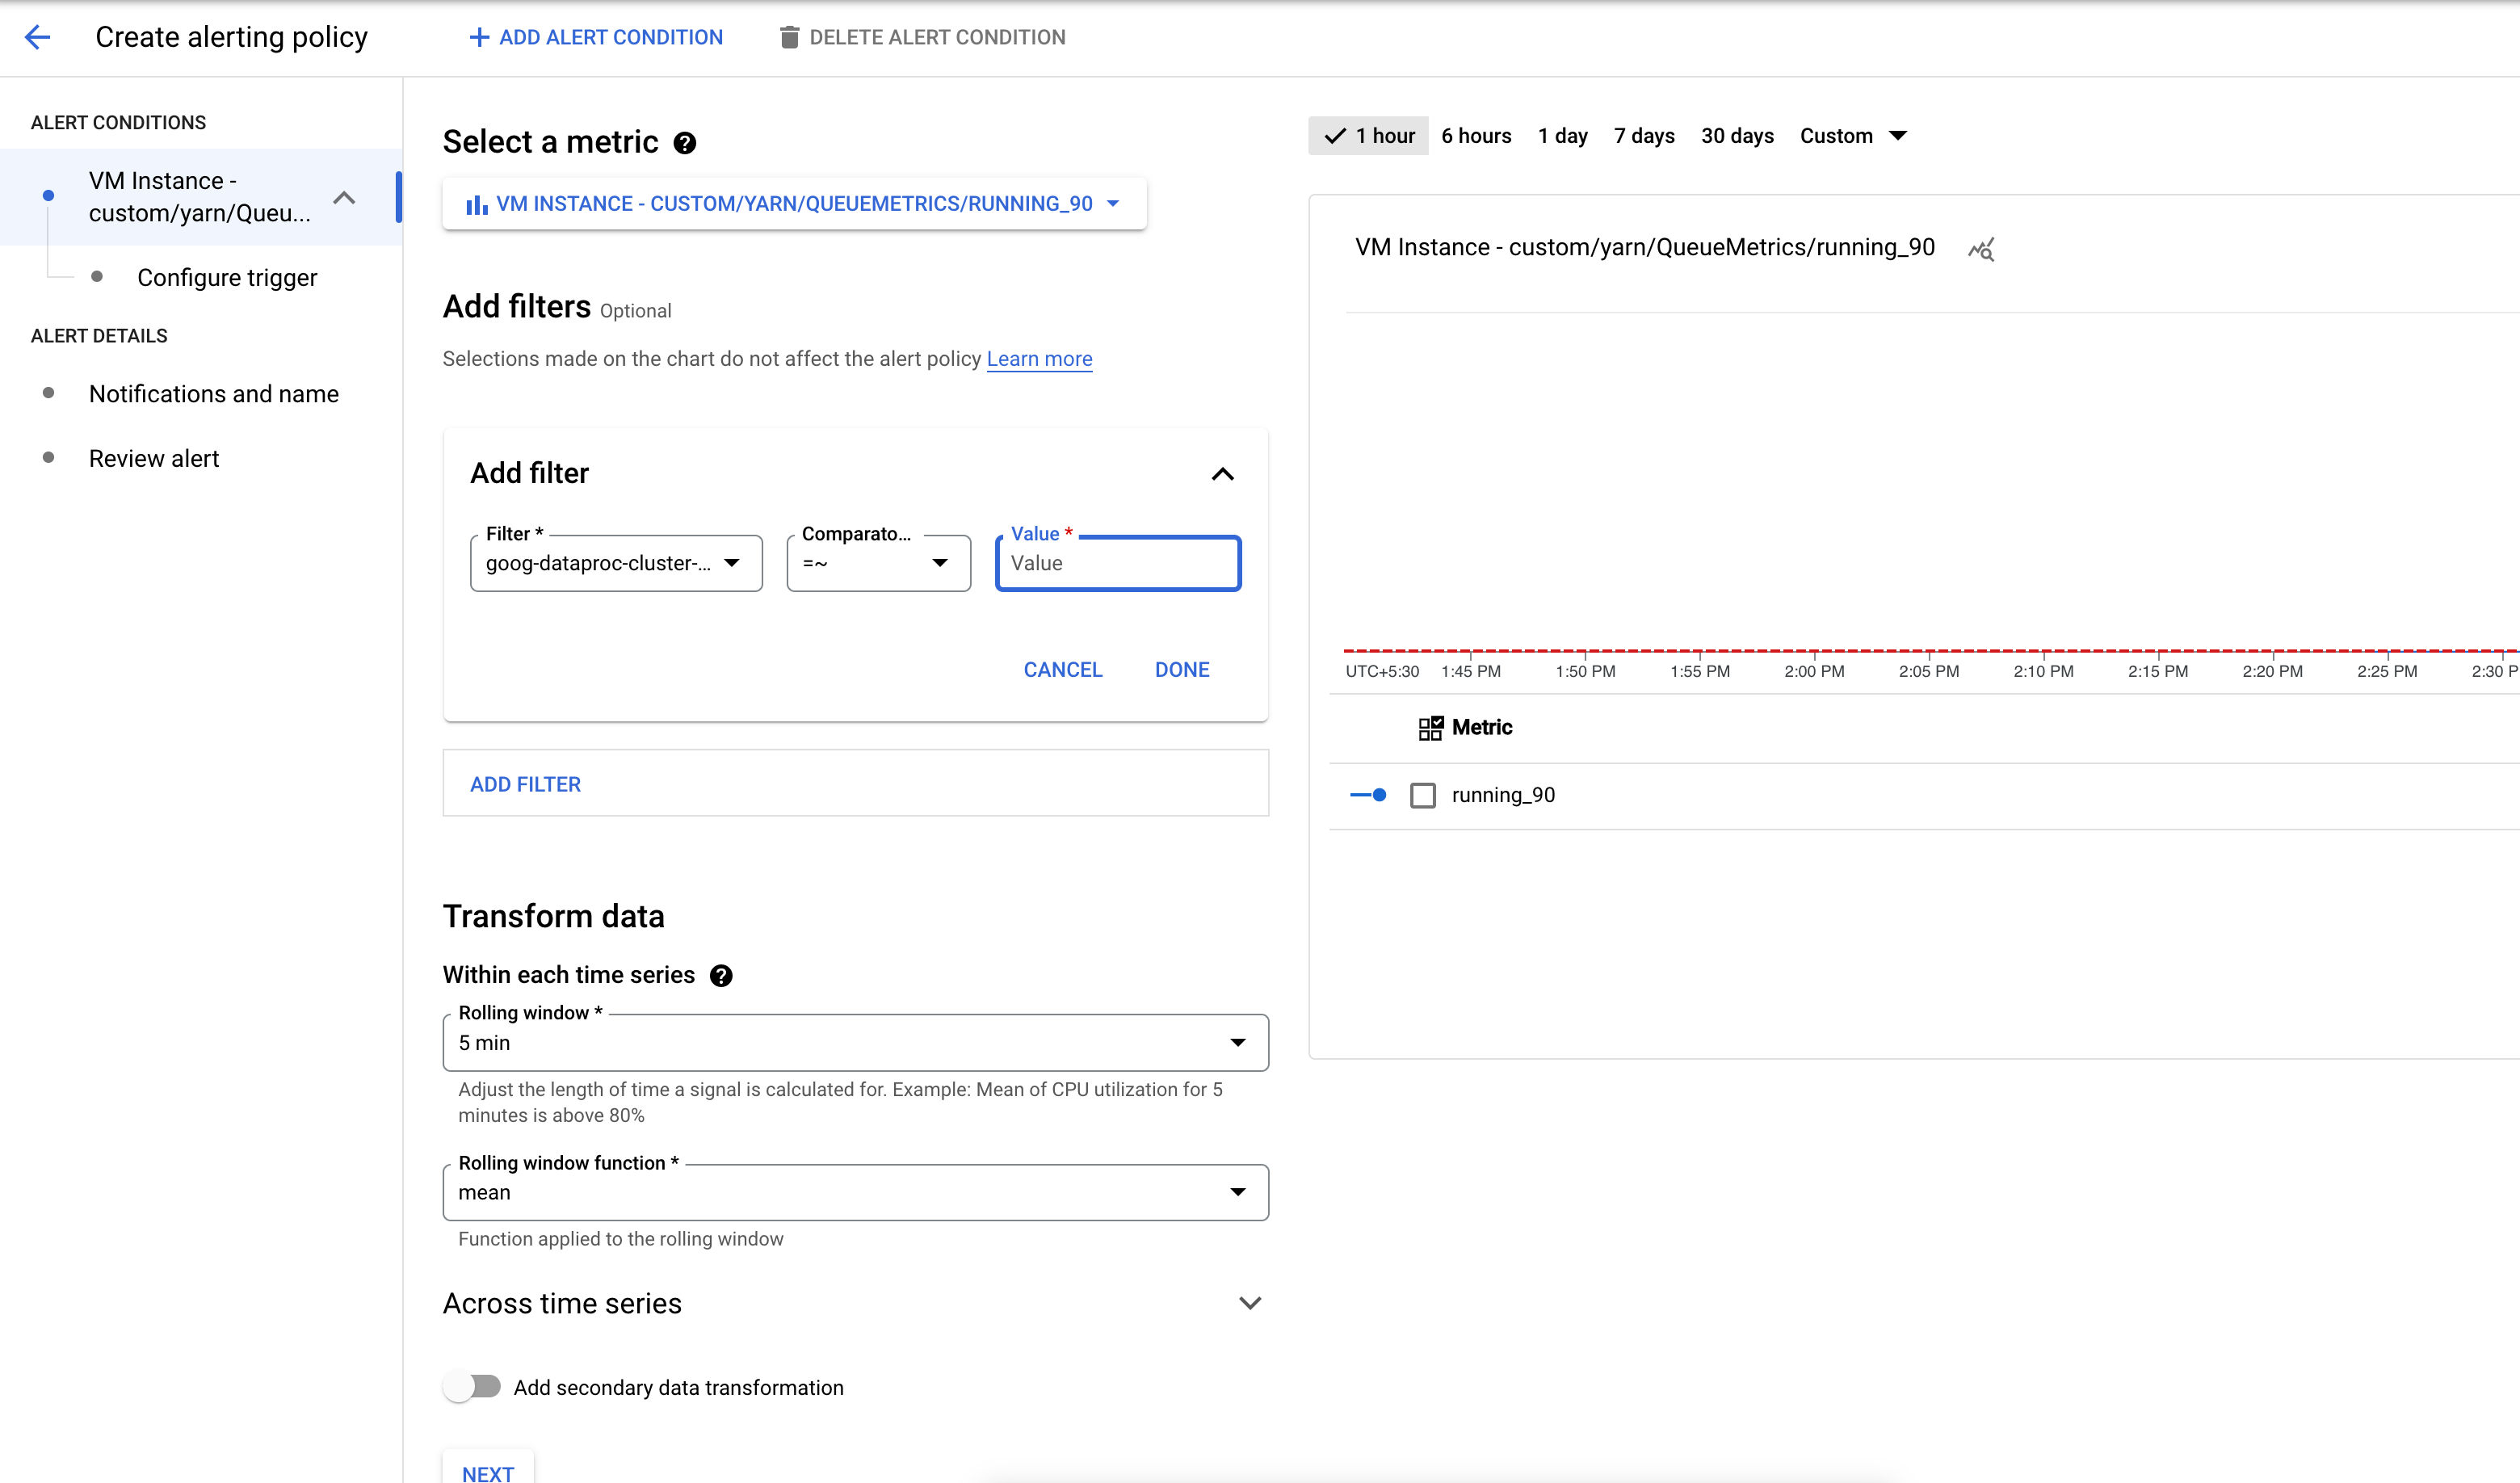
Configure the threshold for triggering the alert.
Failed Dataproc job alert
You can also use the dataproc.googleapis.com/job/state metric
(see Long-running Dataproc job alert),
to alert you when a Dataproc job fails.
Failed job alert setup
This example uses the Monitoring Query Language (MQL) to create an alert policy (see Creating MQL alerting policies (console)).
Alert MQL
fetch cloud_dataproc_job
| metric 'dataproc.googleapis.com/job/state'
| filter metric.state == 'ERROR'
| group_by [resource.job_id, metric.state], 1m
| condition val() == true()
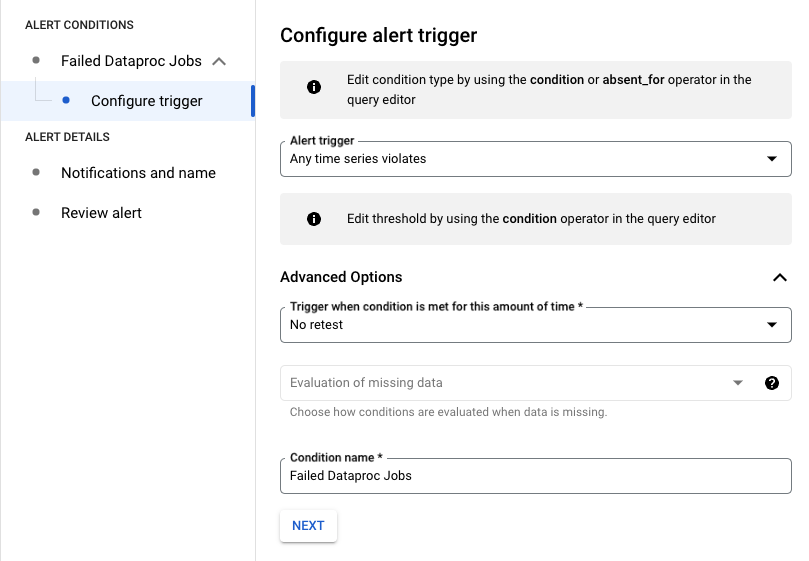
Alert trigger configuration
In the following example, the alert triggers when any Dataproc job fails in your project.
You can modify the query by filtering on the resource.job_id to apply it
to a specific job:
fetch cloud_dataproc_job
| metric 'dataproc.googleapis.com/job/state'
| filter (resource.job_id == '1234567890') && (metric.state == 'ERROR')
| group_by [resource.job_id, metric.state], 1m
| condition val() == true()
Cluster capacity deviation alert
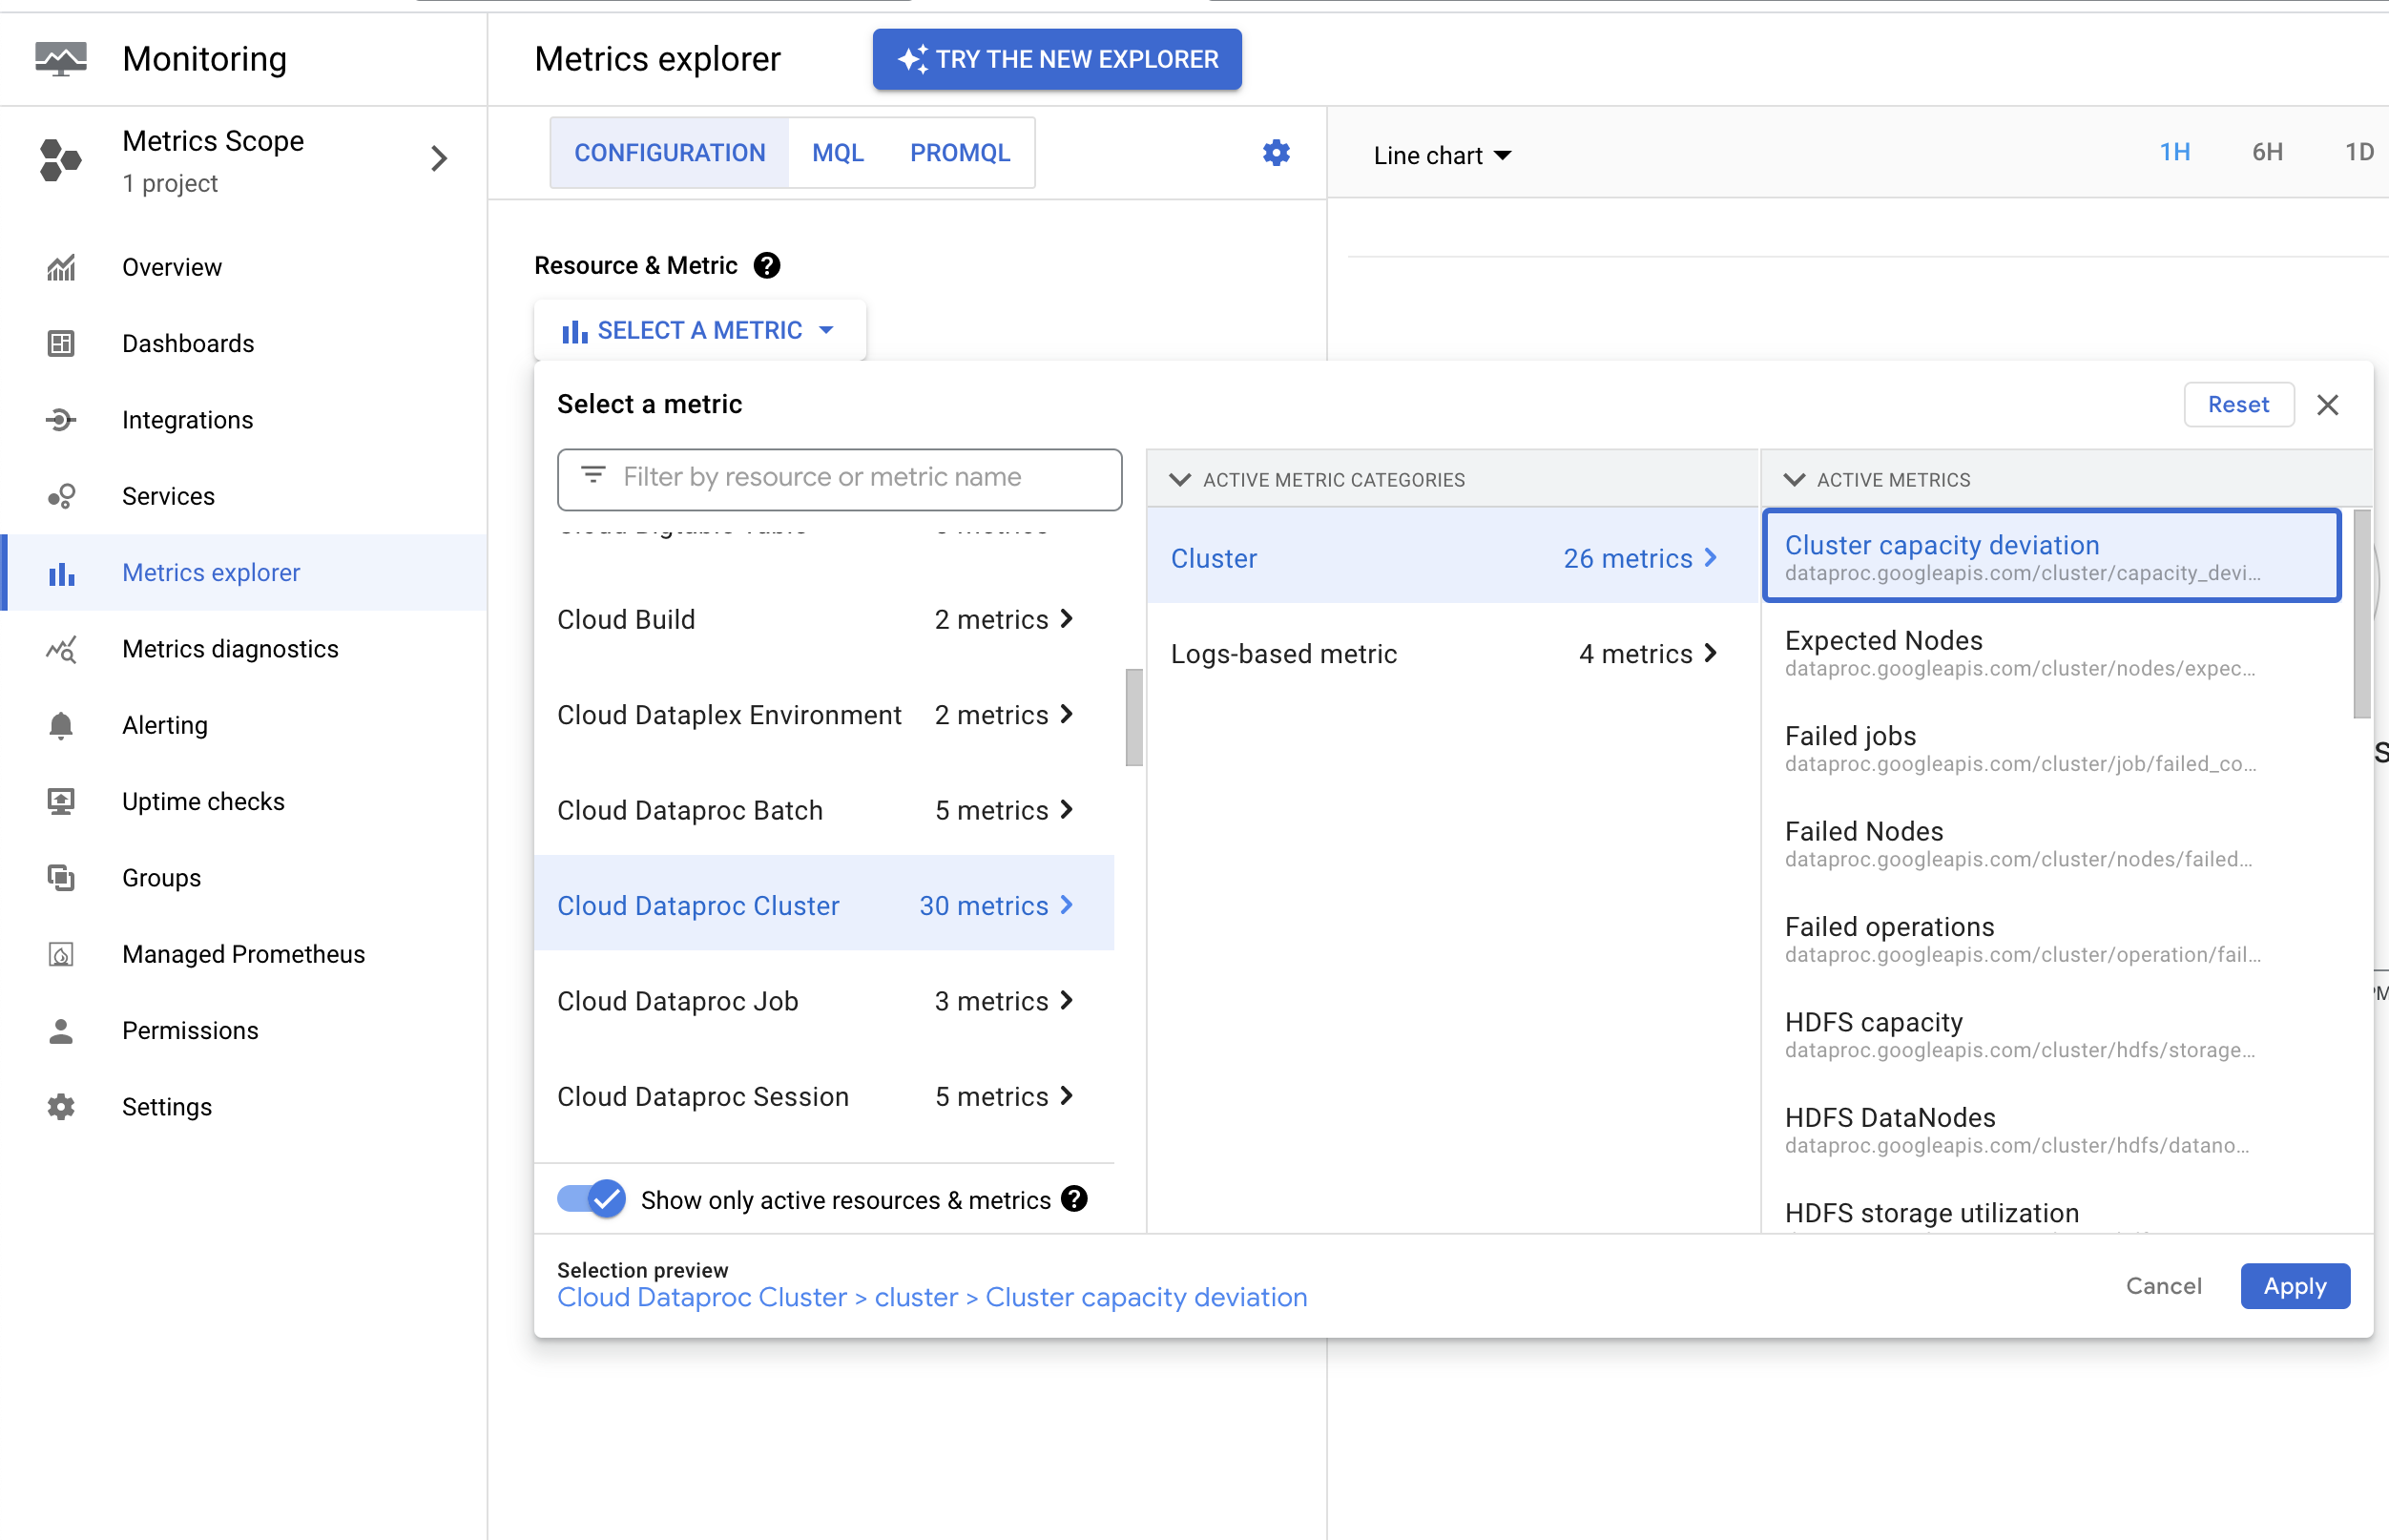
Dataproc emits the dataproc.googleapis.com/cluster/capacity_deviation
metric, which reports the difference between the expected node count in the
cluster and the active YARN node count. You can find this metric in the
Google Cloud console Metrics Explorer under the
Cloud Dataproc Cluster
resource. You can use this metric to create an alert that notifies you when
cluster capacity deviates from expected capacity for longer than a specified
threshold duration.
The following operations can cause a temporary under reporting of cluster nodes
in the capacity_deviation metric. To avoid false positive alerts, set
the metric alert threshold to account for these operations:
Cluster creation and updates: The
capacity_deviationmetric is not emitted during cluster create or update operations.Cluster initialization actions: Initialization actions are performed after a node is provisioned.
Secondary worker updates: Secondary workers are added asynchronously, after the update operation completes.
Capacity deviation alert setup
This example uses the Monitoring Query Language (MQL) to create an alert policy.
fetch cloud_dataproc_cluster
| metric 'dataproc.googleapis.com/cluster/capacity_deviation'
| every 1m
| condition val() <> 0 '1'
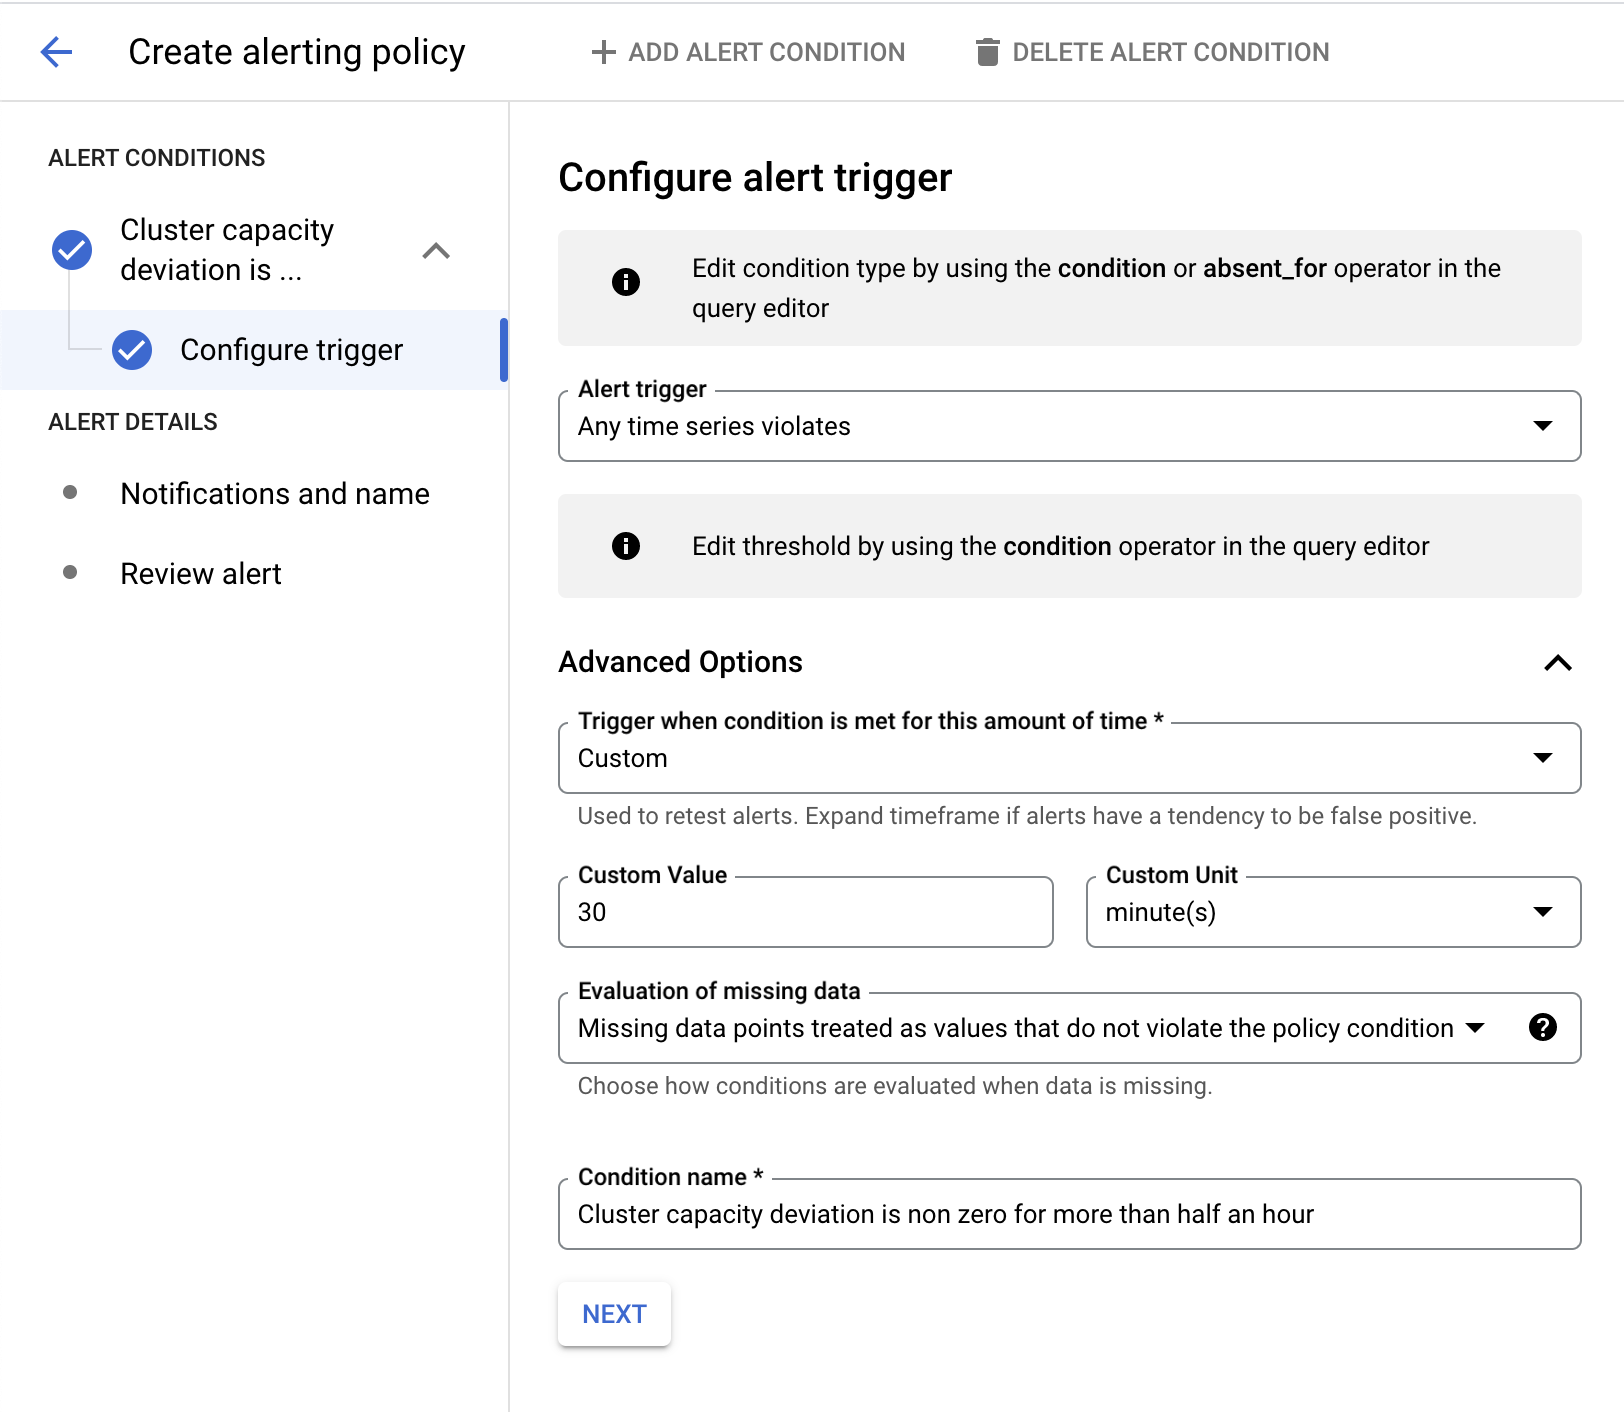
In the next example, the alert triggers when cluster capacity deviation is non zero for more than 30 minutes.
View alerts
When an alert is triggered by a metric threshold condition, Monitoring creates an incident and a corresponding event. You can view incidents from the Monitoring alerting page in the Google Cloud console.
If you defined a notification mechanism in the alert policy, such as an email or SMS notification, Monitoring sends a notification of the incident.
What's next
- See the Introduction to alerting.
