このドキュメントでは、Dataplex Universal Catalog Explore を使用して小売取引データセットの異常を検出する方法について説明します。
データ探索ワークベンチ(Explore)を使用すると、データ アナリストはリアルタイムで大規模なデータセットをインタラクティブにクエリして探索できます。Explore は、データから分析情報を取得するのに役立ち、Cloud Storage と BigQuery に保存されているデータをクエリできます。Explore はサーバーレス Spark プラットフォームを使用するため、基盤となるインフラストラクチャの管理とスケーリングの必要がありません。
目標
このチュートリアルでは、次のタスクを行う方法を説明します。
- Explore の Spark SQL ワークベンチを使用して、Spark SQL クエリを作成して実行する。
- JupyterLab ノートブックを使用して結果を表示する。
- 繰り返し実行するようにノートブックをスケジュール設定し、データの異常をモニタリングできるようにする。
費用
このドキュメントでは、課金対象である次の Google Cloudコンポーネントを使用します。
料金計算ツールを使うと、予想使用量に基づいて費用の見積もりを生成できます。
このドキュメントに記載されているタスクの完了後、作成したリソースを削除すると、それ以上の請求は発生しません。詳細については、クリーンアップをご覧ください。
始める前に
- Sign in to your Google Cloud account. If you're new to Google Cloud, create an account to evaluate how our products perform in real-world scenarios. New customers also get $300 in free credits to run, test, and deploy workloads.
-
Install the Google Cloud CLI.
-
If you're using an external identity provider (IdP), you must first sign in to the gcloud CLI with your federated identity.
-
To initialize the gcloud CLI, run the following command:
gcloud init -
Create or select a Google Cloud project.
-
Create a Google Cloud project:
gcloud projects create PROJECT_ID
Replace
PROJECT_IDwith a name for the Google Cloud project you are creating. -
Select the Google Cloud project that you created:
gcloud config set project PROJECT_ID
Replace
PROJECT_IDwith your Google Cloud project name.
-
-
Make sure that billing is enabled for your Google Cloud project.
-
Install the Google Cloud CLI.
-
If you're using an external identity provider (IdP), you must first sign in to the gcloud CLI with your federated identity.
-
To initialize the gcloud CLI, run the following command:
gcloud init -
Create or select a Google Cloud project.
-
Create a Google Cloud project:
gcloud projects create PROJECT_ID
Replace
PROJECT_IDwith a name for the Google Cloud project you are creating. -
Select the Google Cloud project that you created:
gcloud config set project PROJECT_ID
Replace
PROJECT_IDwith your Google Cloud project name.
-
-
Make sure that billing is enabled for your Google Cloud project.
探索用のデータを準備する
Parquet ファイル(
retail_offline_sales_march)をダウンロードします。次のように、
offlinesales_curatedという Cloud Storage バケットを作成します。- In the Google Cloud console, go to the Cloud Storage Buckets page.
- Click Create.
- On the Create a bucket page, enter your bucket information. To go to the next
step, click Continue.
-
In the Get started section, do the following:
- Enter a globally unique name that meets the bucket naming requirements.
- To add a
bucket label,
expand the Labels section (),
click add_box
Add label, and specify a
keyand avaluefor your label.
-
In the Choose where to store your data section, do the following:
- Select a Location type.
- Choose a location where your bucket's data is permanently stored from the Location type drop-down menu.
- If you select the dual-region location type, you can also choose to enable turbo replication by using the relevant checkbox.
- To set up cross-bucket replication, select
Add cross-bucket replication via Storage Transfer Service and
follow these steps:
Set up cross-bucket replication
- In the Bucket menu, select a bucket.
In the Replication settings section, click Configure to configure settings for the replication job.
The Configure cross-bucket replication pane appears.
- To filter objects to replicate by object name prefix, enter a prefix that you want to include or exclude objects from, then click Add a prefix.
- To set a storage class for the replicated objects, select a storage class from the Storage class menu. If you skip this step, the replicated objects will use the destination bucket's storage class by default.
- Click Done.
-
In the Choose how to store your data section, do the following:
- Select a default storage class for the bucket or Autoclass for automatic storage class management of your bucket's data.
- To enable hierarchical namespace, in the Optimize storage for data-intensive workloads section, select Enable hierarchical namespace on this bucket.
- In the Choose how to control access to objects section, select whether or not your bucket enforces public access prevention, and select an access control method for your bucket's objects.
-
In the Choose how to protect object data section, do the
following:
- Select any of the options under Data protection that you
want to set for your bucket.
- To enable soft delete, click the Soft delete policy (For data recovery) checkbox, and specify the number of days you want to retain objects after deletion.
- To set Object Versioning, click the Object versioning (For version control) checkbox, and specify the maximum number of versions per object and the number of days after which the noncurrent versions expire.
- To enable the retention policy on objects and buckets, click the Retention (For compliance) checkbox, and then do the following:
- To enable Object Retention Lock, click the Enable object retention checkbox.
- To enable Bucket Lock, click the Set bucket retention policy checkbox, and choose a unit of time and a length of time for your retention period.
- To choose how your object data will be encrypted, expand the Data encryption section (), and select a Data encryption method.
- Select any of the options under Data protection that you
want to set for your bucket.
-
In the Get started section, do the following:
- Click Create.
ファイル システムからオブジェクトをアップロードするの手順に沿って、ダウンロードした
offlinesales_march_parquetファイルを、作成したofflinesales_curatedCloud Storage バケットにアップロードします。レイクを作成するの手順に沿って、Dataplex Universal Catalog レイクを作成して
operationsという名前を付けます。ゾーンを追加するの手順に沿って、
operationsレイクにゾーンを追加し、procurementという名前を付けます。アセットを追加するの手順に沿って、
procurementゾーンで、アセットとして作成したofflinesales_curatedCloud Storage バケットを追加します。
探索するテーブルを選択する
Google Cloud コンソールで、Dataplex Universal Catalog の [探索] ページに移動します。
[レイク] フィールドで、
operationsレイクを選択します。operationsレイクをクリックします。procurementゾーンに移動し、メタデータを探索するテーブルをクリックします。次の図では、選択した調達ゾーンに
Offlineというテーブルがあります。このテーブルには、orderid、product、quantityordered、unitprice、orderdate、purchaseaddressというメタデータがあります。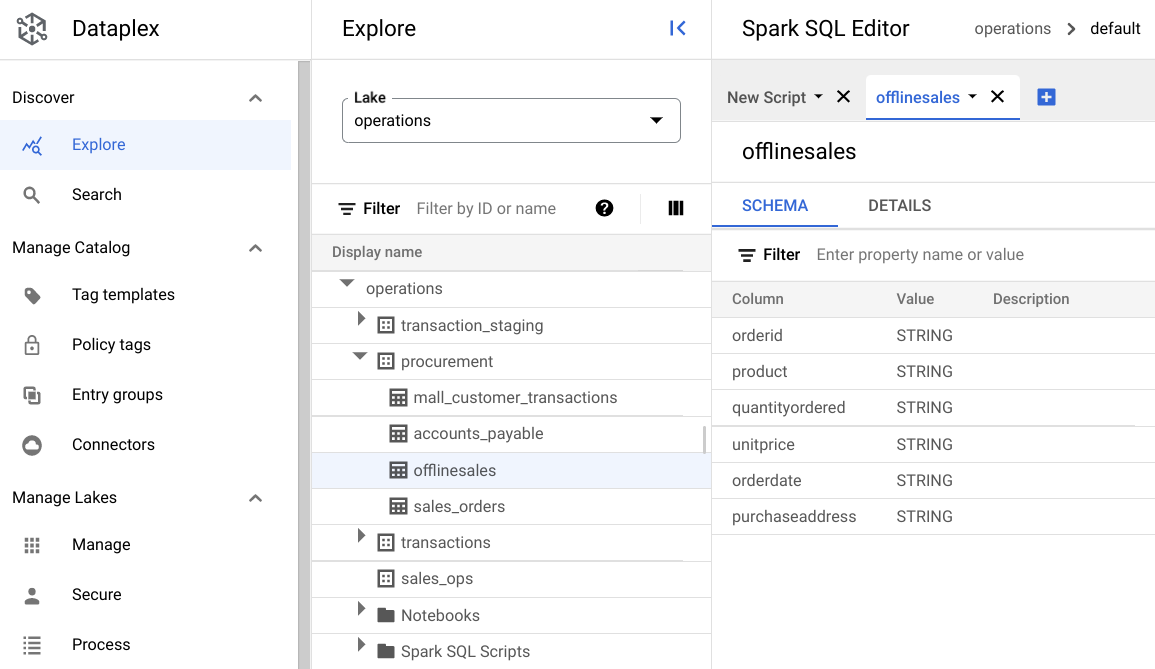
Spark SQL エディタで、[ 追加] をクリックします。Spark SQL スクリプトが表示されます。
省略可: 分割タブビューでスクリプトを開き、メタデータと新しいスクリプトを並べて表示します。新しいスクリプトタブで [ さらに表示] を選択し、[タブを右に分割] または [タブを左に分割] を選択します。
データを表示
環境には、Spark SQL クエリとノートブックをレイク内で実行するためのサーバーレス コンピューティング リソースを備えています。Spark SQL クエリを作成する前に、クエリを実行する環境を作成します。
次の SparkSQL クエリを使用してデータを探索します。SparkSQL エディタで、[新しいスクリプト] ペインにクエリを入力します。
テーブルの 10 行のサンプル
次のクエリを入力します。
select * from procurement.offlinesales where orderid != 'orderid' limit 10;[実行] をクリックします。
データセット内の取引の合計数を取得する
次のクエリを入力します。
select count(*) from procurement.offlinesales where orderid!='orderid';[実行] をクリックします。
データセット内のさまざまな商品カテゴリの数を確認する
次のクエリを入力します。
select count(distinct product) from procurement.offlinesales where orderid!='orderid';[実行] をクリックします。
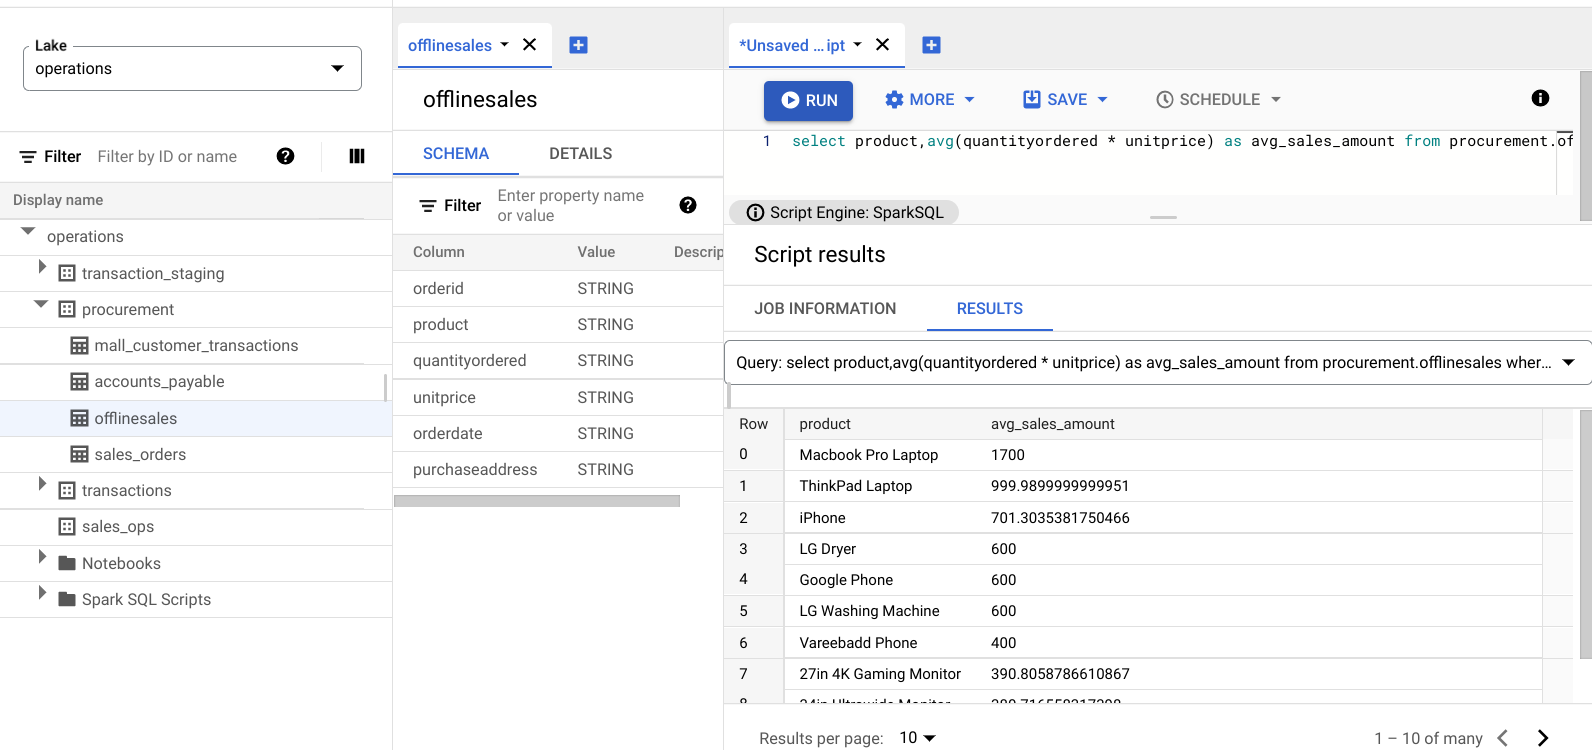
取引額が大きい商品を見つける
販売品を商品カテゴリ別、平均販売価格別に分類して、取引額が大きい商品を把握します。
次のクエリを入力します。
select product,avg(quantityordered * unitprice) as avg_sales_amount from procurement.offlinesales where orderid!='orderid' group by product order by avg_sales_amount desc;[実行] をクリックします。
次の画像は、Results ペインを表示したものです。product という列を使用して avg_sales_amount という列に表示される取引額の大きい販売商品を特定できます。
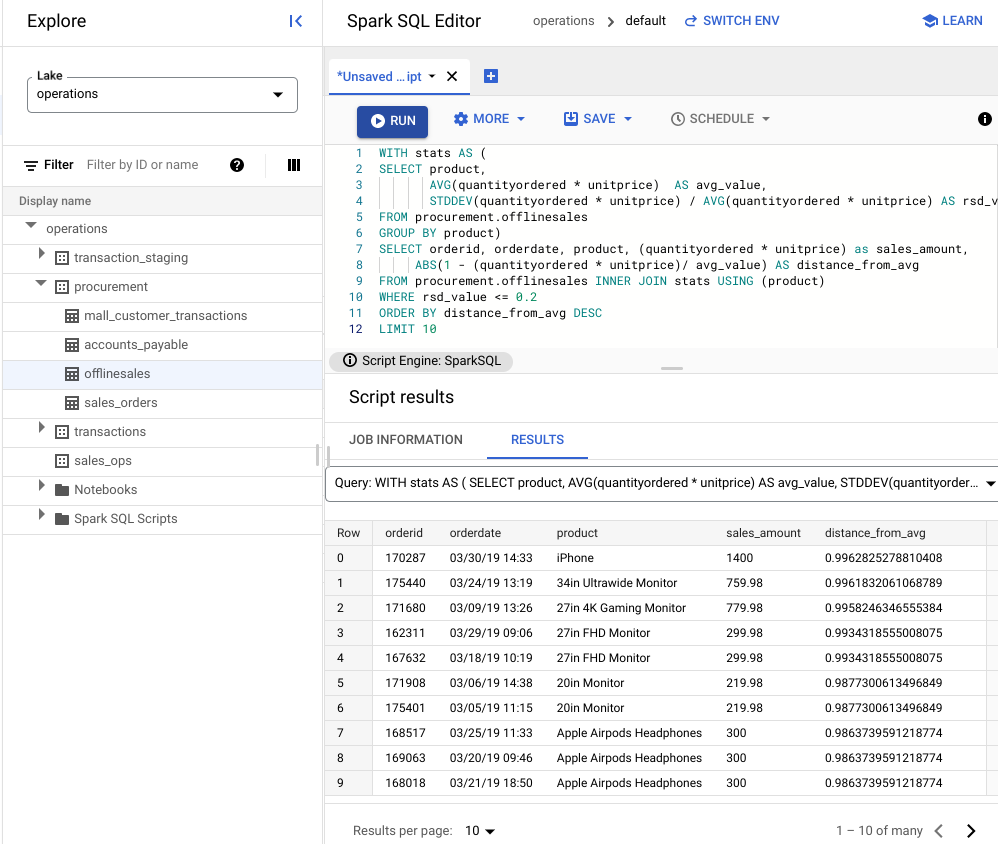
変動係数を使用して異常を検出する
前回のクエリで、ノートパソコンでの平均取引額が高いことがわかりました。次のクエリは、データセット内で取引が異常ではないノートパソコンを検出する方法を示しています。
次のクエリは、指標に「変動係数」rsd_value を使用して、値の分散が平均値と比較して低く、異常ではない取引を検索します。変動係数が低いほど、異常値が少ないことを表します。
次のクエリを入力します。
WITH stats AS ( SELECT product, AVG(quantityordered * unitprice) AS avg_value, STDDEV(quantityordered * unitprice) / AVG(quantityordered * unitprice) AS rsd_value FROM procurement.offlinesales GROUP BY product) SELECT orderid, orderdate, product, (quantityordered * unitprice) as sales_amount, ABS(1 - (quantityordered * unitprice)/ avg_value) AS distance_from_avg FROM procurement.offlinesales INNER JOIN stats USING (product) WHERE rsd_value <= 0.2 ORDER BY distance_from_avg DESC LIMIT 10[実行] をクリックします。
スクリプトの結果を確認します。
次の画像の [結果] ペインでは、product という列を使用して、取引額が変動係数 0.2 の範囲内にある販売商品を特定しています。
JupyterLab ノートブックを使用して異常を可視化する
ML モデルを構築して、異常を大規模に検出して可視化します。
ノートブックを別のタブで開き、読み込みが完了するまで待ちます。Spark SQL クエリを実行したセッションは続行されます。
必要なパッケージをインポートし、取引データを含む BigQuery 外部テーブルに接続します。次のコードを実行します。
from google.cloud import bigquery
from google.api_core.client_options import ClientOptions
import os
import warnings
warnings.filterwarnings('ignore')
import pandas as pd

project = os.environ['GOOGLE_CLOUD_PROJECT']
options = ClientOptions(quota_project_id=project)
client = bigquery.Client(client_options=options)
client = bigquery.Client()

#Load data into DataFrame

sql = '''select * from procurement.offlinesales limit 100;'''
df = client.query(sql).to_dataframe()
分離フォレスト アルゴリズムを実行して、データセット内の異常を検出します。
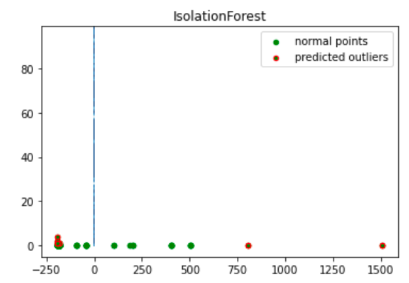
to_model_columns = df.columns[2:4]
from sklearn.ensemble import IsolationForest
clf=IsolationForest(n_estimators=100, max_samples='auto', contamination=float(.12), \
                        max_features=1.0, bootstrap=False, n_jobs=-1, random_state=42, verbose=0)
clf.fit(df[to_model_columns])
pred = clf.predict(df[to_model_columns])
df['anomaly']=pred
outliers=df.loc[df['anomaly']==-1]
outlier_index=list(outliers.index)
#print(outlier_index)
#Find the number of anomalies and normal points here points classified -1 are anomalous
print(df['anomaly'].value_counts())
Matplotlib の可視化を使用して、予測された異常をプロットします。
import numpy as np
from sklearn.decomposition import PCA
pca = PCA(2)
pca.fit(df[to_model_columns])
res=pd.DataFrame(pca.transform(df[to_model_columns]))
Z = np.array(res)
plt.title("IsolationForest")
plt.contourf( Z, cmap=plt.cm.Blues_r)
b1 = plt.scatter(res[0], res[1], c='green',
                s=20,label="normal points")
b1 =plt.scatter(res.iloc[outlier_index,0],res.iloc[outlier_index,1], c='green',s=20,  edgecolor="red",label="predicted outliers")
plt.legend(loc="upper right")
plt.show()
この画像は、異常値が赤でハイライト表示された取引データを示しています。
ノートブックのスケジュールを設定する
Explore では、ノートブックを定期的に実行するようスケジュール設定できます。手順に沿って、作成した Jupyter Notebook のスケジュールを設定します。
Dataplex Universal Catalog は、ノートブックを定期的に実行するスケジュール設定タスクを作成します。タスクの進行状況をモニタリングするには、[スケジュールを表示] をクリックします。
ノートブックを共有またはエクスポートする
Explore では、IAM 権限を使用して組織内の他のユーザーとノートブックを共有できます。
ロールを確認します。このノートブックのユーザーに対して、Dataplex Universal Catalog 閲覧者(roles/dataplex.viewer)、Dataplex Universal Catalog 編集者(roles/dataplex.editor)、Dataplex Universal Catalog 管理者(roles/dataplex.admin)のロールを付与または取り消します。ノートブックを共有した後、レイクレベルで閲覧者または編集者のロールを持つユーザーは、レイクに移動して共有ノートブックで作業できます。
ノートブックを共有またはエクスポートするには、ノートブックを共有するまたはノートブックをエクスポートするをご覧ください。
クリーンアップ
このチュートリアルで使用したリソースについて、Google Cloud アカウントに課金されないようにするには、リソースを含むプロジェクトを削除するか、プロジェクトを維持して個々のリソースを削除します。
プロジェクトを削除する
Delete a Google Cloud project:
gcloud projects delete PROJECT_ID
リソースを個別に削除する
-
バケットを削除します。
gcloud storage buckets delete BUCKET_NAME
-
インスタンスを削除します。
gcloud compute instances delete INSTANCE_NAME