You can view autoscaling monitoring charts for streaming jobs within the Dataflow monitoring interface. These charts display metrics over the duration of a pipeline job and include the following information:
- The number of worker instances used by your job at any point in time
- The autoscaling log files
- The estimated backlog over time
- The average CPU utilization over time
The charts are aligned vertically so that you can correlate the backlog and CPU utilization metrics with worker scaling events.
For more information about how Dataflow makes autoscaling decisions, see the Autotuning features documentation. For more information about Dataflow monitoring and metrics, see Use the Dataflow monitoring interface.
Access autoscaling monitoring charts
You can access the Dataflow monitoring interface by using the Google Cloud console. To access the Autoscaling metrics tab, follow these steps:
- Sign in to the Google Cloud console.
- Select your Google Cloud project.
- Open the navigation menu.
- In Analytics, click Dataflow. A list of Dataflow jobs appears along with their status.
- Click the job that you want to monitor, and then click the Autoscaling tab.
Monitor autoscaling metrics
The Dataflow service automatically chooses the number of worker instances required to run your autoscaling job. The number of worker instances can change over time according to the job requirements.
You can view autoscaling metrics in the Autoscaling tab of the Dataflow interface. Each metric is organized into the following charts:
The autoscaling action bar displays the current autoscaling status and workers count.
Autoscaling
The Autoscaling chart shows a time-series graph of the current number of workers, the target number of workers, and the minimum and maximum number of workers.
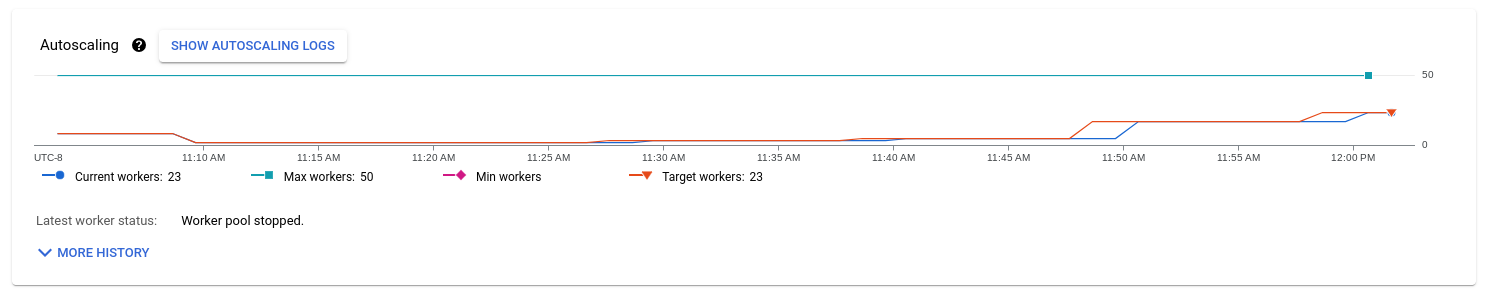
To see the autoscaling logs, click Show autoscaling logs.
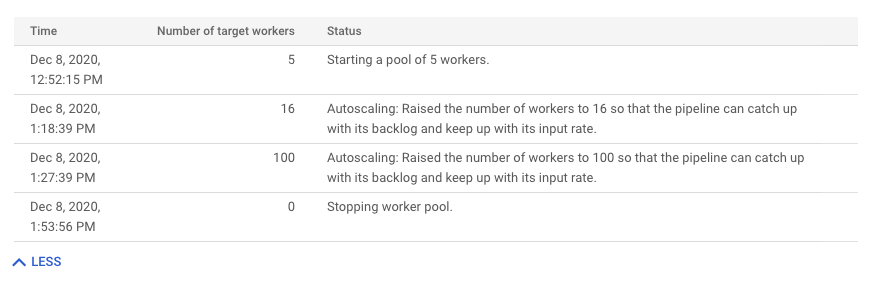
To see the history of autoscaling changes, click More history. A table with information about the worker history of your pipeline is shown. The history includes autoscaling events, including whether the number of workers reached the minimum or maximum worker count.
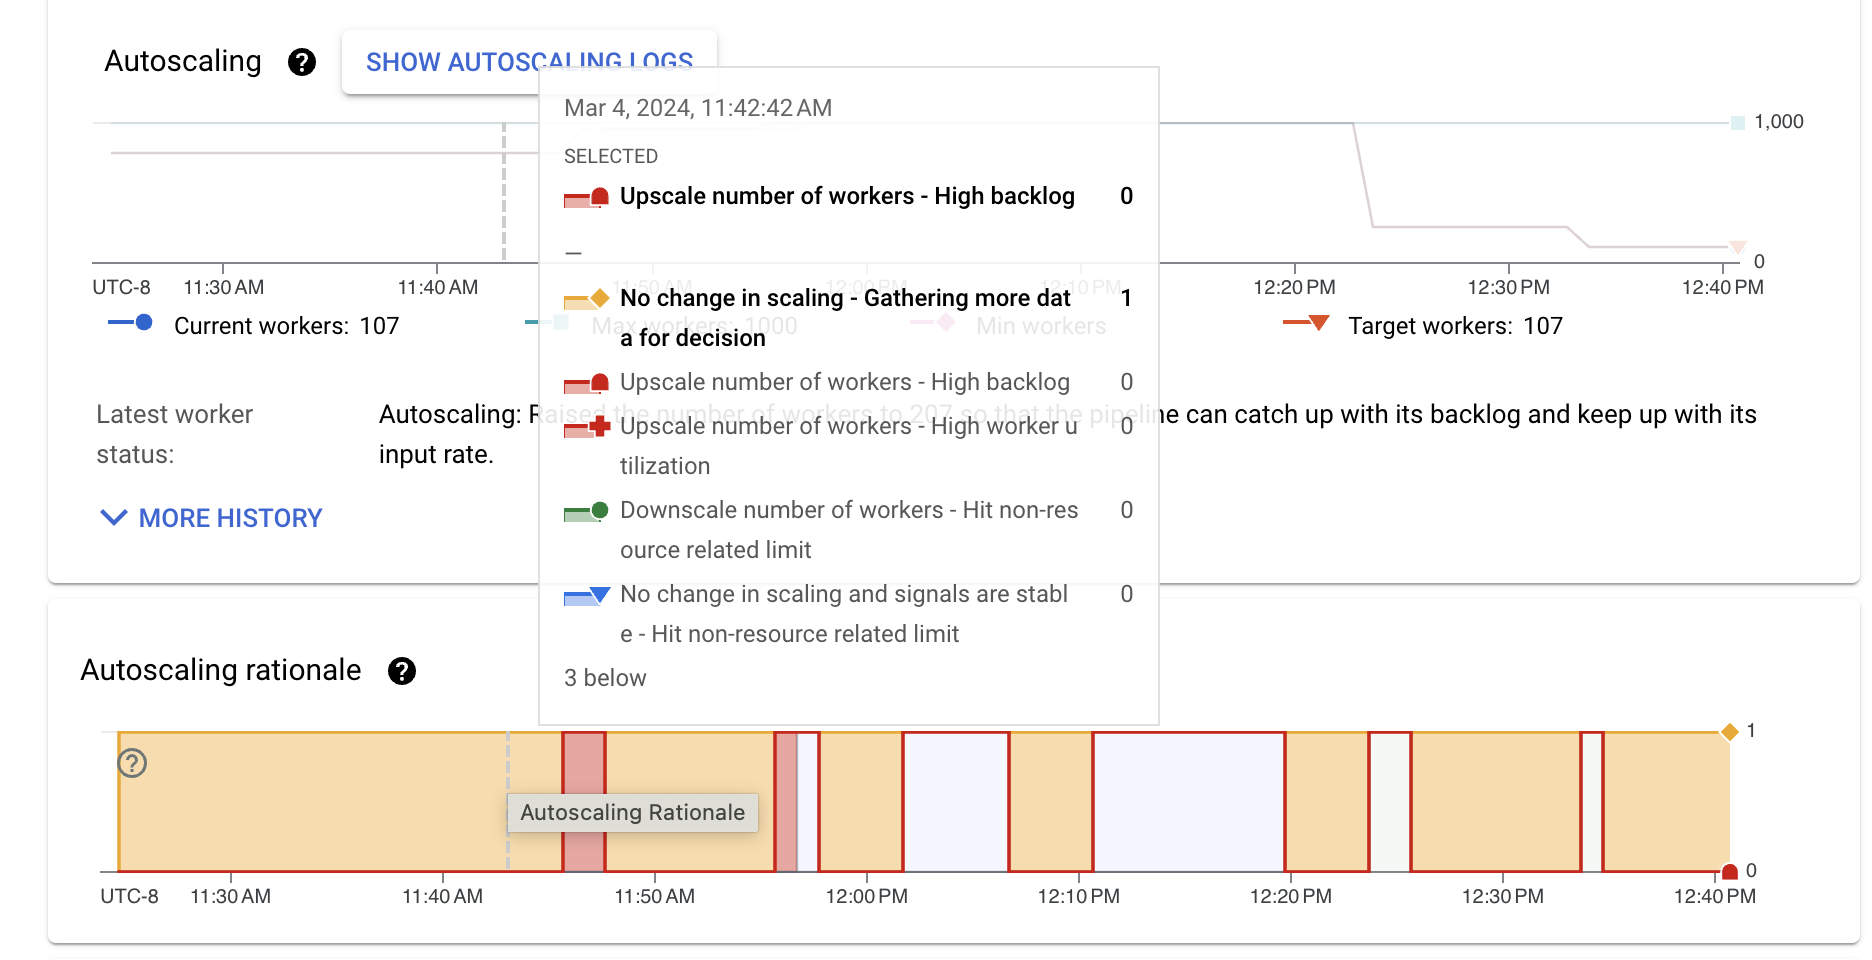
Autoscaling rationale (Streaming Engine only)
The Autoscaling rationale chart shows why the autoscaler scaled up, scaled down, or took no actions during a given time period.

To see a description of the rationale at a specific point, hold the pointer over the chart.
The following table lists scaling actions and possible scaling rationales.
| Scaling action | Rationale | Description |
|---|---|---|
| No change in scaling | Gathering more data for decision | The autoscaler does not have enough signals to scale up or down. For example, the worker pool status changed recently; or backlog or utilization metrics are fluctuating. |
| No change in scaling, stable signals | Hit non-resource related limit | Scaling is constrained by a limit such as key parallelism or the configured minimum and maximum workers. |
| Low backlog and high worker utilization | The pipeline's autoscaling has converged to a stable value given the current traffic and configuration. No scaling change is needed. | |
| Scale up | High backlog | Scaling up to reduce backlog. |
| High worker utilization | Scaling up to achieve target CPU utilization. | |
| Hit a non-resource-related limit | The minimum number of workers was updated, and the current number of workers is below the configured minimum. | |
| Scale down | Low worker utilization | Scaling down to achieve target CPU utilization. |
| Hit a non-resource-related limit | The maximum number of workers was updated, and the current number of workers is above the configured maximum. |
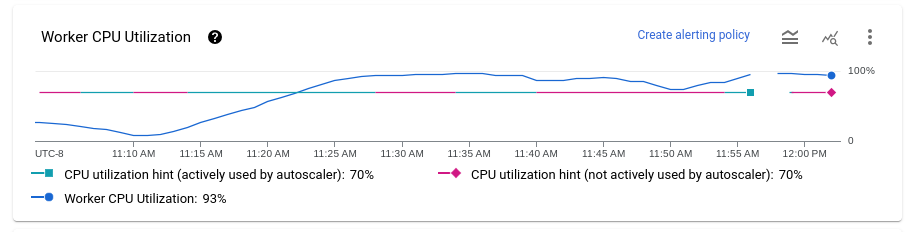
Worker CPU utilization
CPU utilization is the amount of CPU used divided by the amount of CPU available for processing. The Mean CPU utilization chart shows the average CPU utilization for all workers over time, the worker utilization hint, and whether Dataflow actively used the hint as a target.
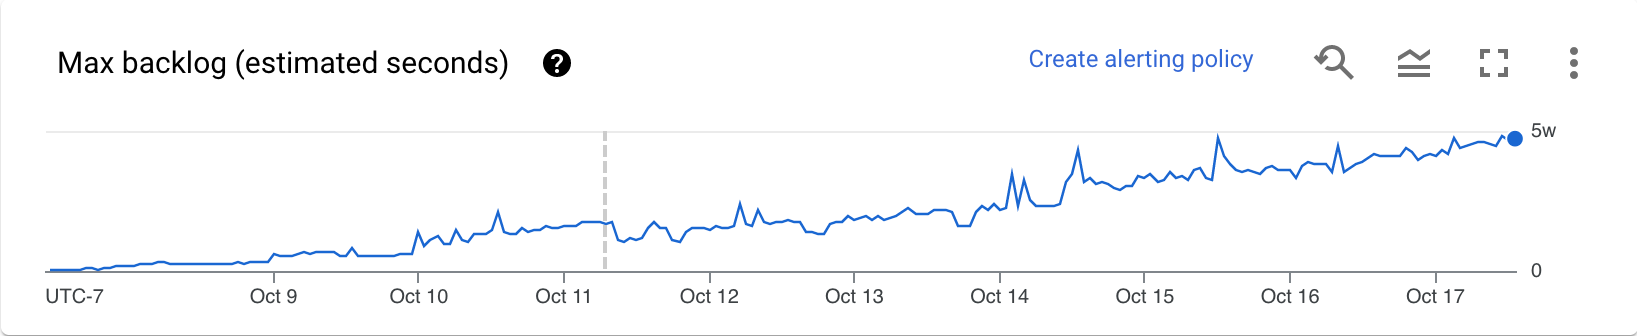
Backlog (Streaming Engine only)
The Maximum backlog chart provides information about elements waiting to be processed. The chart shows an estimate of the amount of time in seconds needed to consume the current backlog if no new data arrives and throughput doesn't change. The estimated backlog time is calculated from both the throughput and the backlog bytes from the input source that still need to be processed. This metric is used by the streaming autoscaling feature to determine when to scale up or down.
Data for this chart is only available for jobs that use Streaming Engine. If your streaming job doesn't use Streaming Engine, the chart is empty.
Recommendations
Here are some behaviors that you might observe in your pipeline, and recommendations on how to tune autoscaling:
Excessive downscaling. If the target CPU utilization is set too high, you might see a pattern where Dataflow scales down, the backlog starts to grow, and Dataflow scales up again to compensate, instead of converging on a stable number of workers. To mitigate this issue, try setting a lower worker utilization hint. Observe the CPU utilization at the point where the backlog starts to grow, and set the utilization hint to that value.
Too slow upscaling. If upscaling is too slow, it might lag behind spikes in traffic, resulting in periods of increased latency. Try reducing the worker utilization hint, so that Dataflow scales up more quickly. Observe the CPU utilization at the point where the backlog starts to grow, and set the utilization hint to that value. Monitor both latency and cost, because a lower hint value can increase the total cost for the pipeline, if more workers are provisioned.
Excessive upscaling. If you observe excessive upscaling, resulting in increased cost, consider increasing the worker utilization hint. Monitor latency to make sure it stays within acceptable bounds for your scenario.
For more information, see Set the worker utilization hint. When you experiment with a new worker utilization hint value, wait a few minutes for the pipeline to stabilize after each adjustment.