6x improvement in bookings achieved by one customer
40% less time spent by IT teams on BI
25 dynamic dashboards replaced 60 static dashboards
Enabled global scalability, reliability, and consistency
Accelerated new product development
OfficeRnD improves development efficiency and equips its employees and customers with the insights they need to drive growth by building a central data and BI platform with Looker.
OfficeRnD improves development efficiency and equips its employees and customers with the insights they need to drive growth by building a central data and BI platform with Looker.
Shifting a "code red" development scenario to code green
We could create a semantic layer with Looker that would provide a single source of truth with centralized KPI calculations, data descriptions, and controls. This was an important differentiator compared with the other PoCs we did.
Mihail Kyosev
Head of Product, OfficeRnD
OfficeRnD's ability to recognize and quickly pursue emerging opportunities continues to pay off. When the need for flexible work soared during the pandemic, the company adapted its coworking and workplace management platform to help commercial property owners and leasing organizations navigate the unprecedented change in where and how people worked. The shift in strategy drove rapid growth, and OfficeRnD soon found itself struggling to keep up with demand.
The company's siloed data and complex analytics processes — facilitated by React queries — created widespread challenges. IT teams were spending significant time manually creating customer reports, managing governance, and resolving data consistency and replication issues caused by more than 80 tables with duplicated data in different databases.
"It was okay to have developers create reports for customers when we first launched, but this strategy doesn't work when you reach a certain size," explains Mihail Kyosev, Head of Product at OfficeRnD. "Imagine having to build cubes for more than 1,000 customers and maintain the flexibility to meet the unique needs of each one. We had hit a code red situation." Not only was there little time to innovate, but the platform's siloed architecture limited information usage and development. Reliability and performance challenges restricted growth. And unacceptable BI latency levels prevented the delivery of advanced BI options to customers in remote regions like Australia.
To scale faster and meet the evolving requirements of customers' cross-departmental teams, OfficeRnD decided to build a central Data Hub and adopt an embeddable third-party BI solution. "We chose Looker for its flexibility, development efficiency, stability, and performance, especially when it came to embedding," Kyosev says. "It enables the best user experience for our developers and for our customers." With Looker, OfficeRnD could also build a semantic layer that would improve data usage and development efficiency.
A three-month project transforms experiences and enables global expansion
To quickly remedy customers' BI reliability and performance issues — and ease the pressure developers were facing in keeping up with demand — OfficeRnD designed, built, and launched an initial Looker solution in just three months. Two developers embedded Looker into OfficeRnD's platform and built a "wrapper" app around it using the Looker API so that it has the same look and feel as other features. Another developer and data engineer used Looker to recreate more than 60 standard dashboards and 30 customer-specific dashboards that surfaced insights from a new Data Hub built with Snowflake data warehouse. It ingests information from OfficeRnD's existing data stores about customers' operations and building usage as well as information from their third-party app integrations from OfficeRnD's marketplace. The apps include everything from accounting and payment tools such as Xero and Stripe to booking and customer relationship management using Google Calendar and HubSpot CRM.
Immediately after the solution went into production, OfficeRnD's developers were no longer in a code red situation. More than 1,000 customers realized faster, more reliable access to their dashboards, so there were fewer issues to troubleshoot. They gained the ability to drill down into KPI data and schedule automated deliveries of reports and dashboards through text and email. And OfficeRnD was able to deliver full BI capabilities to any region. Kyosev says, "With Looker, we eliminated latency issues so we could offer advanced analytics to customers in Australia, which is something we couldn't do before."
Redesigning data and analytics strategies to simplify development
Since it had addressed its critical business issues with its initial Looker implementation, OfficeRnD spent the next year revamping its data architecture to accelerate innovation. "We're ingesting about 30 gigabytes of new data every month from our Operations Hub, Integrations Hub, Visitor Hub, and Growth Hub," says Kyosev. "To minimize redundancy and ensure accuracy at scale, we redesigned our data stack so that every component serves a distinct purpose, without overlapping responsibilities." Additionally, developers used Looker Modeling Language (LookML) to build a semantic layer that sits on top of its Data Hub, ensuring all BI is delivered using centralized data models, data descriptions, and KPI calculations. With capabilities in Snowflake and Looker, they also added row-level and role-based access controls to ensure users only see the data they're authorized to access.
With Looker, we've been able to optimize and clarify all our data dimensions and metrics so that data is now consistent across reports. Overall, developers are spending about 40% less time on BI and a dashboard that used to take two weeks to complete can now be done in hours.
Mihail Kyosev
Head of Product, OfficeRnD
To further simplify and accelerate BI development and maintenance, developers used built-in tools in Looker — including the Liquid templating language — to rebuild embedded dashboards and reports so they're automatically populated with dynamic content based on each user's profile. As a result, developers delivered the same insights with just 25 dashboards rather than 60, significantly reducing complexity and maintenance time.
New offerings unlock insights and increase customer bookings
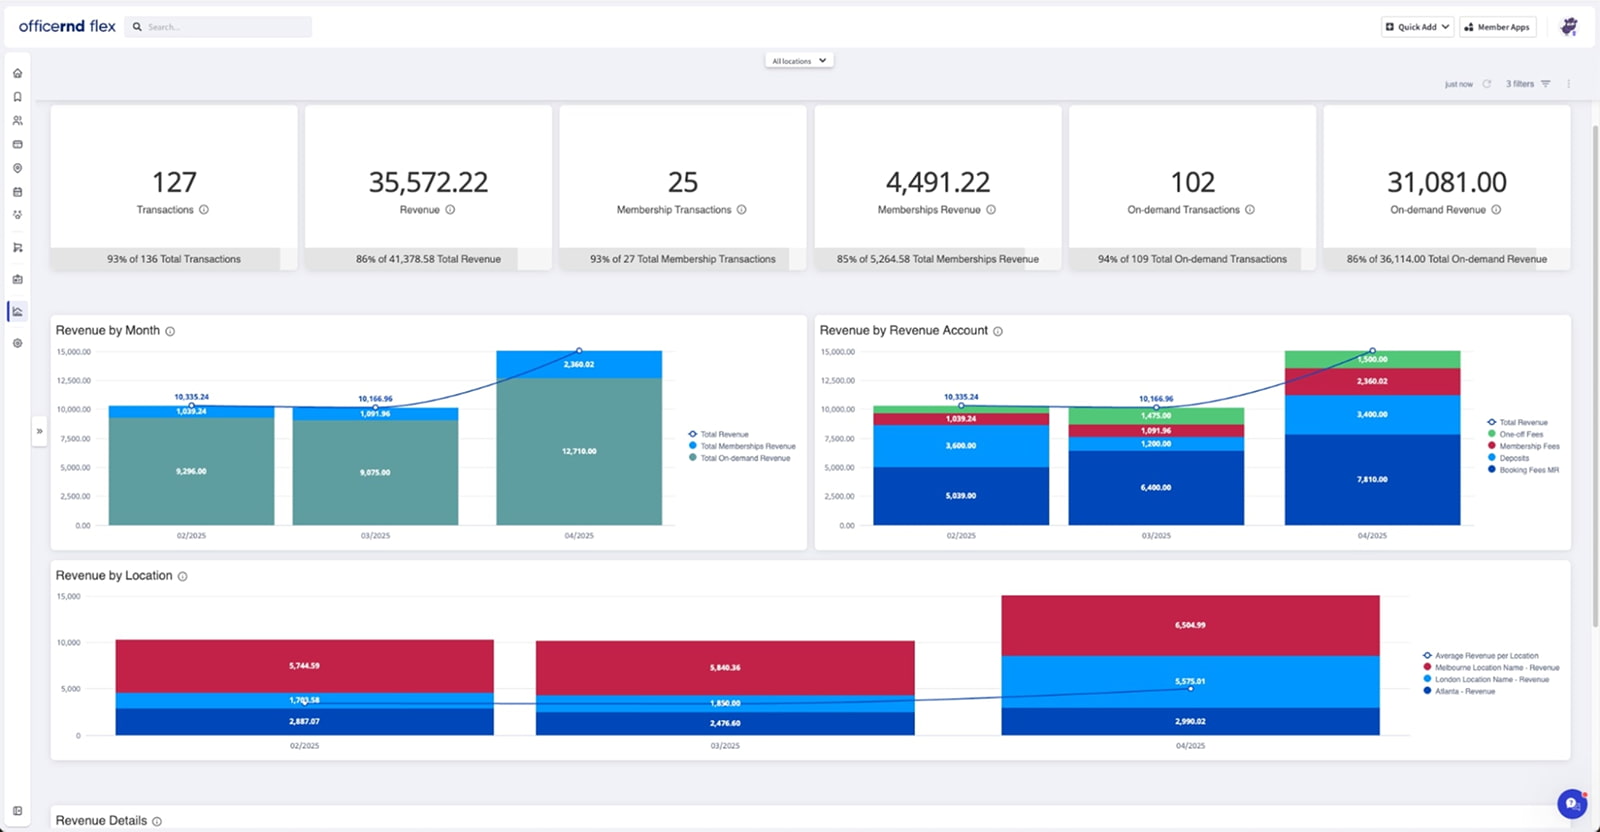
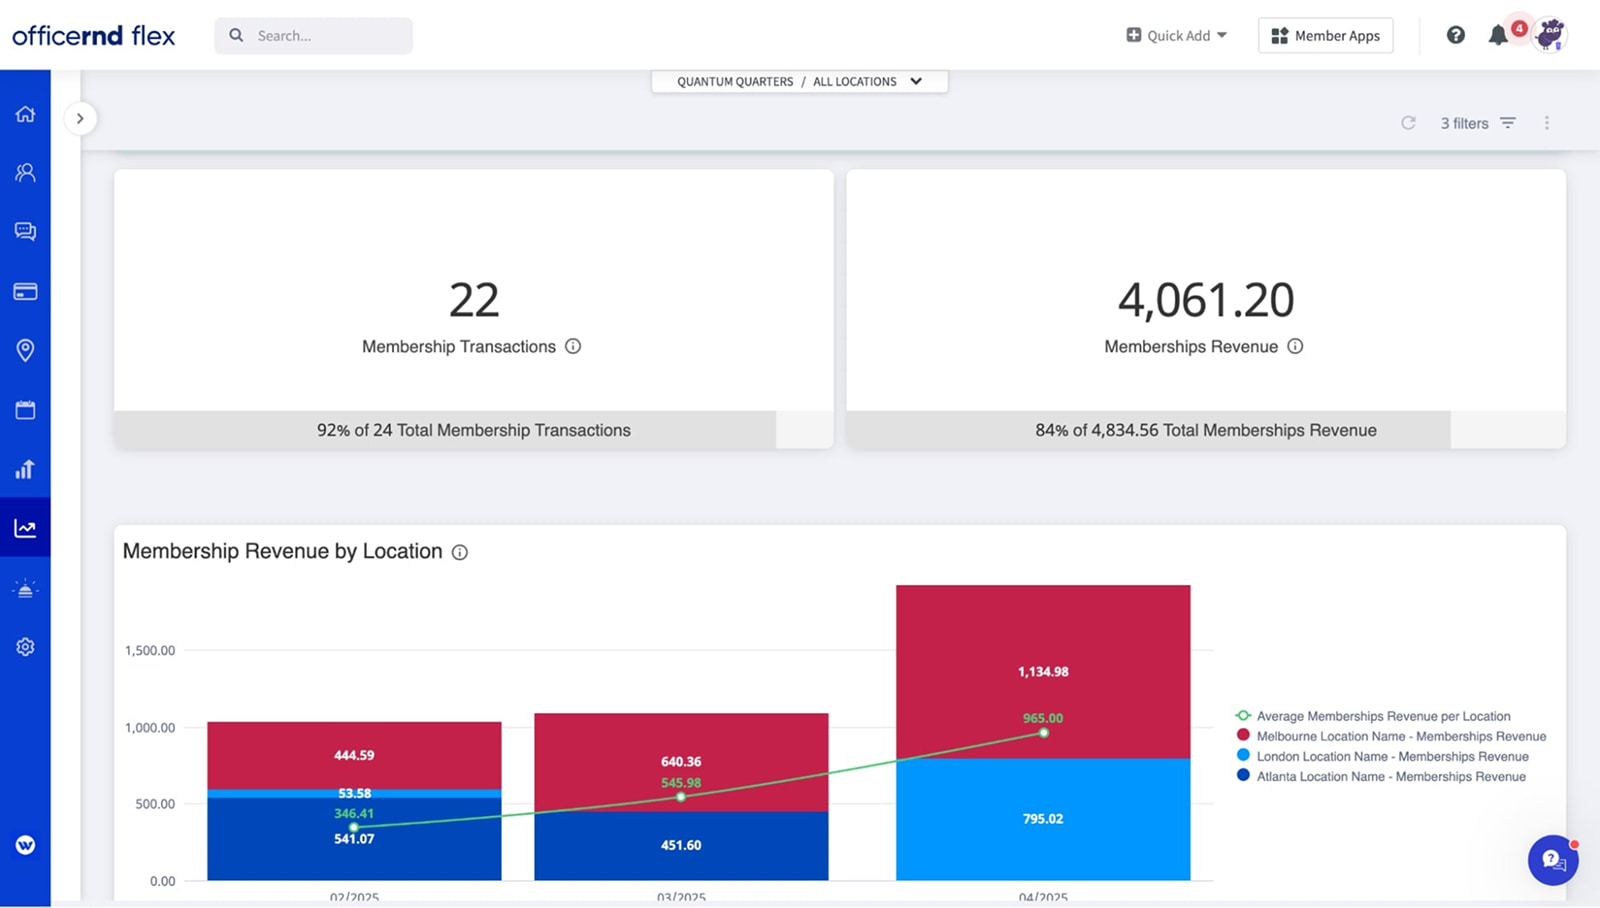
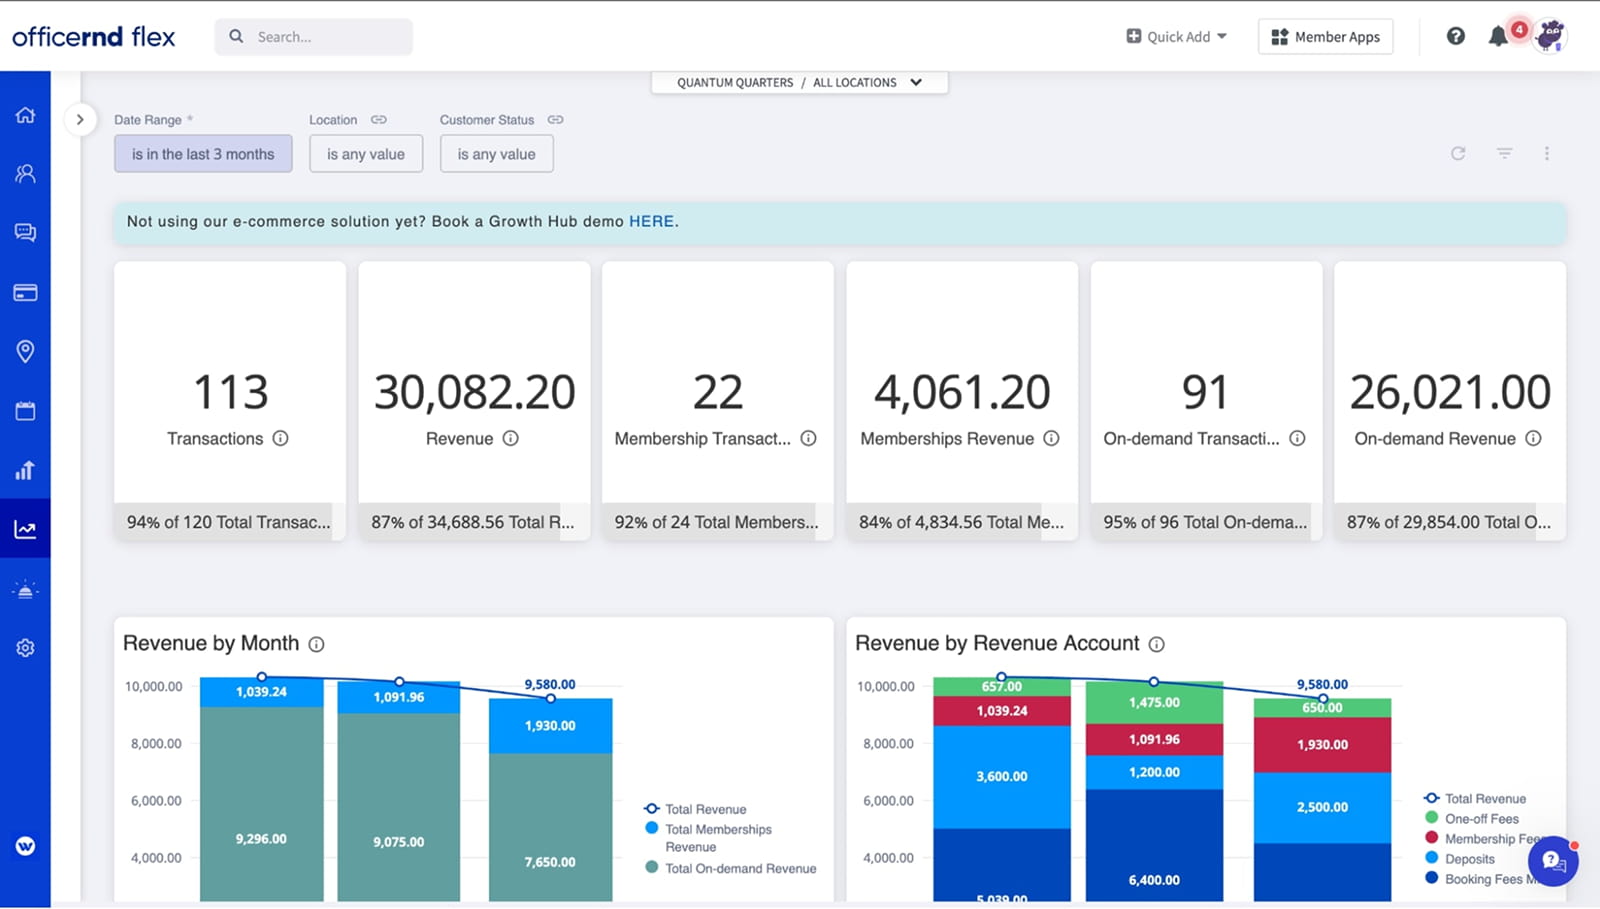
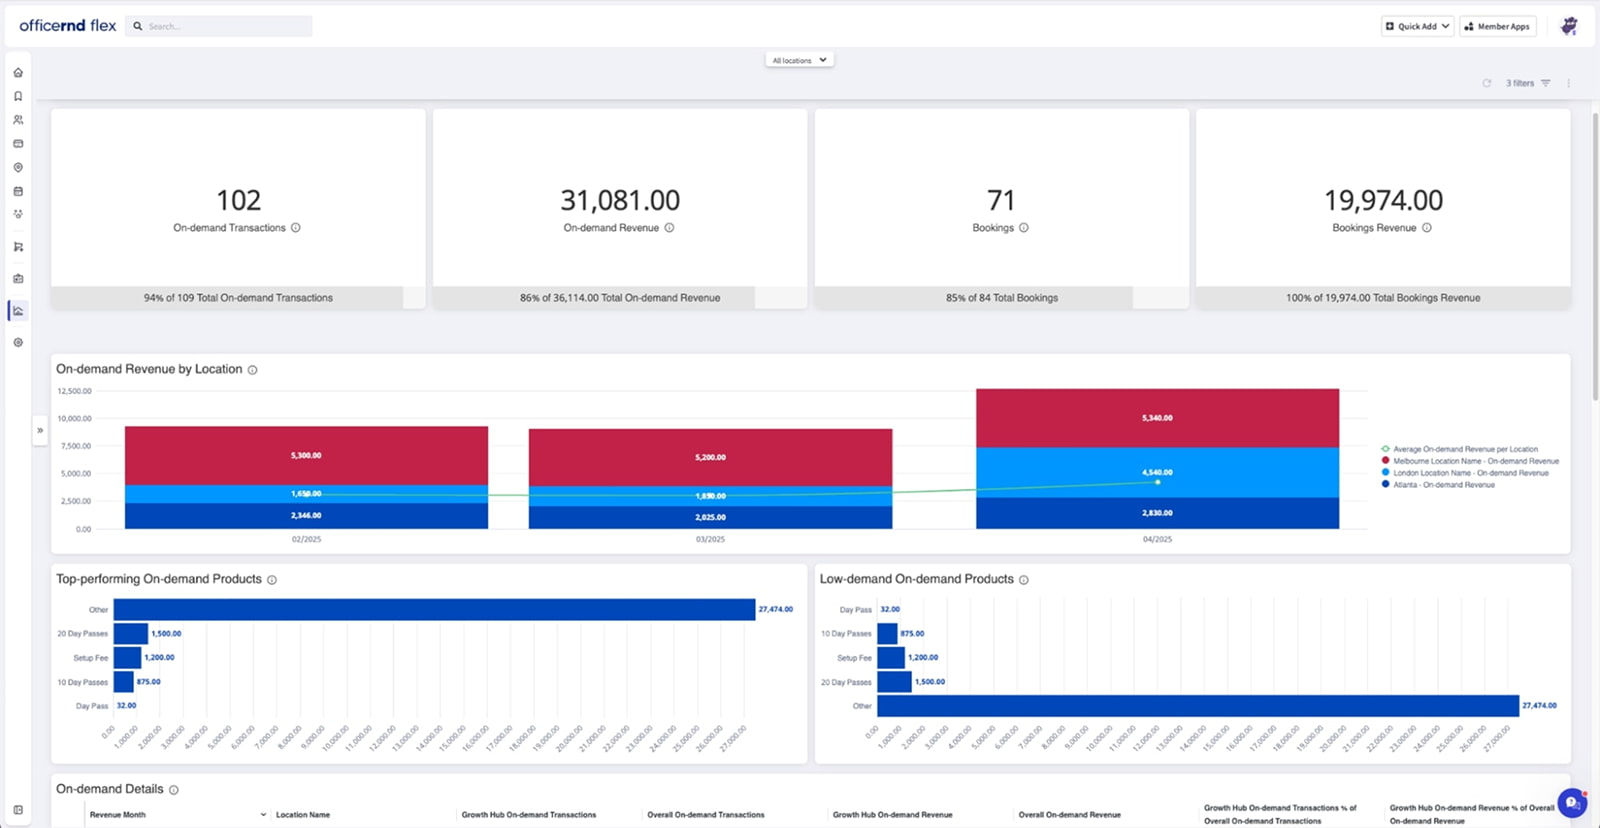
By establishing one source of truth and flexible BI capabilities, developers now have the data and time needed to create new offerings such as the ecommerce product Growth Hub. It enables customers to sell products on their websites to their clients such as day passes for desks, meeting rooms, or offices. From dashboards, customers can see buildings' occupancy rates and other KPIs such as the percentage of revenue coming from recurring coworking space memberships, hourly rentals, and even one-off charges like printing, parking, or food purchases. Because developers integrated Growth Hub with Google Maps Platform, customers' clients can also find spaces on a map and start their journey by clicking on a site. And an integration with Google Analytics enables customers to see conversion rates, promotion performance, and other marketing KPIs.
"One of our beta Growth Hub customers increased bookings sixfold in one month by making more informed decisions with the insights we've enabled with Looker," says Kyosev. "Early adopters are also using Growth Hub dashboards to facilitate their board meetings. On the spot, they dive into the numbers, click to open sources including invoices and spreadsheets, and answer questions on demand. This kind of data drilling was not possible before we used Looker."
Dogfooding enables a data-driven culture and rapid modernization
Now that we've established a central data hub with Looker, we're focused on innovation and providing value to our customers rather than just keeping our solution up and running.
Mihail Kyosev
Head of Product, OfficeRnD
OfficeRnD is also benefiting from its new solutions. The company uses its own platform to manage aspects of its business, test new features, and provide relevant insights for executives and IT, sales, and marketing teams. Kyosev explains, "We have the data in Looker as the source of truth for all our teams including sales, customer service, and operations — and we create reports for our board of directors with Looker. Using our own platform also helps us drive product development, especially when it comes to analytics. When we're unable to use our data to answer questions, we know our customers are probably experiencing similar challenges."
To increase customer insights for its teams, OfficeRnD recently integrated Looker with its Pendo behavioral analytics tool. "As a result, Looker dashboards give our product team statistics about platform usage to understand which features and integrations are popular with different user profiles and regions," says Kyosev. "If we want to win customers in Canada, we can make an informed decision about which integrations we should offer them. And if 80% of customers use two specific integrations, we can follow up with the 20% who aren't using them to see why and help them understand what they're missing."
This quarter, OfficeRnD is building a proof of concept with Gemini in Looker that will enable users to create custom insights with natural language queries. The company is also evaluating the development of revenue-driving features that include two in-app purchase options. One would unlock access to historical data to expand analytics capabilities and the other would give users the option to deliver dashboards and reports to web apps and third-party cloud storage.
OfficeRnD helps coworking and flex space operators streamline operations and grow their businesses with a platform that simplifies member management, bookings, billing, and space management — while enhancing member experiences. Founded in 2015, OfficeRnD powers 3,000+ flex spaces worldwide, employs 150+ people, and operates from four global offices, including its headquarters in Boston.
Industry: Technology
Location: United States
Products: Google Cloud, Looker Embedded, Google Analytics, Google Maps Platform