See the supported connectors for Application Integration.
View execution logs
Application Integration generates detailed execution logs for every run of an integration. You can use the execution logs to troubleshoot failed integration runs, identify the execution status of each step in an integration, and monitor the execution status of both main and sub-integrations. For more information about logging in Application Integration, see Introduction to logs.
View integration execution logs
You can view the execution logs in the Google Cloud console or using the API.
Console
To view the execution logs in the Google Cloud console, perform the following steps:
- In the Google Cloud console, go to the Application Integration page.
- In the navigation menu, click Logs.
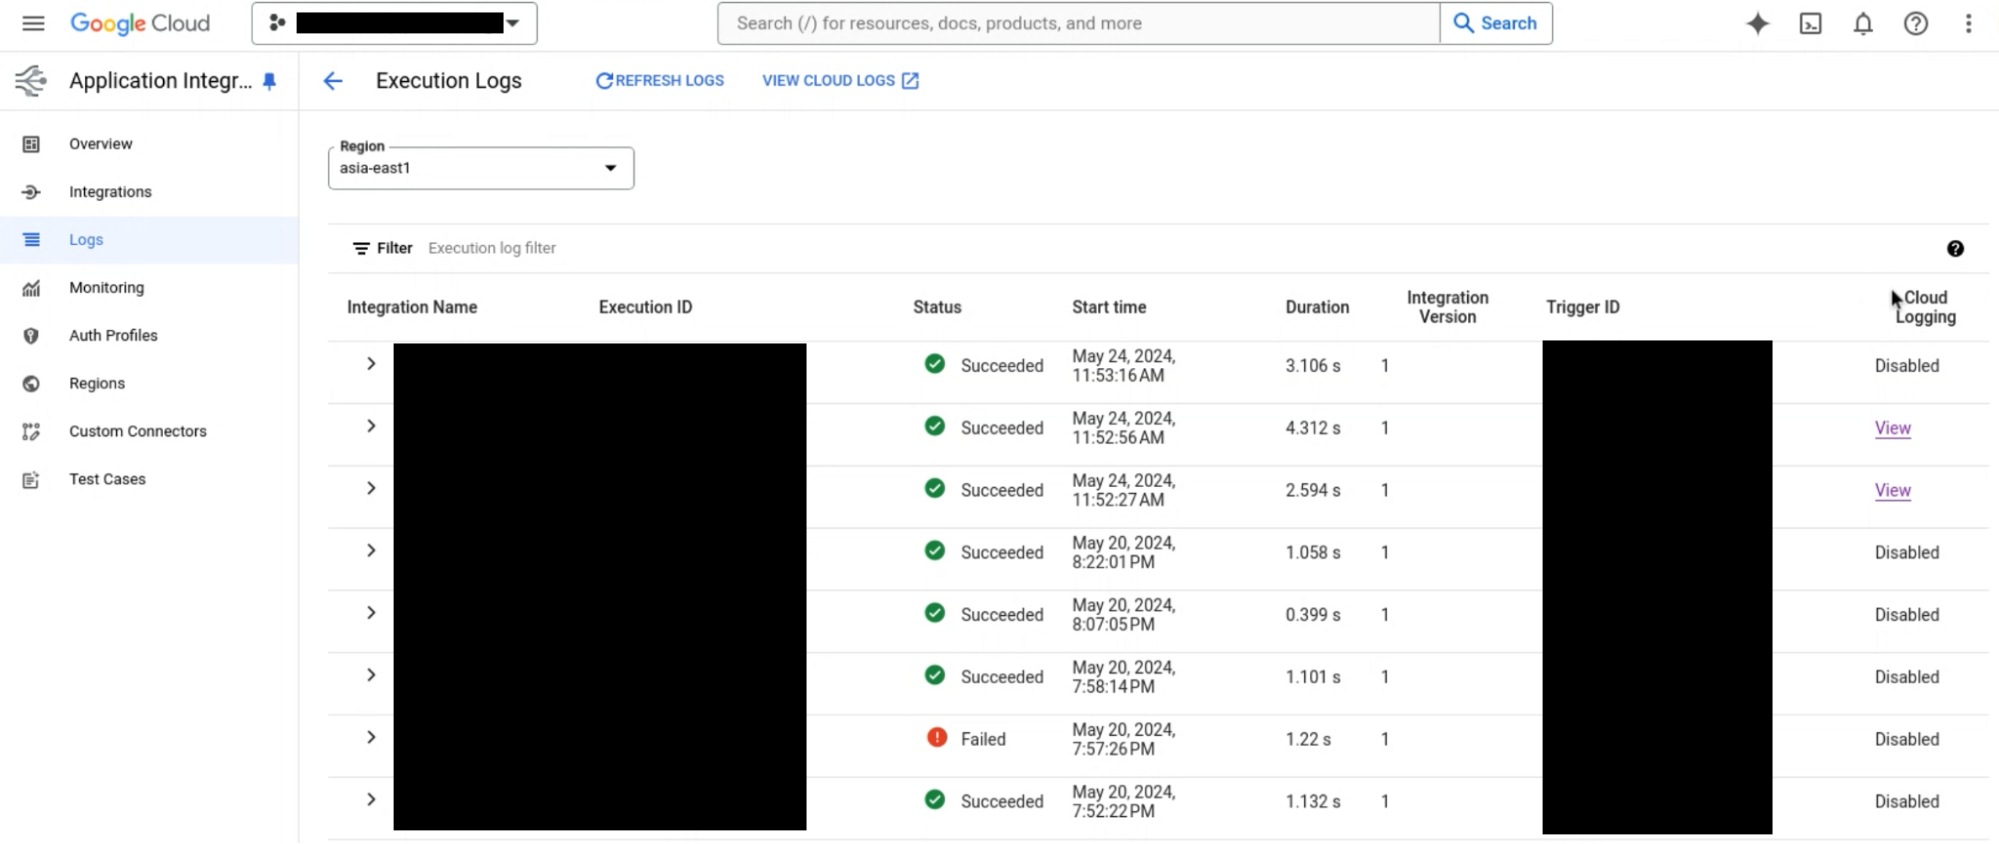
The Execution Logs page appears listing the execution logs generated for the integrations in the default region. The following attributes are displayed for each execution log message:
- Integration name: Name of the integration.
- Execution ID: An unique identifier generated for each run of an integration.
- Status: Status of the integration execution.
- In process: Indicates that the integration is currently being executed.
- Succeeded: Indicates that the integration executed successfully.
- Failed: Indicates that the integration failed to execute.
- Canceled: Indicates that the integration execution was canceled by the user.
- On hold: Indicates that the integration execution is temporarily paused and is waiting for an event or action to be completed.
- Retry on hold: Indicates that the integration execution failed and is waiting for a retry.
- Suspended: Indicates that the integration execution is temporarily paused and requires manual intervention to resume the integration.
- Start time: Timestamp of when the integration started execution.
- Duration: Time taken for execution of the integration.
- Integration Version: Version of the integration executed.
- Trigger ID: ID value of the trigger.
- Cloud Logging: Indicates whether the integration is configured to log to Cloud Logging. If Cloud Logging is enabled, this field provides a link to view logs in Cloud Logging. If Cloud Logging is not enabled, this field is set to Disabled.
- Replayed from: If the integration execution is replayed, this field provides the execution ID of the execution that was replayed. You can replay a published integration execution when you want to rerun an integration with the same parameters as the previous execution. For example, you can replay an execution if an integration failed due to a timeout error or if the output of an integration is not as expected. To learn how to replay executions, see Replay executions.
- To view region specific execution logs, change the region from the Region list.
- Optionally, you can click
refresh
Refresh Logs to reload the current log list.
The following image shows a sample Application Integration Execution Logs page.
API
If the size of the execution logs is greater than 300 MB, Application Integration throws the Response too large error error and logs don't load on the Execution Logs page. In this case, you must use the projects.locations.integrations.executions.list method to get the logs. To view logs using the API method, follow these steps:
- To get the execution ID for which you want to view the execution logs, construct a
GETrequest using theprojects.locations.integrations.executions.listmethod with thesnapshotMetadataWithoutParamsparameter set toTRUE:curl -v -X GET \ -G \ -H "Content-Type: application/json" \ -H "Authorization: Bearer $(gcloud auth print-access-token)" \ 'https://integrations.googleapis.com/v1/projects/PROJECT_ID/locations/LOCATION/integrations/INTEGRATION_NAME/executions' \ -d "snapshotMetadataWithoutParams=true"Replace the following:
- PROJECT_ID: the ID of your Google Cloud project.
- LOCATION: the region of the integration.
- INTEGRATION_NAME: the name of the integration.
Execution IDs are returned in the response. Copy the execution ID for which you want to view logs.
- To get the execution log for the execution ID, construct a
GETrequest using theprojects.locations.integrations.executions.listmethod with a filter on the execution ID that you copied in the previous step:curl -X GET \ -G \ -H "Content-Type: application/json" \ -H "Authorization: Bearer $(gcloud auth print-access-token)" \ 'https://integrations.googleapis.com/v1/projects/PROJECT_ID/locations/LOCATION/integrations/-/executions' \ -d 'filter=executionId=EXECUTION_ID'Replace the following:
PROJECT_ID: the ID of your Google Cloud project.LOCATION: the region of the integration.EXECUTION_ID: the execution ID copied from the previous step.
In the response, see the
ExecutionDetailsfield to view the log details.Alternatively, in the Google Cloud console, you can filter execution logs by the execution ID.
PROJECT_ID: the ID of your Google Cloud project.LOCATION: the region of the integration.INTEGRATION_NAME: the name of the integration.
Example: Filter logs
If you want to filter the response to list logs for all integrations expect for one integration, use the following format:
curl -X GET \
    -G \
    -H "Content-Type: application/json" \
    -H "Authorization: Bearer $(gcloud auth print-access-token)" \
    'https://integrations.googleapis.com/v1/projects/PROJECT_ID/locations/LOCATION/integrations/-/executions' \
    -d 'filter=workflowName!=INTEGRATION_NAME'
Replace the following:
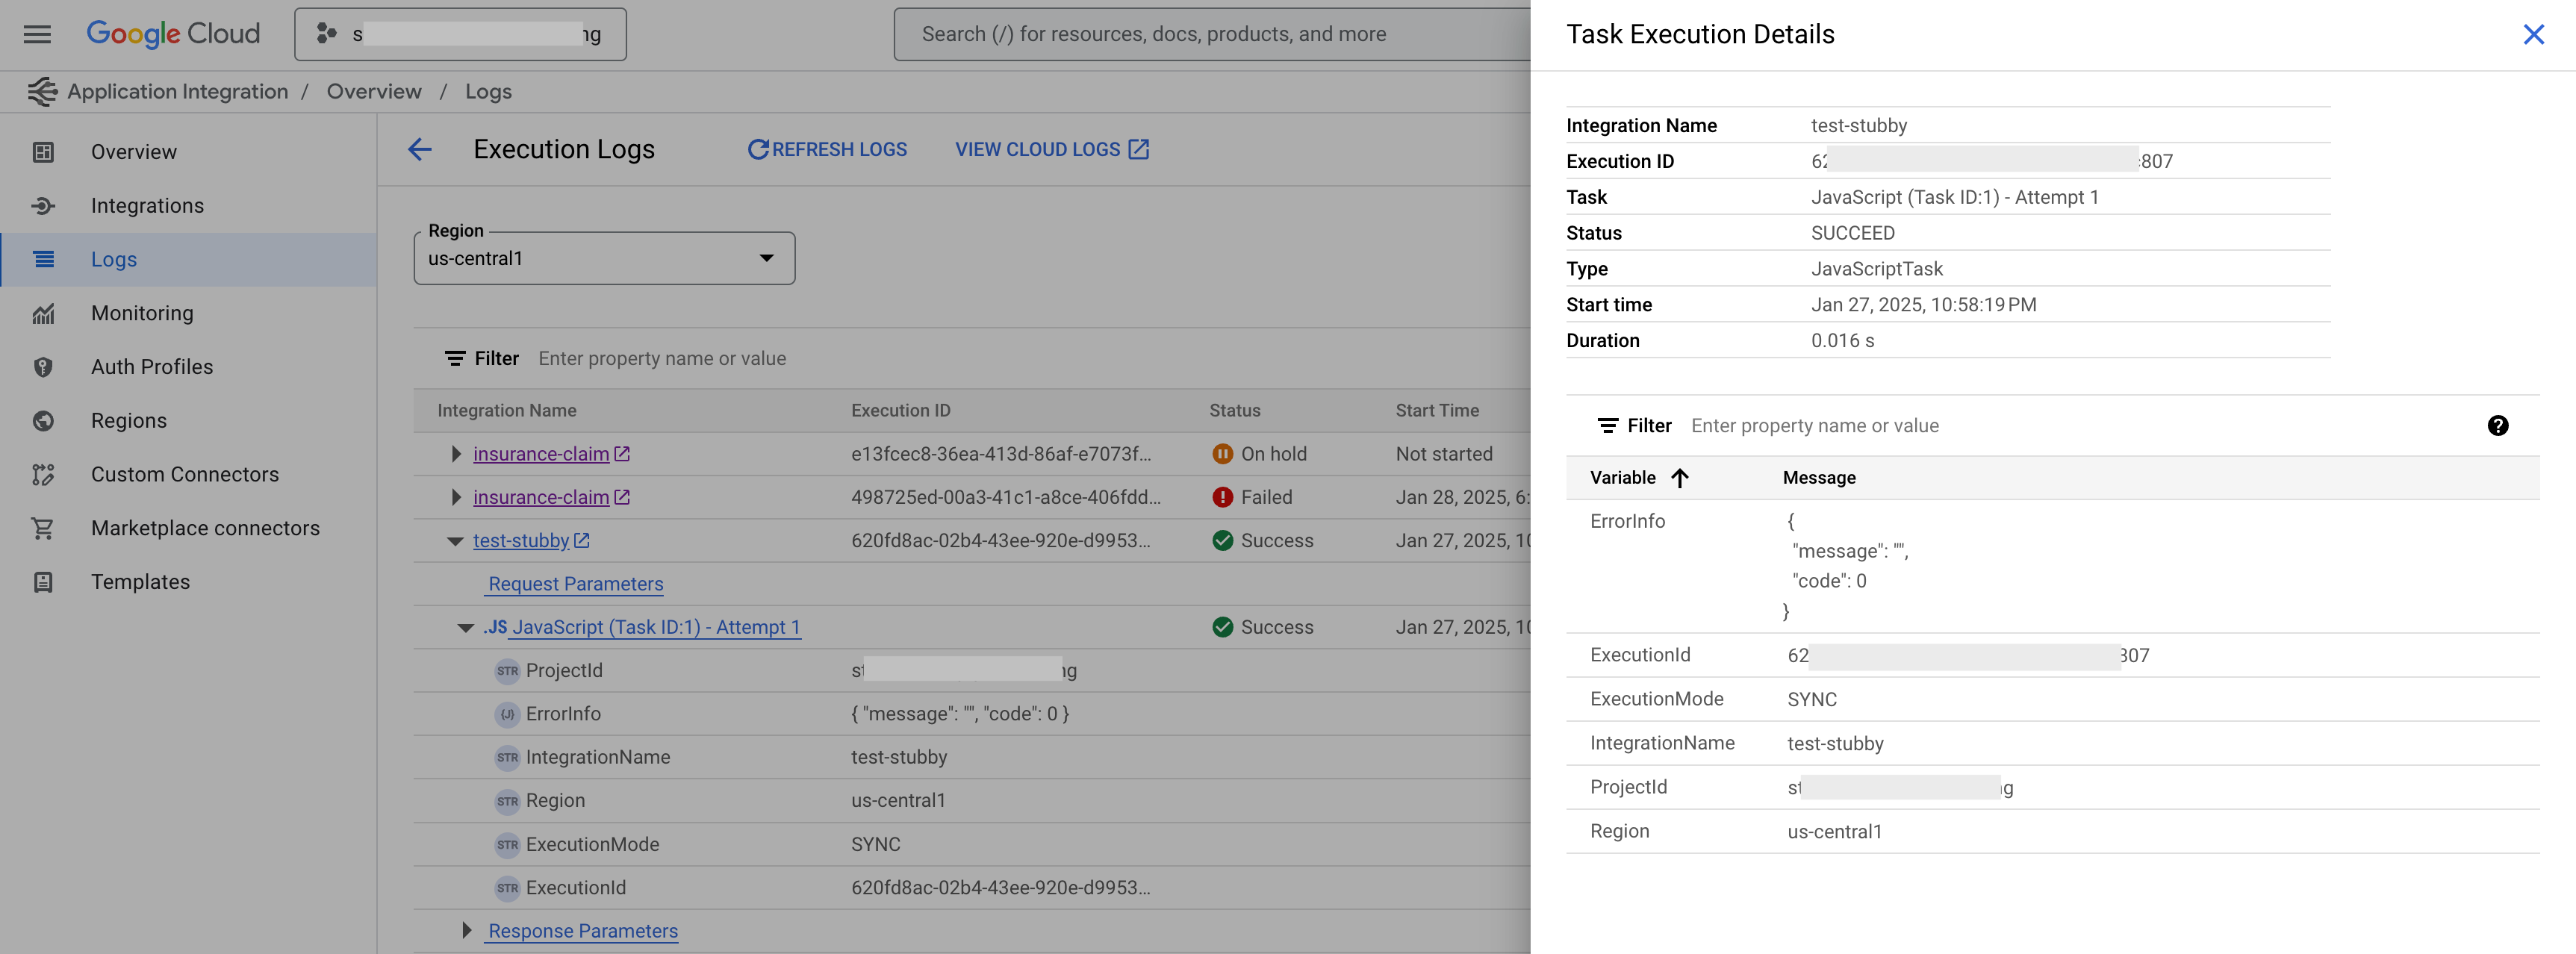
View task execution details
You can view detailed logs about the execution of each task in an integration or sub-integration. To view the task execution details, go to the Execution Logs page and expand the name of the integration for which you want to view the task execution details.
The Execution Logs page displays a list of execution logs for the integration. Each execution log corresponds to a specific run of the integration.
- To view the execution details of a specific task, click the task name. The Task Execution Details pane appears displaying the execution details of the task.
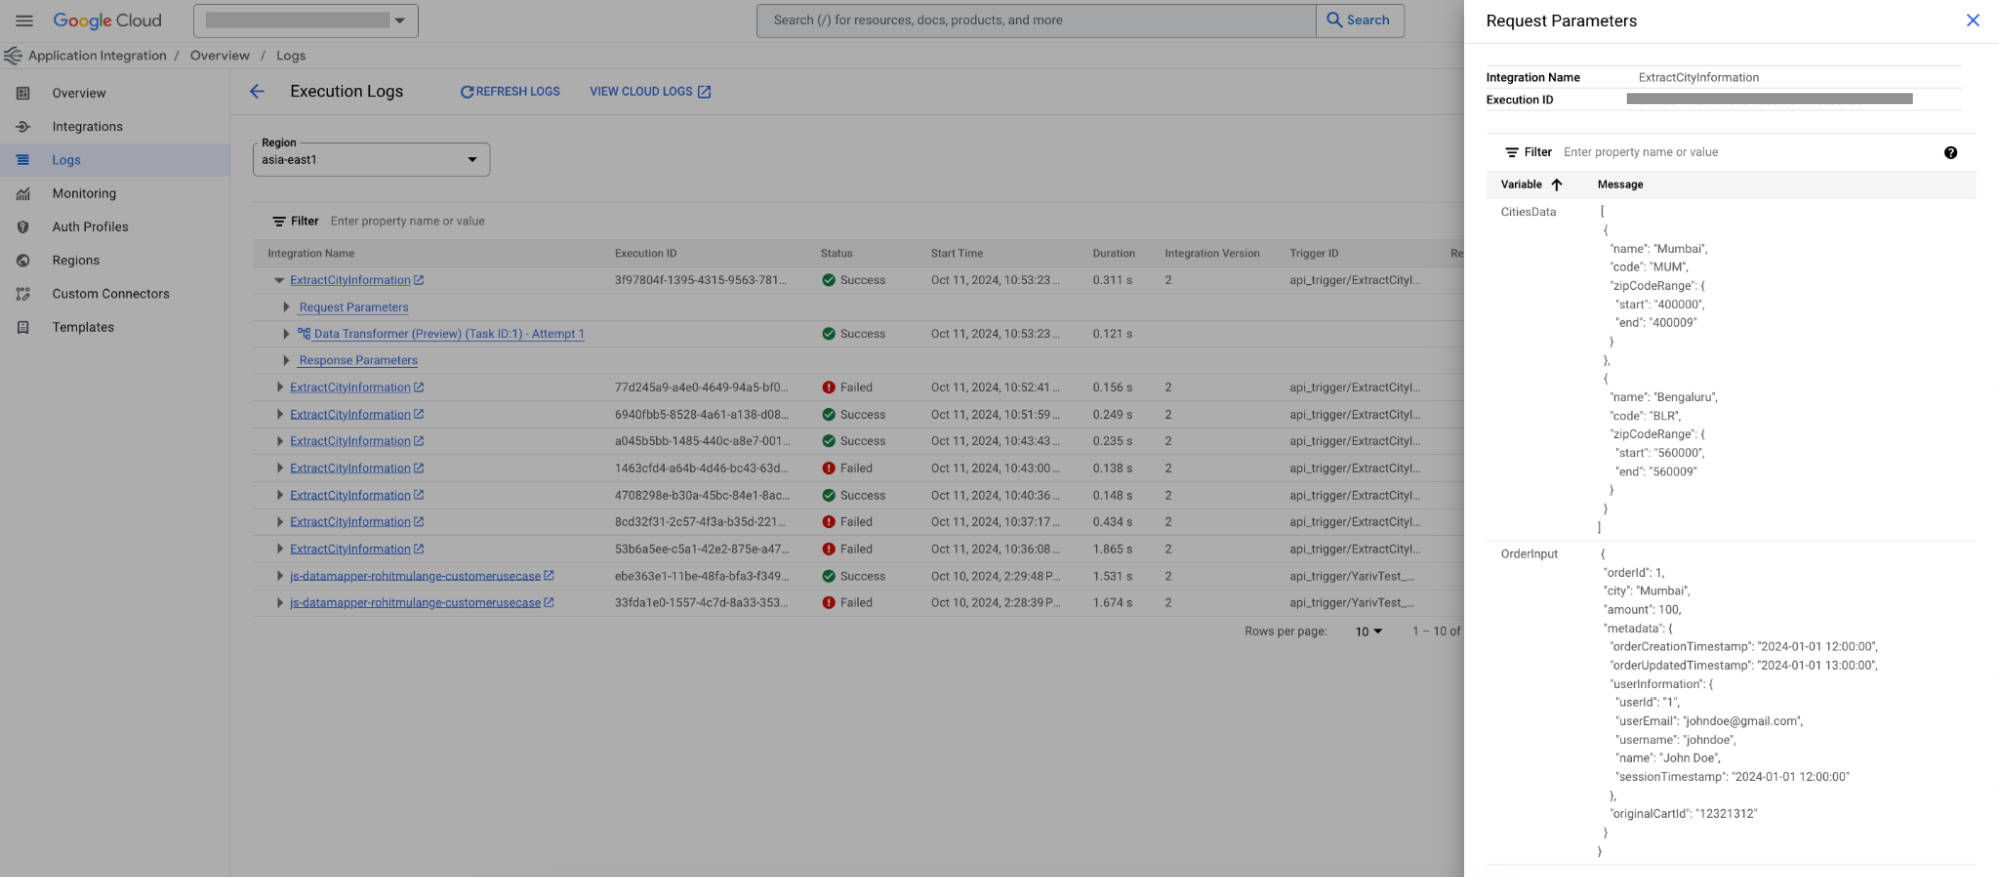
- To view the request and response parameters of the task, click Request Parameters or Response Parameters.
- To view the execution logs of a sub-integration, expand the task name and click the sub-integration name. This applies to Call Integration task, For Each Parallel task, For Each Loop task, and the While Loop task.
Filter logs
You can filter the logs based on criteria such as, integration name, execution ID, date or time range, execution status, variable type, and variable name or value. To add a filter for the test case executions, use the following format:
Integration name:INTEGRATION_NAME:TEST_CASE_NAME.
Replace the following:
INTEGRATION_NAME: the integration name that contains functional tests.TEST_CASE_NAME: the name of the test case for which you want to list the test executions.
Example: Integration name:example-integration-name:example-test-case.
Use logs to troubleshoot
The following section explains how to troubleshoot failures for the following uses cases:
Troubleshoot integration failures
Execution log messages can be valuable resources when troubleshooting unsuccessful integration runs.
For example, if an integration failed to run in a specific timeframe, use these steps to access and filter the logs to troubleshoot the failure:
- Search for or select the integration to troubleshoot from the Integrations list and click to open the integration editor.
- Click Logs in the toolbar of the integration editor to view the log messages.
- In the Execution log filter field, select Integration name and enter the name of the integration for which you want to view the logs.
- Click Enter.
- To display failed integrations, in the Execution log filter field, select Execution status to display the status list and then select Failed.
- To display failed integrations between a specific time range, in the Execution log filter field, select Start date after and enter the desired time in the valid format. Then, select End date before and enter the desired time. Multiple filters are combined using the AND condition by default.
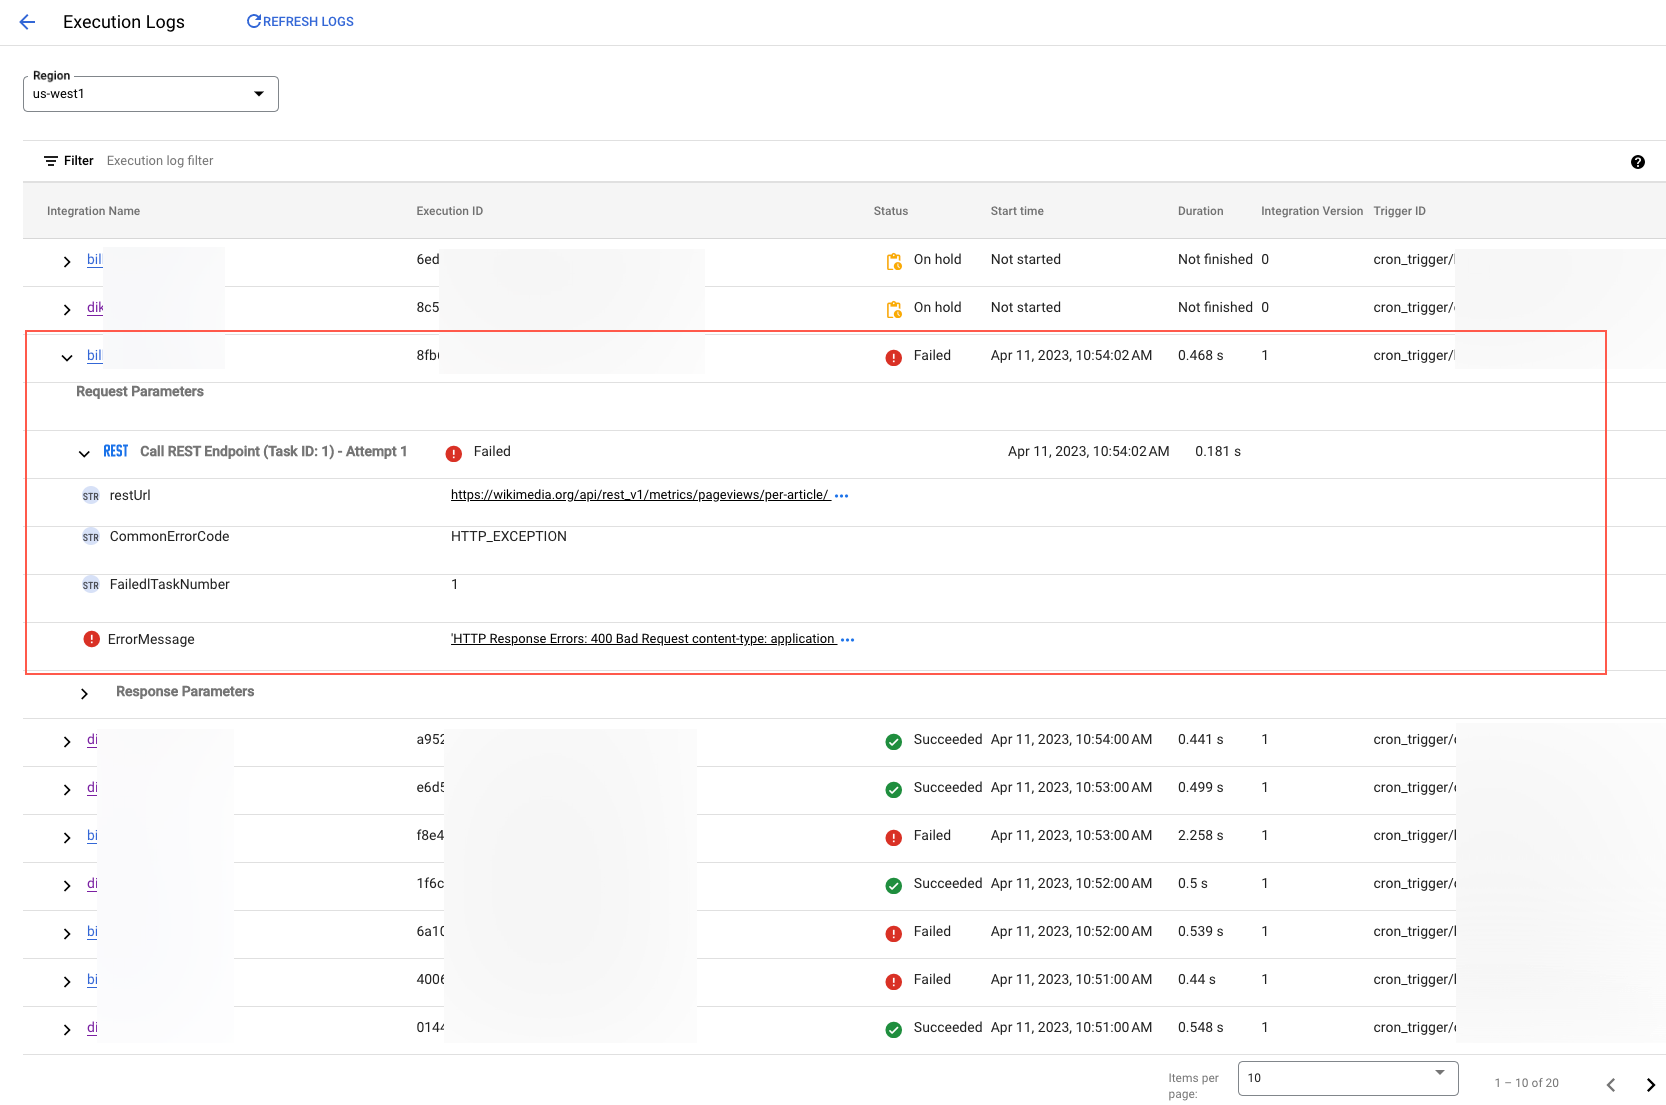
If the integration failed during the filtered time frame, the Execution Logs page displays a list of log messages. Each log message corresponds to a specific failed run of the integration.
View stack trace exceptions
To view the list of exceptions, click on any log message. Click the links in each exception message to view the complete stack trace of the exception.
Trace connector failures
You can use the execution log messages to troubleshoot and trace failed connectors task executions. Log data of a failed connector task is stored using Cloud Logging and can be viewed in the Logs Explorer.
Perform the following steps to access the log data of a failed connector task from Application Integration:
- Go to the Execution Logs page of your desired integration.
- Expand the log message of your failed execution, and stack trace to the row containing the failed Connectors task.
- In the Status column, click Failed.
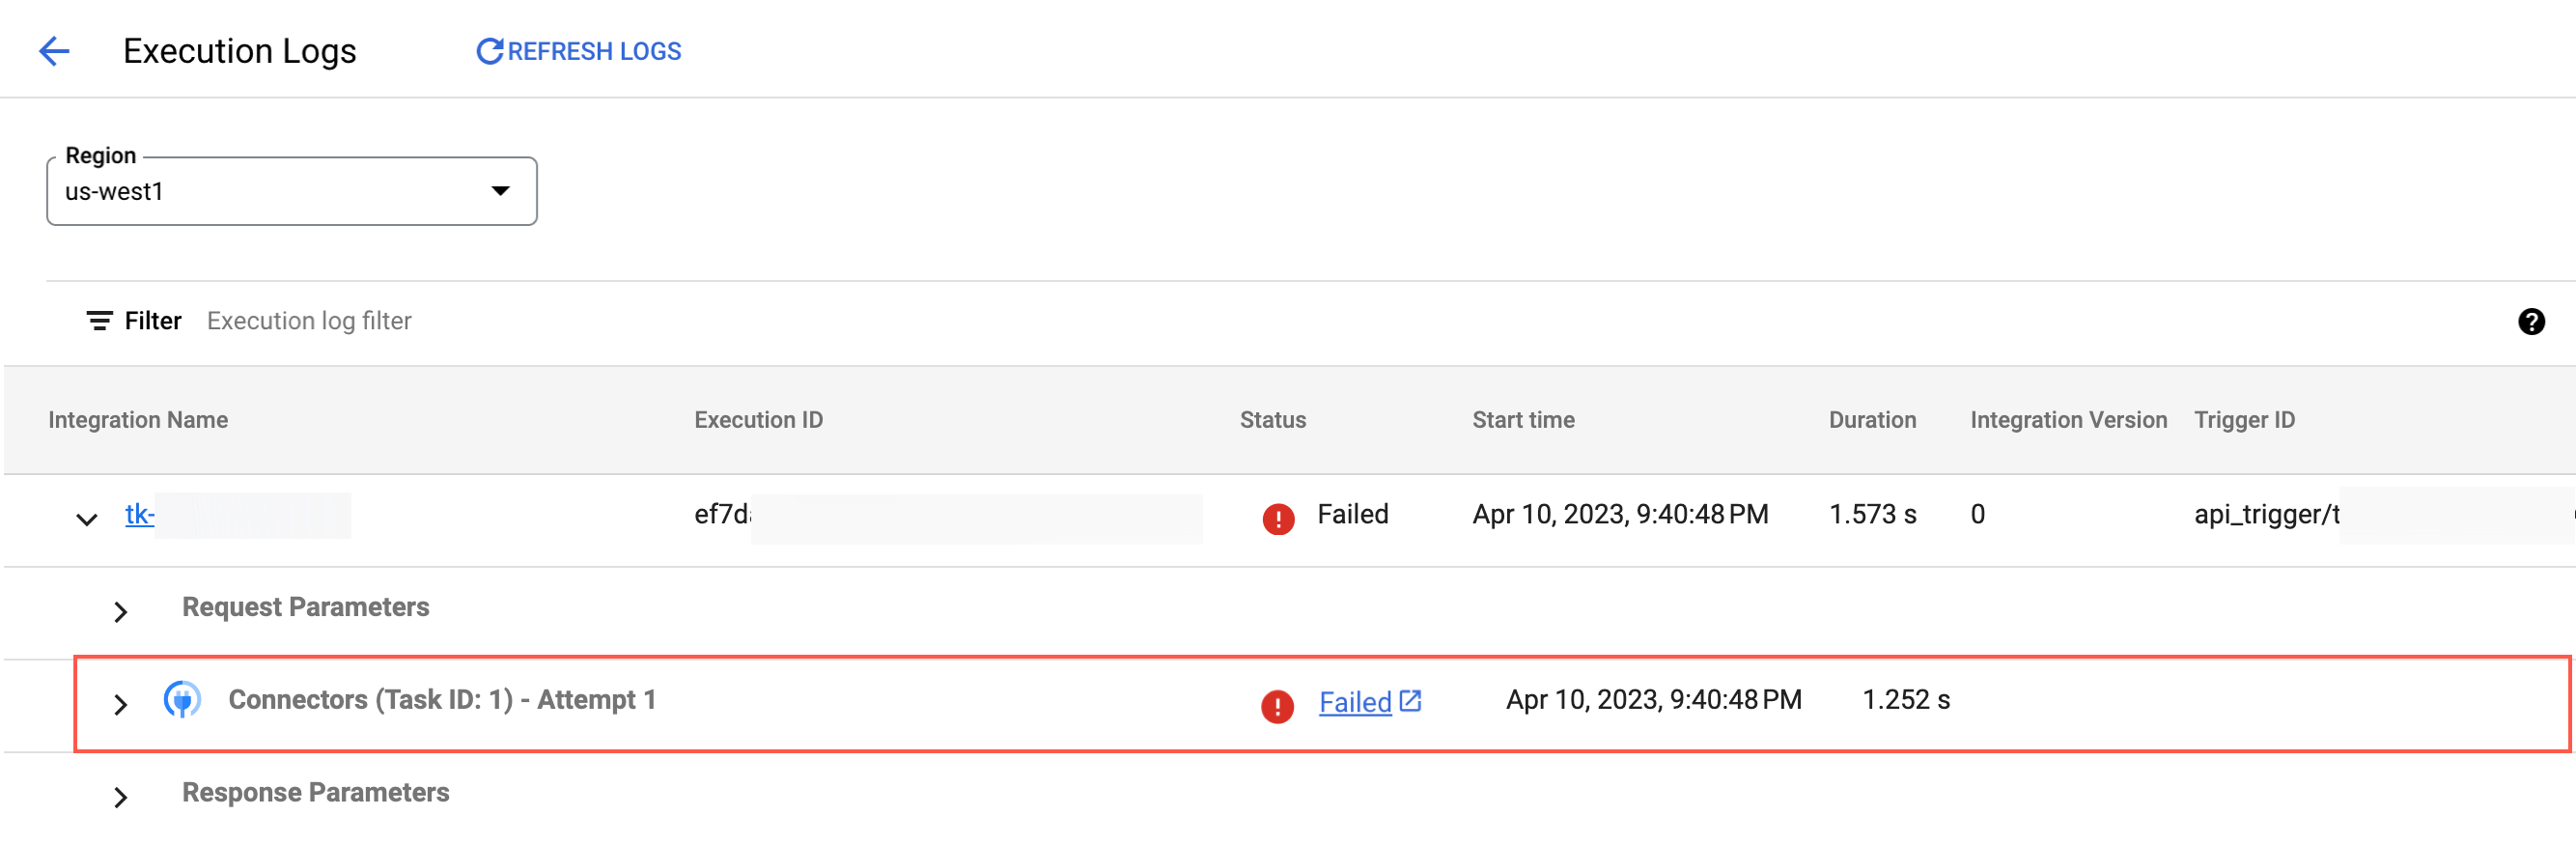
Application Integration automatically runs the required query for the failed connectors task and opens the Logs Explorer page to display the detailed execution log data.
To manually retrieve the log data of a failed connectors task, you can run the following query in the Logs Explorer's Query page. For more information about how to use Logs Explorer, see Logs Explorer interface.
Query format
resource.type="connectors.googleapis.com/Connection"
jsonPayload.integration_connectors_trace_id="EXECUTION_ID_EXECUTION_TASK_ID_EXECUTION_ATTEMPT_NUMBER"
Example
resource.type="connectors.googleapis.com/Connection"
jsonPayload.integration_connectors_trace_id="9db51e4b-7d57-473d-931f-cc27b282dfad_1_2"
Download logs
You can download logs for a specific integration execution to help with debugging and analysis. The logs contain detailed information about the execution process, including timestamps, events, and any errors encountered.
To download the execution logs of an integration, perform the following steps:
- Go to the Execution Logs page.
- In the row corresponding to the integration execution for which you want to download the logs, click (Actions menu) and then select Download.
The execution logs are downloaded as a JSON file to your browser's default download folder.
Limitation
- If local logging is disabled for an integration, then the execution logs are not generated for that integration.
What's next
- For information about logs in Application Integration, see Introduction to logs.
- Learn about Test Cases.