Accelerate State of DevOps 2021
What separates the highest- and lowest-performing software teams? In the 2021 Report, we examine the practices that drive successful software delivery and operational performance so you can compare your organization to elite performers. You can then use our findings to improve key outcomes, accelerate innovation, and break away from the pack.
Executive summary
This year’s Accelerate State of DevOps Report by the DevOps Research and Assessment (DORA) team at Google Cloud represents seven years of research and data from more than 32,000 professionals worldwide.
Our research examines the capabilities and practices that drive software delivery, operational, and organizational performance. By leveraging rigorous statistical techniques, we seek to understand the practices that lead to excellence in technology delivery and to powerful business outcomes. To this end, we present data-driven insights about the most effective and efficient ways to develop and deliver technology.
Our research continues to show that excellence in software delivery and operational performance drives organizational performance in technology transformations. To allow teams to benchmark themselves against the industry, we use a cluster analysis to form meaningful performance categories (such as low, medium, high, or elite performers). After your teams have a sense of their current performance relative to the industry, you can use the findings from our predictive analysis to target practices and capabilities to improve key outcomes, and eventually your relative position. This year we emphasize the importance of meeting reliability targets, integrating security throughout the software supply chain, creating quality internal documentation, and leveraging the cloud to its fullest potential. We also explore whether a positive team culture can mitigate the effects of working remotely as a result of the COVID-19 pandemic.
To make meaningful improvements, teams must adopt a philosophy of continuous improvement. Use the benchmarks to measure your current state, identify constraints based on the capabilities investigated by the research, and experiment with improvements to relieve those constraints. Experimentation will involve a mix of victories and failures, but in both scenarios teams can take meaningful actions as a result of lessons learned.
Key findings
The highest performers are growing and continue to raise the bar.
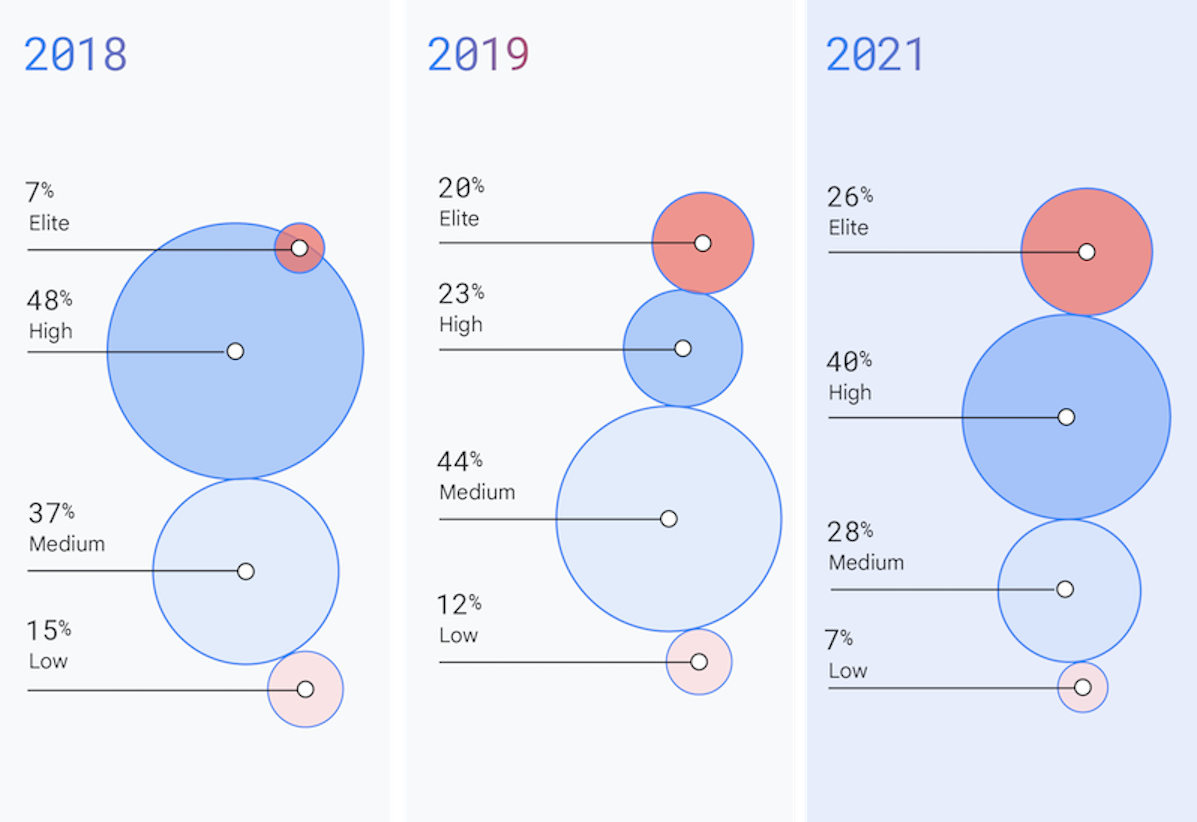
Elite performers now make up 26% of teams in our study, and have decreased their lead times for changes to production. The industry continues to accelerate, and teams see meaningful benefits from doing so.
SRE and DevOps are complementary philosophies.
Teams that leverage modern operational practices outlined by our site reliability engineering (SRE) friends report higher operational performance. Teams that prioritize both delivery and operational excellence report the highest organizational performance.
More teams are leveraging the cloud and see significant benefits from doing so.
Teams continue to move workloads to the cloud and those that leverage all five capabilities of cloud see increases in software delivery and operational (SDO) performance, and in organizational performance. Multicloud adoption is also on the rise so that teams can leverage the unique capabilities of each provider.
A secure software supply chain is both essential and drives performance.
Given the significant increase in malicious attacks in recent years, organizations must shift from reactive practices to proactive and diagnostic measures. Teams that integrate security practices throughout their software supply chain deliver software quickly, reliably, and safely.
Good documentation is foundational for successfully implementing DevOps capabilities.
For the first time, we measured the quality of internal documentation and practices that contribute to this quality. Teams with high-quality documentation are better able to implement technical practices and perform better as a whole.
A positive team culture mitigates burnout during challenging circumstances.
Team culture makes a large difference to a team’s ability to deliver software and meet or exceed their organizational goals. Inclusive teams with a generative1,2 culture experienced less burnout during the COVID-19 pandemic.
____________________________
1. From Westrum’s typology organization culture, a generative team culture refers to teams that are highly cooperative, break down silos, let failure lead to inquiry, and share the risk of decision-making.
2. Westrum, R. (2004). “A typology of organizational cultures.” BMJ Quality & Safety, 13(suppl 2), ii22-ii27.
How do we compare?
Are you curious about how your team compares to others in the industry? This section includes the latest benchmark assessment of DevOps performance.
We examine how teams develop, deliver, and operate software systems, and then segment respondents into four performance clusters: elite, high, medium, and low performers. By comparing your team’s performance to the performance of each cluster, you can see where you are in the context of the findings described throughout this report.
Software delivery and operational performance
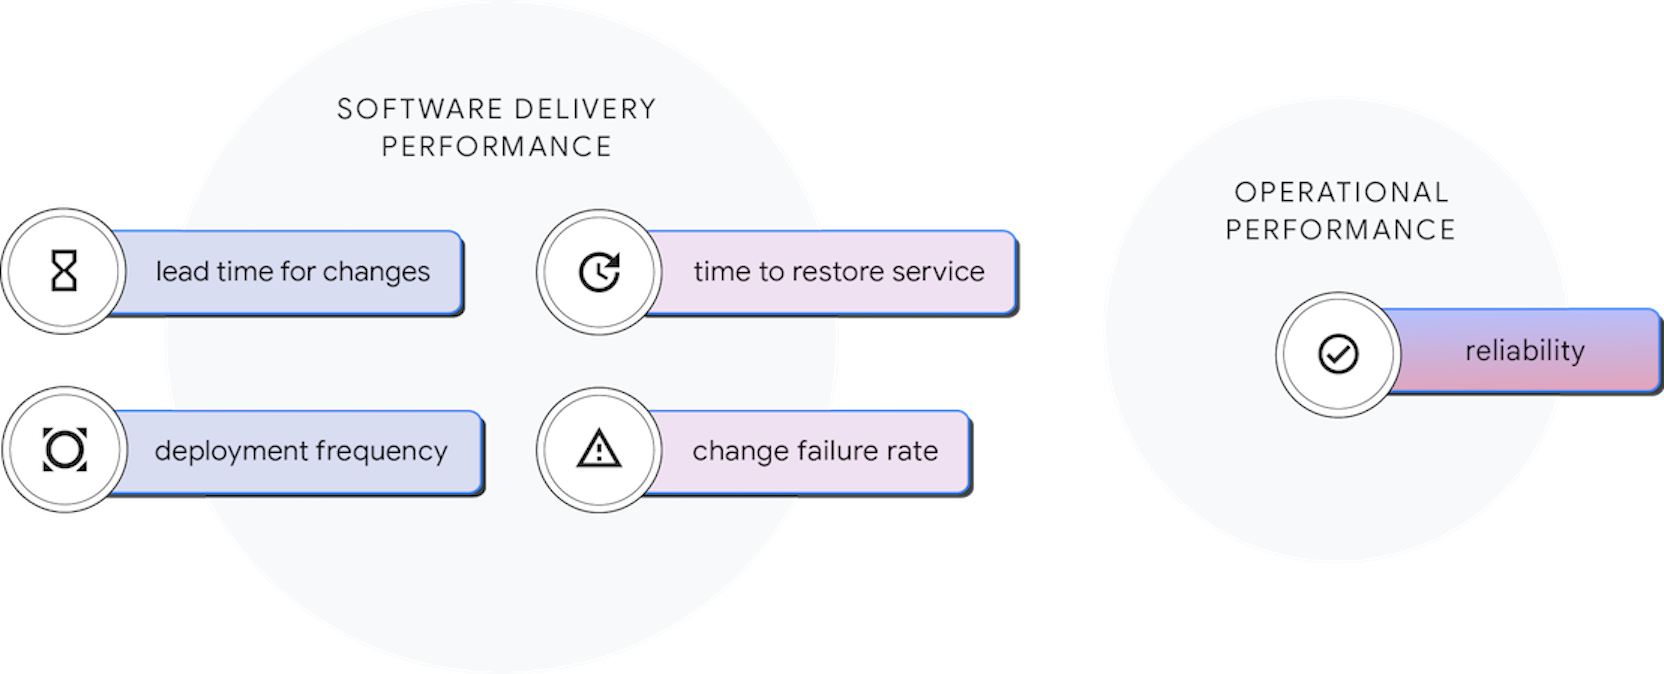
To meet the demands of an ever-changing industry, organizations must deliver and operate software quickly and reliably. The faster your teams can make changes to your software, the sooner you can deliver value to your customers, run experiments, and receive valuable feedback. With seven years of data collection and research, we have developed and validated four metrics that measure software delivery performance. Since 2018, we’ve included a fifth metric to capture operational capabilities.
Teams that excel in all five measures exhibit exceptional organizational performance. We call these five measures software delivery and operational (SDO) performance. Note that these metrics focus on system-level outcomes, which helps avoid the common pitfalls of software metrics, such as pitting functions against each other and making local optimizations at the cost of overall outcomes.
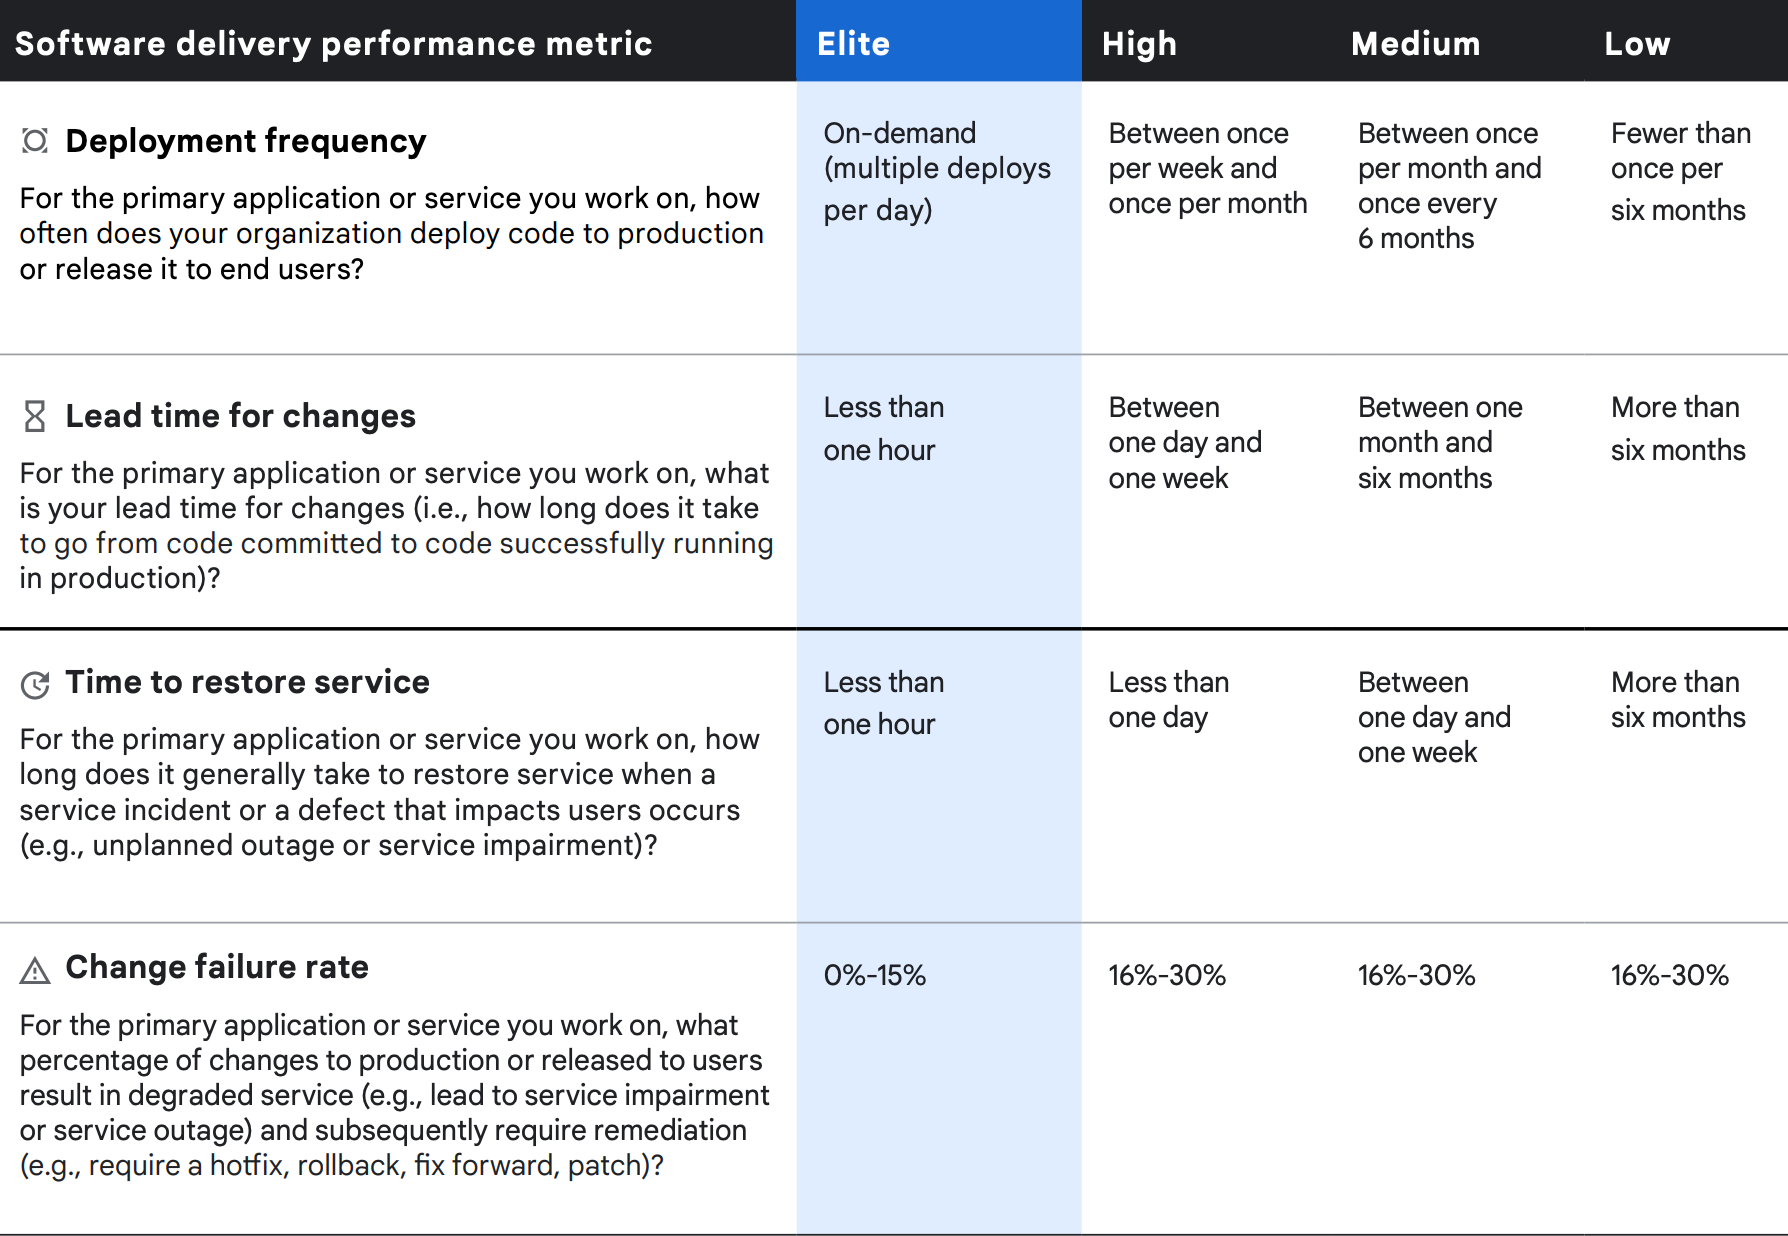
Four metrics of delivery performance
The four metrics of software delivery performance can be considered in terms of throughput and stability. We measure throughput using lead time of code changes (that is, time from code commit to release in production), and deployment frequency. We measure stability using time to restore a service after an incident and change failure rate.
Once again, cluster analysis of the four software delivery metrics reveals four distinct performance profiles—elite, high, medium, and low—with statistically significant differences in throughput and stability measures among them. As in previous years, our highest performers do significantly better on all four measures, and low performers do significantly worse in all areas.
The fifth metric: from availability to reliability
The fifth metric represents operational performance and is a measure of modern operational practices. The primary metric for operational performance is reliability, which is the degree to which a team can keep promises and assertions about the software they operate. Historically we have measured availability rather than reliability, but because availability is a specific focus of reliability engineering, we’ve expanded our measure to reliability so that availability, latency, performance, and scalability are more broadly represented. Specifically, we asked respondents to rate their ability to meet or exceed their reliability targets. We found that teams with varying degrees of delivery performance see better outcomes when they also prioritize operational performance.
Like previous reports, we compared elite performers to low performers to illustrate the impact of specific capabilities. However, this year we sought to account for the impact of operational performance. In all delivery performance categories (low through elite), we saw major benefits across multiple outcomes for teams that prioritized meeting or exceeding their reliability targets.
The industry continues to accelerate
Every year we continue to see the industry evolve and accelerate the ability to deliver software with more speed and better stability. For the first time, our high and elite performers make up two-thirds of respondents. Additionally, this year’s elite performers have once again raised the bar, decreasing their lead time for changes when compared to previous assessments (for example, improving from less than one day in 2019 to less than one hour in 2021). Additionally, for the first time, only elite performers have minimized their change failure rate compared to previous years where medium and high performers were able to do the same.
Throughput and stability
Throughput
Deployment frequency
Consistent with previous years, the elite group reported that it routinely deploys on demand and performs multiple deployments per day. By comparison, low performers reported deploying fewer than one time per six months (less than two per year), which is again a decrease in performance when compared to 2019. The normalized annual deployment numbers range from 1,460 deploys per year (calculated as four deploys per day x 365 days) for the highest performers to 1.5 deploys per year for low performers (average of two deploys and one deploy). This analysis approximates that elite performers deploy code 973 times more frequently than low performers.
Lead time for changes
An improvement from 2019, elite performers report change lead times of less than one hour, with change lead time measured as the time from code committed to having that code successfully deployed in production. This is an increase in performance when compared to 2019, when our highest performers reported change lead times of less than one day. In contrast to our elite performers, low performers required lead times greater than six months. With lead times of one hour for elite performers (a conservative estimate at the high end of “less than one hour”) and 6,570 hours for low performers—calculated by taking the average of 8,760 hours per year and 4,380 hours over six months—the elite group has 6,570 times faster change lead times than low performers.
Stability
Time to restore service
The elite group reported time to restore service of less than one hour, while low performers reported greater than six months. For this calculation, we chose conservative time ranges: one hour for high performers and the mean of one year (8,760 hours) and six months (4,380 hours) for low performers. Based on these numbers, elites have 6,570 times faster time to restore service than low performers. Time to restore service performance stayed the same for elite performers and increased for low performers when compared to 2019.
Change failure rate
Elite performers reported a change failure rate between 0%–15%, while low performers reported change failure rates of 16%–30%. The mean between these two ranges shows a 7.5% change failure rate for elite performers and 23% for low performers. Change failure rates for elite performers are three times better than for low performers. This year, change failure rates stayed the same for elite performers and improved for low performers when compared to 2019, but worsened for groups in between.
Elite performers
Comparing the elite group against the low performers, we find that elite performers have:
- 973x more frequent code deployments
- 6570x faster lead time from commit to deploy
- 3x lower change failure rate (changes are 1/3 less likely to fail)
- 6570x faster time to recover from incidents
How do we improve?
How do we improve SDO and organizational performance? Our research provides evidence-based guidance to help you focus on the capabilities that drive performance.
This year’s report examined the impact of cloud, SRE practices, security, technical practices, and culture. Throughout this section we introduce each of these capabilities and note their impact on a variety of outcomes. For those of you who are familiar with DORA’s State of DevOps research models, we’ve created an online resource that hosts this year’s model and all previous models.3
____________________________
3. https://devops-research.com/models.htm
____________________________
Cloud
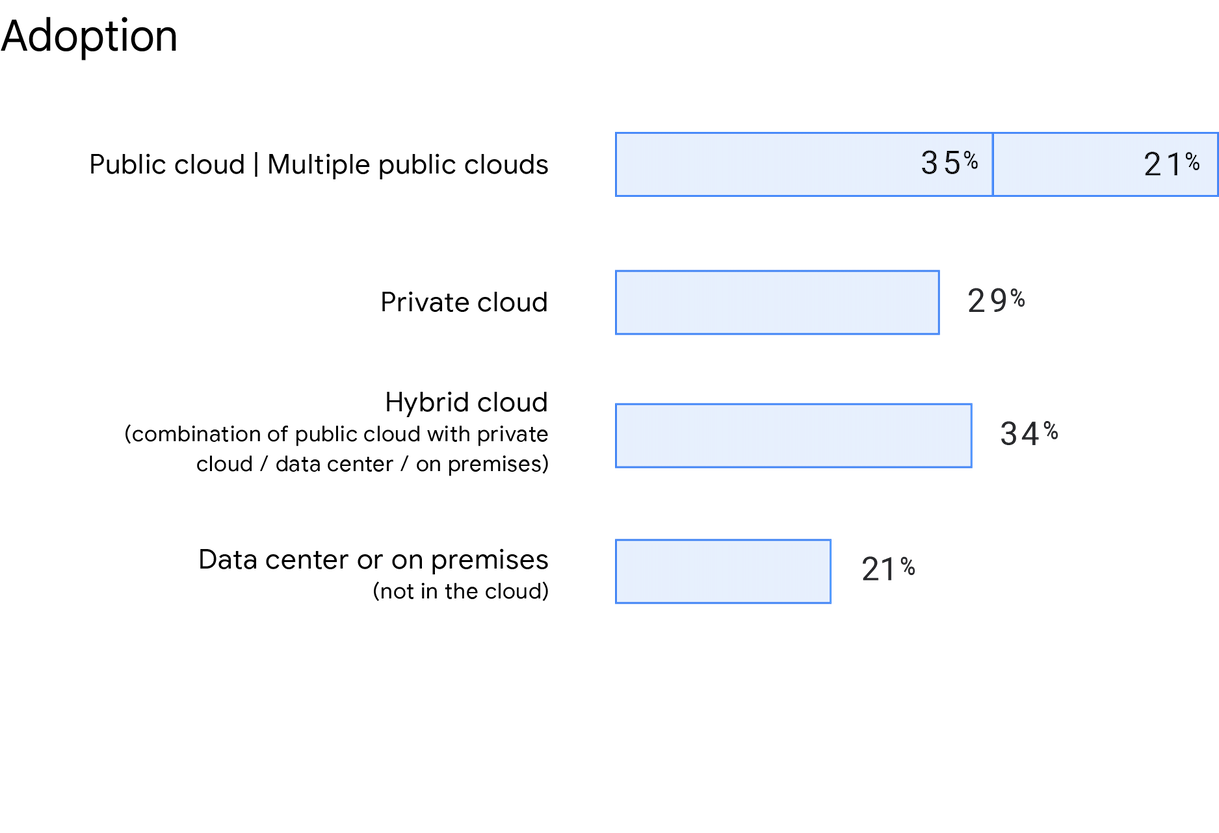
Consistent with Accelerate State of DevOps 2019, an increasing number of organizations are choosing multicloud and hybrid cloud solutions. In our survey, respondents were asked where their primary service or application was hosted, and public cloud usage is on the rise. 56% of respondents indicated using a public cloud (including multiple public clouds), a 5% increase from 2019. This year we also asked specifically about multicloud usage, and 21% of respondents reported deploying to multiple public clouds. 21% of respondents indicated not using the cloud, and instead used a data center or on-premises solution. Finally, 34% of respondents report using a hybrid cloud and 29% report using a private cloud.
Accelerating business outcomes with hybrid and multicloud
This year we see growth in use of hybrid and multicloud, with significant impact on the outcomes businesses care about. Respondents who use hybrid or multicloud were 1.6 times more likely to exceed their organizational performance targets than those who did not. We also saw strong effects on SDO, with users of hybrid and multicloud 1.4 times more likely to excel in terms of deployment frequency, lead time for changes, time to recover, change failure rate, and reliability.
Why multicloud?
Similar to our 2018 assessment, we asked respondents to report their rationale for leveraging multiple public cloud providers. Instead of selecting all that apply, this year we asked respondents to report their primary reason for using multiple providers. Over a quarter (26%) of respondents did so to leverage the unique benefits of each cloud provider. This suggests that when respondents select an additional provider, they look for differentiation between their current provider and alternatives. The second most common reason for moving to multicloud was availability (22%). Unsurprisingly, respondents who have adopted multiple cloud providers were 1.5 times more likely to meet or exceed their reliability targets.
Primary reason for using multiple providers
Leverage unique benefits for each provider | 26% |
Availability | 22% |
Disaster recovery | 17% |
Legal compliance | 13% |
Other | 08% |
Negotiation tactic or procurement requirement | 08% |
Lack of trust in one provider | 06% |
Leverage unique benefits for each provider
26%
Availability
22%
Disaster recovery
17%
Legal compliance
13%
Other
08%
Negotiation tactic or procurement requirement
08%
Lack of trust in one provider
06%
Benchmarks changes
How you implement cloud infrastructure matters
Historically, we find that not all respondents adopt cloud in the same way. This leads to variation in how effective cloud adoption is for driving business outcomes. We addressed this limitation by focusing on the essential characteristics of cloud computing—as defined by the National Institute of Standards and Technology (NIST)—and using that as our guide. Using the NIST Definition of Cloud Computing, we investigated the impact of essential practices on SDO performance rather than just investigating cloud adoption’s impact on SDO.
For the third time, we find that what really matters is how teams implement their cloud services, not just that they are using cloud technologies. Elite performers were 3.5 times more likely to have met all essential NIST cloud characteristics. Only 32% of respondents who said they were using cloud infrastructure agreed or strongly agreed that they met all five of the essential characteristics of cloud computing defined by NIST, an increase of 3% from 2019. Overall, usage of NIST’s characteristics of cloud computing have increased by 14%–19%, with rapid elasticity showing the largest increase.
On-demand self-service
Consumers can provision computing resources as needed, automatically, without any human interaction required on the part of the provider.
73% of respondents used on-demand self-service, a 16% increase from 2019.
Broad network access
Capabilities are widely available and can be accessed through multiple clients such as mobile phones, tablets, laptops, and workstations.
74% of respondents used broad network access, a 14% increase from 2019.
Resource pooling
Provider resources are pooled in a multi-tenant model, with physical and virtual resources dynamically assigned and reassigned on demand. The customer generally has no direct control over the exact location of the provided resources, but can specify location at a higher level of abstraction, such as country, state, or data center.
73% of respondents used resource pooling, a 15% increase from 2019.
Rapid elasticity
Capabilities can be elastically provisioned and released to rapidly scale outward or inward with demand. Consumer capabilities available for provisioning appear to be unlimited and can be appropriated in any quantity at any time.
77% of respondents used rapid elasticity, a 18% increase from 2019.
Measured service
Cloud systems automatically control and optimize resource use by leveraging a metering capability at a level of abstraction appropriate to the type of service, such as storage, processing, bandwidth, and active user accounts. Resource usage can be monitored, controlled, and reported for transparency.
78% of respondents used measured service, a 16% increase from 2019.
SRE and DevOps
While the DevOps community was emerging at public conferences and conversations, a like-minded movement was forming inside Google: site reliability engineering (SRE). SRE, and similar approaches, like the Facebook production engineering discipline, embrace many of the same goals and techniques that motivate DevOps. In 2016, SRE officially joined the public discourse when the first book4 on site reliability engineering was published. The movement has grown since then, and today a global community of SRE practitioners collaborates on practices for technical operations.
Perhaps inevitably, confusion arose. What’s the difference between SRE and DevOps? Do I need to choose one or the other? Which one is better? In truth, there’s no conflict here; SRE and DevOps are highly complementary, and our research demonstrates their alignment. SRE is a learning discipline that prioritizes cross-functional communication and psychological safety, the same values that are at the core of the performance-oriented generative culture typical of elite DevOps teams. Extending from its core principles, SRE provides practical techniques, including the service level indicator/service level objective (SLI/SLO) metrics framework. Just as the lean product framework specifies how to achieve the rapid customer feedback cycles supported by our research, the SRE framework offers definition on practices and tooling that can improve a team’s ability to consistently keep promises to their users.
In 2021, we broadened our inquiry into operations, expanding from an analysis of service availability into the more general category of reliability. This year’s survey introduced several items inspired by SRE practices, to assess the degree to which teams:
- Define reliability in terms of user-facing behavior
- Employ the SLI/SLO metrics framework to prioritize work according to error budgets
- Use automation to reduce manual work and disruptive alerts
- Define protocols and preparedness drills for incident response
- Incorporate reliability principles throughout the software delivery lifecycle (“shift left on reliability”)
In analyzing the results, we found evidence that teams who excel at these modern operational practices are 1.4 times more likely to report greater SDO performance, and 1.8 times more likely to report better business outcomes.
SRE practices have been adopted by a majority of teams in our study: 52% of respondents reported the use of these practices to some extent, although the depth of adoption varies substantially between teams. The data indicates that the use of these methods predicts greater reliability and greater overall SDO performance: SRE drives DevOps success.
Additionally, we found that a shared responsibility model of operations, reflected in the degree to which developers and operators are jointly empowered to contribute to reliability, also predicts better reliability outcomes.
Beyond improving objective measures of performance, SRE improves technical practitioners’ experience of work. Typically, individuals with a heavy load of operations tasks are prone to burnout, but SRE has a positive effect. We found that the more a team employs SRE practices, the less likely its members are to experience burnout. SRE might also help in optimizing resources: teams that meet their reliability targets through the application of SRE practices report that they spend more time writing code than teams that don’t practice SRE.
Our research reveals that teams at any level of SDO performance—from low through elite—are likely to see benefits from the increased use of SRE practices. The better a team’s performance is, the greater the likelihood that they employ modern modes of operations: elite performers are 2.1 times as likely to report the use of SRE practices as their low-performing counterparts. But even teams operating at the highest levels have room for growth: only 10% of elite respondents indicated that their teams have fully implemented every SRE practice we investigated. As SDO performance across industries continues to advance, each team’s approach to operations is a critical driver of ongoing DevOps improvement.
____________________________
4. Betsy Beyer et al., eds., Site Reliability Engineering (O’Reilly Media, 2016).
____________________________
Documentation and security
Documentation
This year, we looked at the quality of internal documentation, which is documentation—such as manuals, READMEs, and even code comments—for the services and applications that a team works on. We measured documentation quality by the degree to which the documentation:
- Helps readers accomplish their goals
- Is accurate, up-to-date, and comprehensive
- Is findable, well organized, and clear5
Recording and accessing information about internal systems is a critical part of a team’s technical work. We found that about 25% of respondents have good-quality documentation, and the impact of this documentation work is clear: teams with higher quality documentation are 2.4 times more likely to see better software delivery and operational (SDO) performance. Teams with good documentation deliver software faster and more reliably than those with poor documentation. Documentation doesn’t have to be perfect. Our research shows that any improvement in documentation quality has a positive and direct impact on performance.
Today’s tech environment has increasingly complex systems, as well as experts and specialized roles for different aspects of these systems. From security to testing, documentation is a key way to share specialized knowledge and guidance both between these specialized sub-teams and with the wider team.
We found that documentation quality predicts teams’ success at implementing technical practices. These practices in turn predict improvements to the system’s technical capabilities, such as observability, continuous testing, and deployment automation. We found that teams with quality documentation are:
- 3.8 times more likely to implement security practices
- 2.4 times more likely to meet or exceed their reliability targets
- 3.5 times more likely to implement site reliability engineering (SRE) practices
- 2.5 times more likely to fully leverage the cloud
How to improve documentation quality
Technical work involves finding and using information, but quality documentation relies on people writing and maintaining the content. In 2019, our research found that access to internal and external information sources supports productivity. This year’s research takes this investigation a step further to look at the quality of the documentation that is accessed, and at practices that have an impact on this documentation quality.
Our research shows the following practices have significant positive impact on documentation quality:
Document critical use cases for your products and services. What you document about a system is important, and use cases allow your readers to put the information, and your systems, to work.
Create clear guidelines for updating and editing existing documentation. Much of documentation work is maintaining existing content. When team members know how to make updates or remove inaccurate or out-of-date information, the team can maintain documentation quality even as the system changes over time.
Define owners. Teams with quality documentation are more likely to have clearly defined ownership of documentation. Ownership allows for explicit responsibilities for writing new content and updating or verifying changes to existing content. Teams with quality documentation are more likely to state that documentation is written for all major features of the applications they work on, and clear ownership helps create this broad coverage.
Include documentation as part of the software development process. Teams that created documentation and updated it as the system changed have higher quality documentation. Like testing, documentation creation and maintenance is an integral part of a high-performing software development process.
Recognize documentation work during performance reviews and promotions. Recognition is correlated with overall documentation quality. Writing and maintaining documentation is a core part of software engineering work, and treating it as such improves its quality.
Other resources that we found to support quality documentation include:
- Training on how to write and maintain documentation
- Automated testing for code samples or incomplete documentation
- Guidelines, such as documentation style guides and guides for writing for a global audience
Documentation is foundational for successfully implementing DevOps capabilities. Higher quality documentation amplifies the results of investments in individual DevOps capabilities like security, reliability, and fully leveraging the cloud. Implementing practices to support quality documentation pays off through stronger technical capabilities and higher SDO performance.
____________________________
5. Quality metrics informed by existing research on technical documentation, such as:
— Aghajani, E. et al. (2019). Software Documentation Issues Unveiled. Proceedings of the 2019 IEEE/ACM 41st International Conference on Software Engineering, 1199-1210. https://doi.org/10.1109/ICSE.2019.00122
— Plösch, R., Dautovic, A., & Saft, M. (2014). The Value of Software Documentation Quality. Proceedings of the International Conference on Quality Software, 333-342. https://doi.org/10.1109/QSIC.2014.22
— Zhi, J. et al. (2015). Cost benefits and quality of software development documentation: A systematic mapping. Journal of Systems and Software, 99(C), 175-198. https://doi.org/10.1016/j.jss.2014.09.042
____________________________
Security
[Shift left] and integrate throughout
As technology teams continue to accelerate and evolve, so do the quantity and sophistication of security threats. In 2020, more than 22 billion records of confidential personal information or business data were exposed, according to Tenable’s 2020 Threat Landscape Retrospective Report.6 Security can’t be an afterthought or the final step before delivery, it must be integrated throughout the software development process.
To securely deliver software, security practices must evolve faster than the techniques used by malicious actors. During the 2020 SolarWinds and Codecov software supply chain attacks, hackers compromised SolarWinds’s build system and Codecov’s bash uploader script7 to covertly embed themselves into the infrastructure of thousands of customers of those companies. Given the widespread impact of these attacks, the industry must shift from a preventive to a diagnostic approach, where software teams should assume that their systems are already compromised and build security into their supply chain.
Consistent with previous reports, we found that elite performers excel at implementing security practices. This year, elite performers who met or exceeded their reliability targets were twice as likely to have security integrated in their software development process. This suggests that teams who have accelerated delivery while maintaining their reliability standards have found a way to integrate security checks and practices without compromising their ability to deliver software quickly or reliably.
In addition to exhibiting high delivery and operational performance, teams who integrate security practices throughout their development process are 1.6 times more likely to meet or exceed their organizational goals. Development teams that embrace security see significant value driven to the business.
____________________________
6. https://www.tenable.com/cyber-exposure/2020-threat-landscape-retrospective
7. https://www.cybersecuritydive.com/news/codecov-breach-solarwinds-software-supply-chain/598950/
____________________________
How to get it right
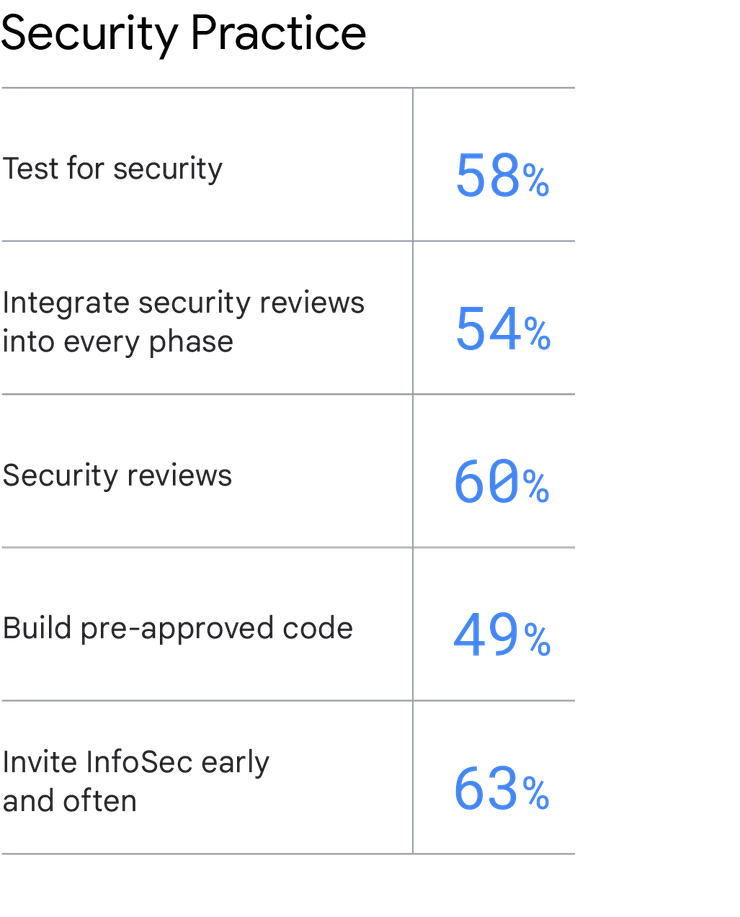
It’s easy to emphasize the importance of security and suggest that teams need to prioritize it, but doing so requires several changes from traditional information security methods. You can integrate security, improve software delivery and operational performance, and improve organizational performance by leveraging the following practices:
Test for security. Test security requirements as a part of the automated testing process, including areas where pre-approved code should be used.
Integrate security review into every phase. Integrate information security (InfoSec) into the daily work of the entire software delivery lifecycle. This includes having the InfoSec team provide input during the design and architecture phases of the application, attend software demos, and provide feedback during demos.
Security reviews. Conduct a security review for all major features. Build pre-approved code. Have the InfoSec team build pre-approved, easy-to-consume libraries, packages, toolchains, and processes for developers and IT operators to use in their work. Invite InfoSec early and often. Include InfoSec during planning and all subsequent phases of application development, so that they can spot security-related weaknesses early, which gives the team ample time to fix them.
Build pre-approved code. Have the InfoSec team build pre-approved, easy-to-consume libraries, packages, toolchains, and processes for developers and IT operators to use in their work.
Invite InfoSec early and often. Include InfoSec during planning and all subsequent phases of application development, so that they can spot security-related weaknesses early, which gives the team ample time to fix them.
As we’ve noted previously, high-quality documentation drives the success of a variety of capabilities and security is no exception. We found that teams with high-quality documentation were 3.8 times as likely to integrate security throughout their development process. Not everyone in an organization has expertise in cryptography. The expertise of those who do is best shared in an organization through documented security practices.
Technical DevOps capabilities
Our research shows that organizations who undergo a DevOps transformation by adopting continuous delivery are more likely to have processes that are high-quality, low-risk, and cost-effective.
Specifically, we measured the following technical practices:
- Loosely coupled architecture
- Trunk-based development
- Continuous testing
- Continuous integration
- Use of open source technologies
- Monitoring and observability practices
- Management of database changes
- Deployment automation
We found that while all of these practices improve continuous delivery, loosely coupled architecture and continuous testing have the greatest impact. For example, this year we found that elite performers who meet their reliability targets are three times more likely to employ a loosely coupled architecture than their low-performing counterparts.
Loosely coupled architecture
Our research continues to show that you can improve IT performance by working to reduce fine-grained dependencies between services and teams. In fact, this is one of the strongest predictors of successful continuous delivery. Using a loosely coupled architecture, teams can scale, fail, test, and deploy independently of one another. Teams can move at their own pace, work in smaller batches, accrue less technical debt, and recover faster from failure.
Continuous testing and continuous integration
Similar to our findings from previous years, we show that continuous testing is a strong predictor of successful continuous delivery. Elite performers who meet their reliability targets are 3.7 times more likely to leverage continuous testing. By incorporating early and frequent testing throughout the delivery process, with testers working alongside developers throughout, teams can iterate and make changes to their product, service, or application more quickly. You can use this feedback loop to deliver value to your customers while also easily incorporating practices like automated testing and continuous integration.
Continuous integration also improves continuous delivery. Elite performers who meet their reliability targets are 5.8 times more likely to leverage continuous integration. In continuous integration, each commit triggers a build of the software and runs a series of automated tests that provide feedback in a few minutes. With continuous integration, you decrease the manual and often complex coordination needed for a successful integration.
Continuous integration, as defined by Kent Beck and the Extreme Programming community, where it originated, also includes the practice of trunk-based development, discussed next.7
Trunk-based development
Our research has consistently shown that high-performing organizations are more likely to have implemented trunk-based development, in which developers work in small batches and merge their work into a shared trunk frequently. In fact, elite performers who meet their reliability targets are 2.3 times more likely to use trunk-based development. Low performers are more likely to use long-lived branches and to delay merging.
Teams should merge their work at least once a day—multiple times a day if possible. Trunk-based development is closely related to continuous integration, so you should implement these two technical practices concurrently, because they have more impact when you use them together.
Deployment automation
In ideal work environments, computers perform repetitive tasks while humans focus on solving problems. Implementing deployment automation helps your teams get closer to this goal.
When you move software from testing to production in an automated way, you decrease lead time by enabling faster and more efficient deployments. You also reduce the likelihood of deployment errors, which are more common in manual deployments. When your teams use deployment automation, they receive immediate feedback, which can help you improve your service or product at a much faster rate. While you don’t have to implement continuous testing, continuous integration, and automated deployments simultaneously, you are likely to see greater improvements when you use these three practices together.
Database change management
Tracking changes through version control is a crucial part of writing and maintaining code, and for managing databases. Our research found that elite performers who meet their reliability targets are 3.4 times more likely to exercise database change management compared to their low-performing counterparts. Furthermore, the keys to successful database change management are collaboration, communication, and transparency across all relevant teams. While you can choose from among specific approaches to implement, we recommend that whenever you need to make changes to your database, teams should get together and review the changes before you update the database.
____________________________
8. Beck, K. (2000). Extreme programming explained: Embrace change. Addison-Wesley Professional
____________________________
Monitoring and observability
As with previous years, we found that monitoring and observability practices support continuous delivery. Elite performers who successfully meet their reliability targets are 4.1 times more likely to have solutions that incorporate observability into overall system health. Observability practices give your teams a better understanding of your systems, which decreases the time it takes to identify and troubleshoot issues. Our research also indicates that teams with good observability practices spend more time coding. One possible explanation for this finding is that implementing observability practices helps shift developer time away from searching for causes of issues toward troubleshooting and eventually back to coding.
Open source technologies
Many developers already leverage open source technologies, and their familiarity with these tools is a strength for the organization. A primary weakness of closed source technologies is that they limit your ability to transfer knowledge in and out of the organization. For instance, you cannot hire someone who is already familiar with your organization’s tools, and developers cannot transfer the knowledge they have accumulated to other organizations. In contrast, most open source technologies have a community around them that developers can use for support. Open source technologies are more widely accessible, relatively low cost, and customizable. Elite performers who meet their reliability targets are 2.4 times more likely to leverage open source technologies. We recommend that you shift to using more open source software as you implement your DevOps transformation.
For more information about technical DevOps capabilities, see DORA capabilities at https://cloud.google.com/devops/capabilities
COVID-19 and culture
COVID-19
This year we investigated the factors that influenced how teams performed during the COVID-19 pandemic. Specifically, has the COVID-19 pandemic negatively impacted software delivery and operational (SDO) performance? Do teams experience more burnout as a result? Finally, what factors are promising for mitigating burnout?
First, we sought to understand the impact the pandemic had on delivery and operational performance. Many organizations prioritized modernization to accommodate dramatic market changes (for example, the shift from purchasing in-person to online). In the “How do we compare?” chapter, we discuss how performance in the software industry has accelerated significantly and continues to accelerate. Higher performing teams are now the majority of our sample, and elite performers continue to raise the bar, deploying more often with shorter lead times, faster recovery times, and better change failure rates. Similarly, a study by GitHub researchers showed an increase in developer activity (that is, pushes, pull requests, reviewed pull requests, and commented issues per user9) through the year 2020. Arguably, the industry has continued to accelerate despite the pandemic, rather than because of it, but it’s noteworthy that we did not see a downward trend in SDO performance during this dire period.
The pandemic changed how we work, and for many it changed where we work. For this reason, we look at the impact of working remotely as a result of the pandemic. We found that 89% of respondents worked from home due to the pandemic. Only 20% reported having ever worked from home prior to the pandemic. Shifting to a remote work environment had significant implications for how we develop software, run business, and work together. For many, working from home eliminated the ability to connect through impromptu hallway conversations or collaborate in person.
____________________________
9. https://octoverse.github.com/
____________________________
What reduced burnout?
Despite this, we did find a factor that had a large effect on whether or not a team struggled with burnout as a result of working remotely: culture. Teams with a generative team culture, composed of people who felt included and like they belonged on their team, were half as likely to experience burnout during the pandemic. This finding reinforces the importance of prioritizing team and culture. Teams that do better are equipped to weather more challenging periods that put pressure on both the team as well as on individuals.
Culture
Broadly speaking, culture is the inescapable interpersonal undercurrent of every organization. It is anything that influences how employees think, feel, and behave towards the organization and one another. All organizations have their own unique culture, and our findings consistently show that culture is one of the top drivers of organizational and IT performance. Specifically, our analyses indicate that a generative culture—measured using the Westrum organizational culture typology, and people’s sense of belonging and inclusion within the organization—predicts higher software delivery and operational (SDO) performance. For example, we find that elite performers that meet their reliability targets are 2.9 times more likely to have a generative team culture than their low-performing counterparts. Similarly, a generative culture predicts higher organizational performance and lower rates of employee burnout. In short, culture really matters. Fortunately, culture is fluid, multifaceted, and always in flux, making it something you can change.
The successful execution of DevOps requires your organization to have teams that work collaboratively and cross-functionally. In 2018 we found that high-performing teams were twice as likely to develop and deliver software in a single, cross-functional team. This reinforces that collaboration and cooperation are paramount to the success of any organization. One key question is: what factors contribute to creating an environment that encourages and celebrates cross-functional collaboration?
Over the years, we have tried to make the construct of culture tangible and to provide the DevOps community with a better understanding of the impact of culture on organizational and IT performance. We began this journey by operationally defining culture using Westrum’s organizational culture typology. He identified three types of organizations: power-oriented, rule-oriented, and performance-oriented. We used this framework in our own research and found that a performance-oriented organizational culture that optimizes for information flow, trust, innovation, and risk-sharing is predictive of high SDO performance.
As our understanding of culture and DevOps evolves, we have worked to expand our initial definition of culture to include other psycho-social factors such as psychological safety. High-performing organizations are more likely to have a culture that encourages employees to take calculated and moderate risks without fear of negative consequences.
Belonging and inclusion
Given the consistently strong impact culture has on performance, this year we expanded our model to explore whether employees’ sense of belonging and inclusion contribute to the beneficial effect of culture on performance.
Psychological research has shown that people are inherently motivated to form and maintain strong and stable relationships with others.10 We are motivated to feel connected to others and to feel accepted within the various groups we inhabit. Feelings of belonging lead to a wide range of favorable physical and psychological outcomes. For example, research indicates that feelings of belonging positively impact motivation and lead to improvements in academic achievement.11
A component of this sense of connectedness is the idea that people should feel comfortable bringing their whole self to work and that their unique experiences and background are valued and celebrated.12 Focusing on creating inclusive cultures of belonging within organizations helps create a thriving, diverse, and motivated workforce.
Our results indicate that performance-oriented organizations that value belonging and inclusion are more likely to have lower levels of employee burnout compared to organizations with less positive organizational cultures.
Given the evidence showing how psycho-social factors affect SDO performance and levels of burnout among employees, we recommend that if you’re seeking to go through a successful DevOps transformation, you invest in addressing culture-related issues as part of your transformation efforts.
____________________________
10. Baumeister & Leary, 1995. The need to belong: Desire for interpersonal attachments as a fundamental human motivation. Psychological Bulletin, 117(3), 497–529. https://doi.org/10.1037/0033-2909.117.3.497
11. Walton et al., 2012. Mere belonging: the power of social connections. Journal of Personality and Social Psychology, 102(3):513-32. https://doi.org/10.1037/a0025731
12. Mor Barak & Daya, 2014; Managing diversity: Toward a globally inclusive workplace. Sage. Shore, Cleveland, & Sanchez, 2018; Inclusive workplaces: A review and model, Human Resources Review. https://doi.org/10.1016/j.hrmr.2017.07.003
Who took the survey?
With seven years of research and more than 32,000 survey responses from industry professionals, the Accelerate State of DevOps 2021 showcases the software development and DevOps practices that make teams and organizations most successful.
This year, 1,200 working professionals from a variety of industries around the globe shared their experiences to help grow our understanding of the factors that drive higher performance. In summary, representation across demographic and firmographic measures has remained remarkably consistent.
Similar to previous years, we collected demographic information from each survey respondent. Categories include gender, disability, and underrepresented groups.
Demographics and firmographics
This year we saw representation that was consistent with previous reports across firmographic categories including company size, industry, and region. Again, over 60% of respondents work as engineers or managers and a third work in the technology industry. Additionally, we see industry representation from financial services, retail, and industrial/manufacturing companies.
____________________________
13. https://www.washingtongroup-disability.com/question-sets/wg-short-set-on-functioning-wg-ss/
____________________________
Demographic
Gender
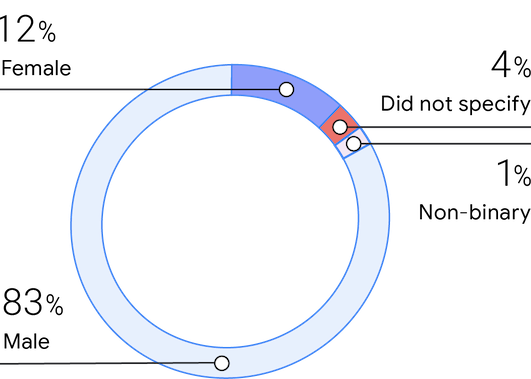
Consistent with previous surveys, this year’s sample consists of 83% men, 12% women, and 1% non-binary. Respondents stated that women make up about 25% of their teams, which is a large increase from 2019 (16%) and again aligned with 2018 (25%).
Disability
Disability is identified along six dimensions that follow guidance from the Washington Group Short Set.13 This is the third year we have asked about disability. The percentage of people with disabilities was consistent with our 2019 report at 9%.
Underrepresented groups
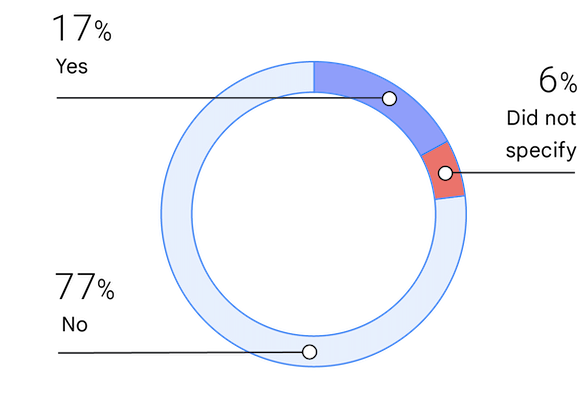
Identifying as a member of an underrepresented group can refer to race, gender, or another characteristic. This is the fourth year we have asked about underrepresentation. The percentage of people who identify as underrepresented has increased slightly from 13.7% in 2019 to 17% in 2021.
Years of experience
Respondents from this year’s survey are highly experienced, with 41% having at least 16 years of experience. More than 85% of our respondents had at least 6 years of experience.
Firmographics
Departments
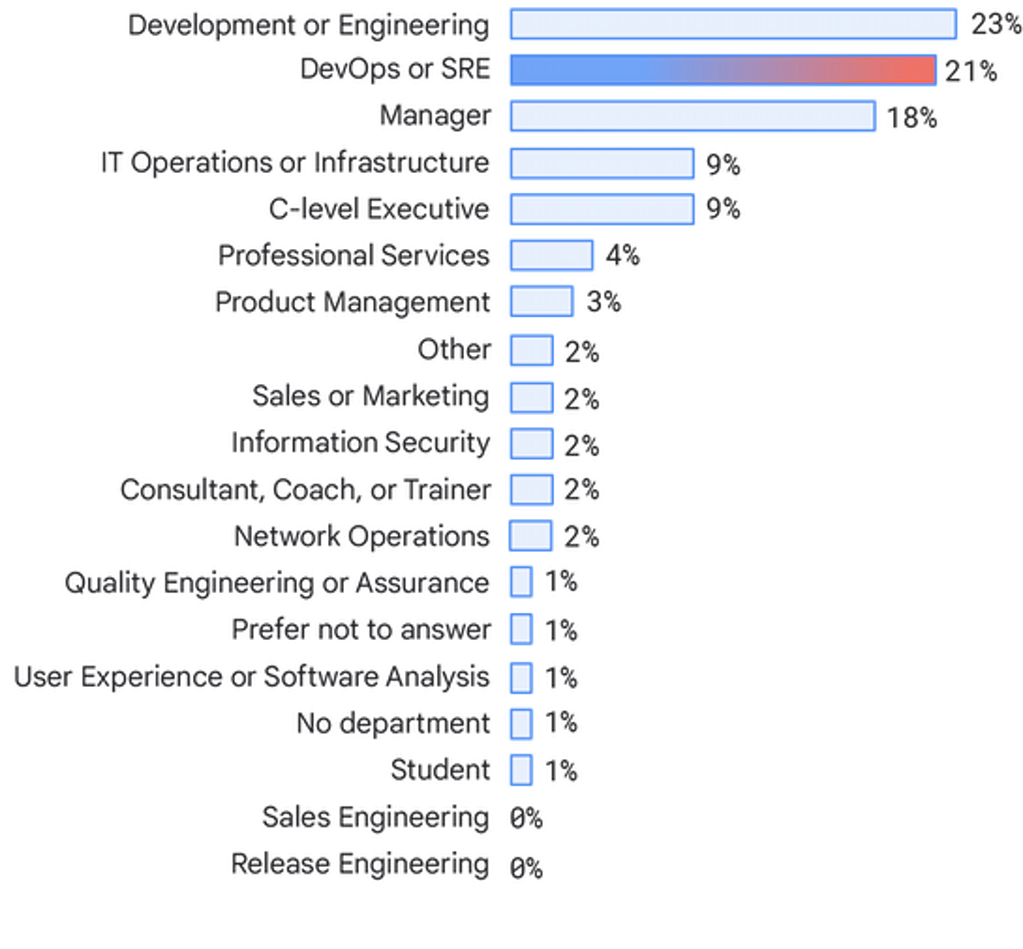
Respondents largely consist of individuals who work on development or engineering teams (23%), DevOps or SRE teams (21%), managers (18%), and IT ops or infrastructure teams (9%). We saw a decrease in representation from consultants (4% in 2019 to 2%), and an increase in C-level executives (4% in 2019 to 9%).
Industry
As in previous Accelerate State of DevOps reports, we see that most respondents work in the technology industry, followed by financial services, retail, and other.
Employees
Consistent with previous Accelerate State of DevOps reports, respondents come from a variety of organization sizes. 22% of respondents are at companies with more than 10,000 employees and 7% are at companies with 5,000–9,999 employees. Another 15% of respondents are at organizations with 2,000–4,999 employees. We also saw a fair representation of respondents from organizations with 500–1,999 employees at 13%, 100–499 employees at 15%, and finally 20–99 employees at 15%.
Team size
Over half of respondents (62%) work on teams with 10 or fewer members (28% for 6–10, 27% for 2–5, and 6% for single person teams). Another 19% work on teams with 11–20 members.
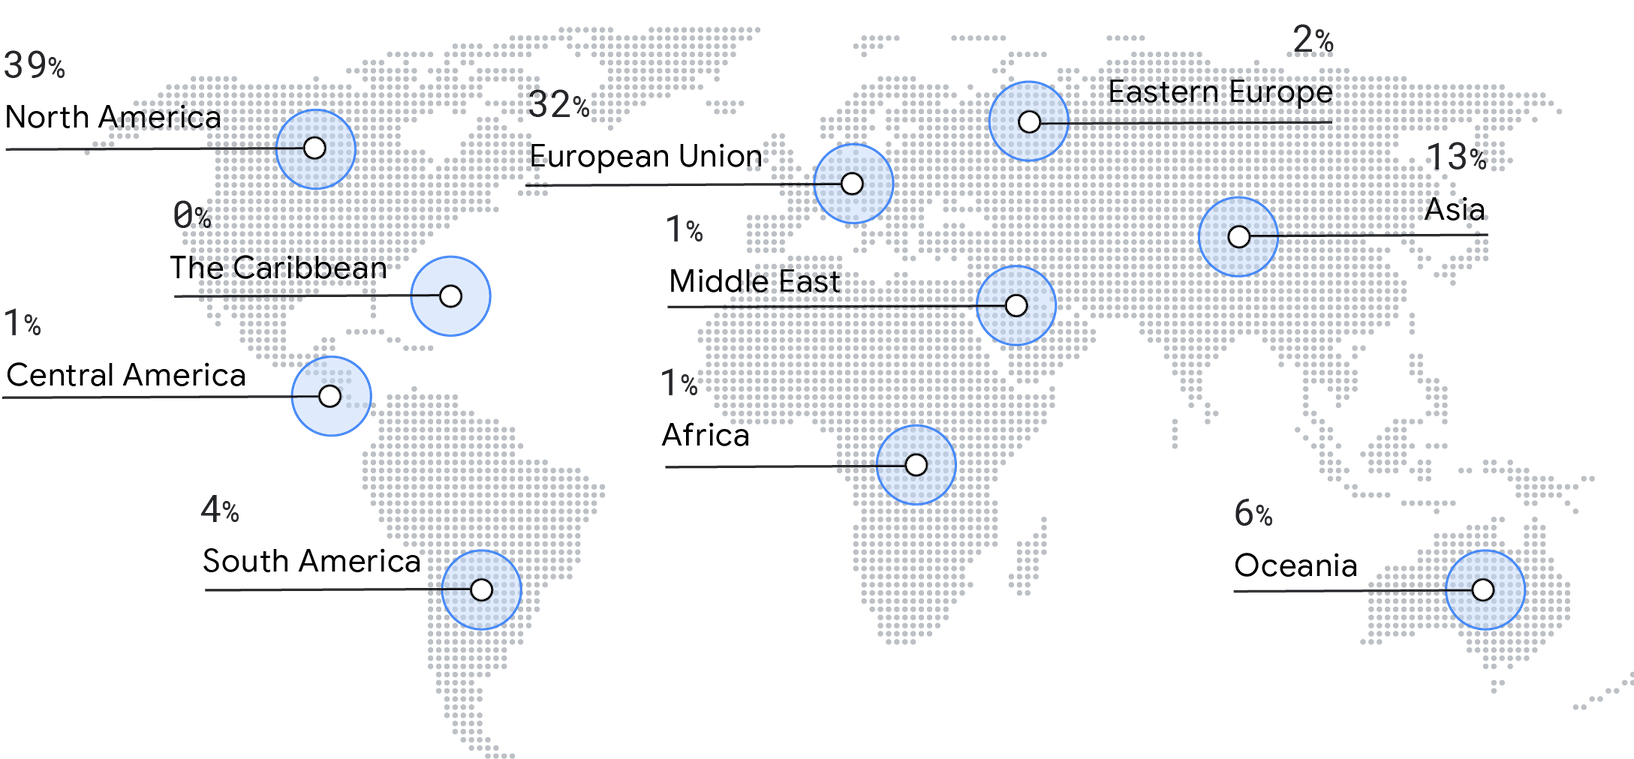
Regions
This year’s survey saw a decrease in responses from North America (50% in 2019 to 39% in 2021). Instead we saw an increase in representation from Europe (29% in 2019 to 32% in 2021), Asia (9% in 2019 to 13% in 2021), Oceania (4% in 2019 to 6% in 2021), and South America (2% in 2019 to 4% in 2021).
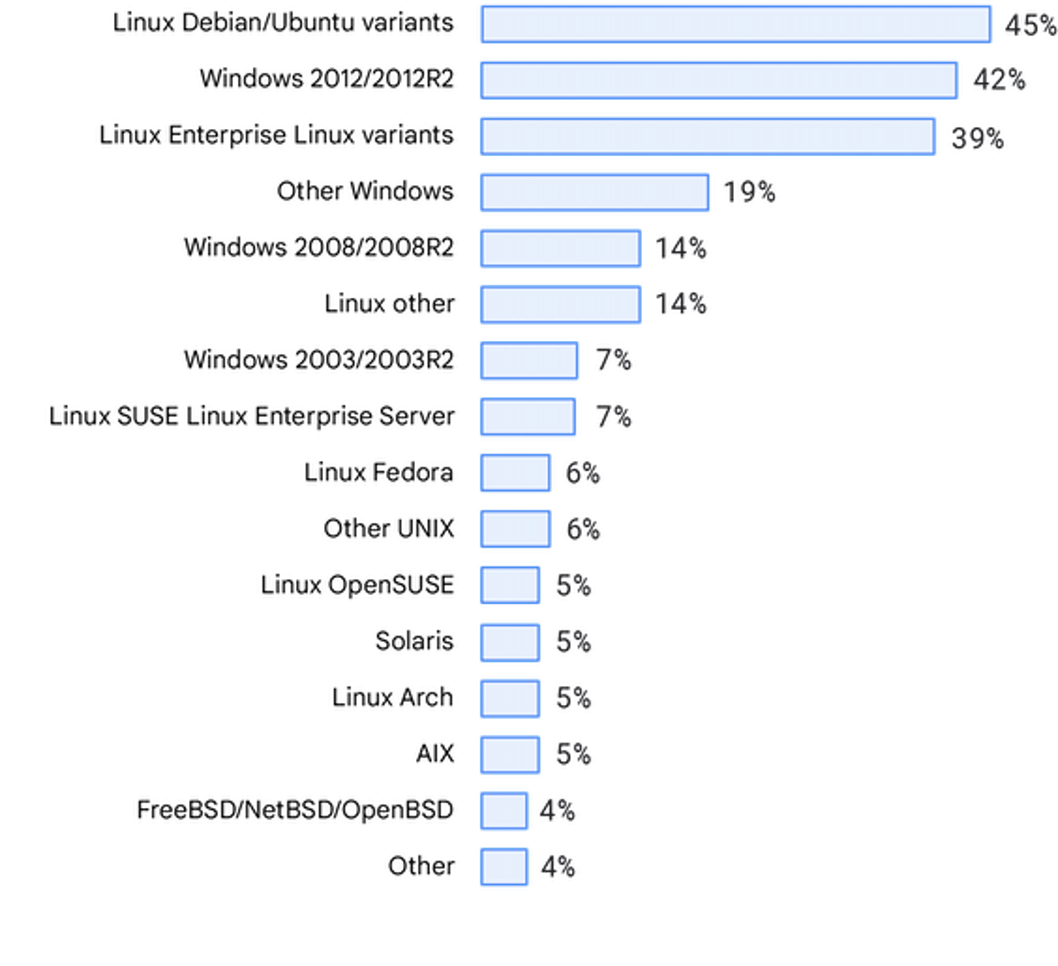
Operating systems
The distribution of operating systems was consistent with previous State of DevOps reports as well. We also acknowledge and thank the respondents who helped highlight that our list of operating systems could use an update.
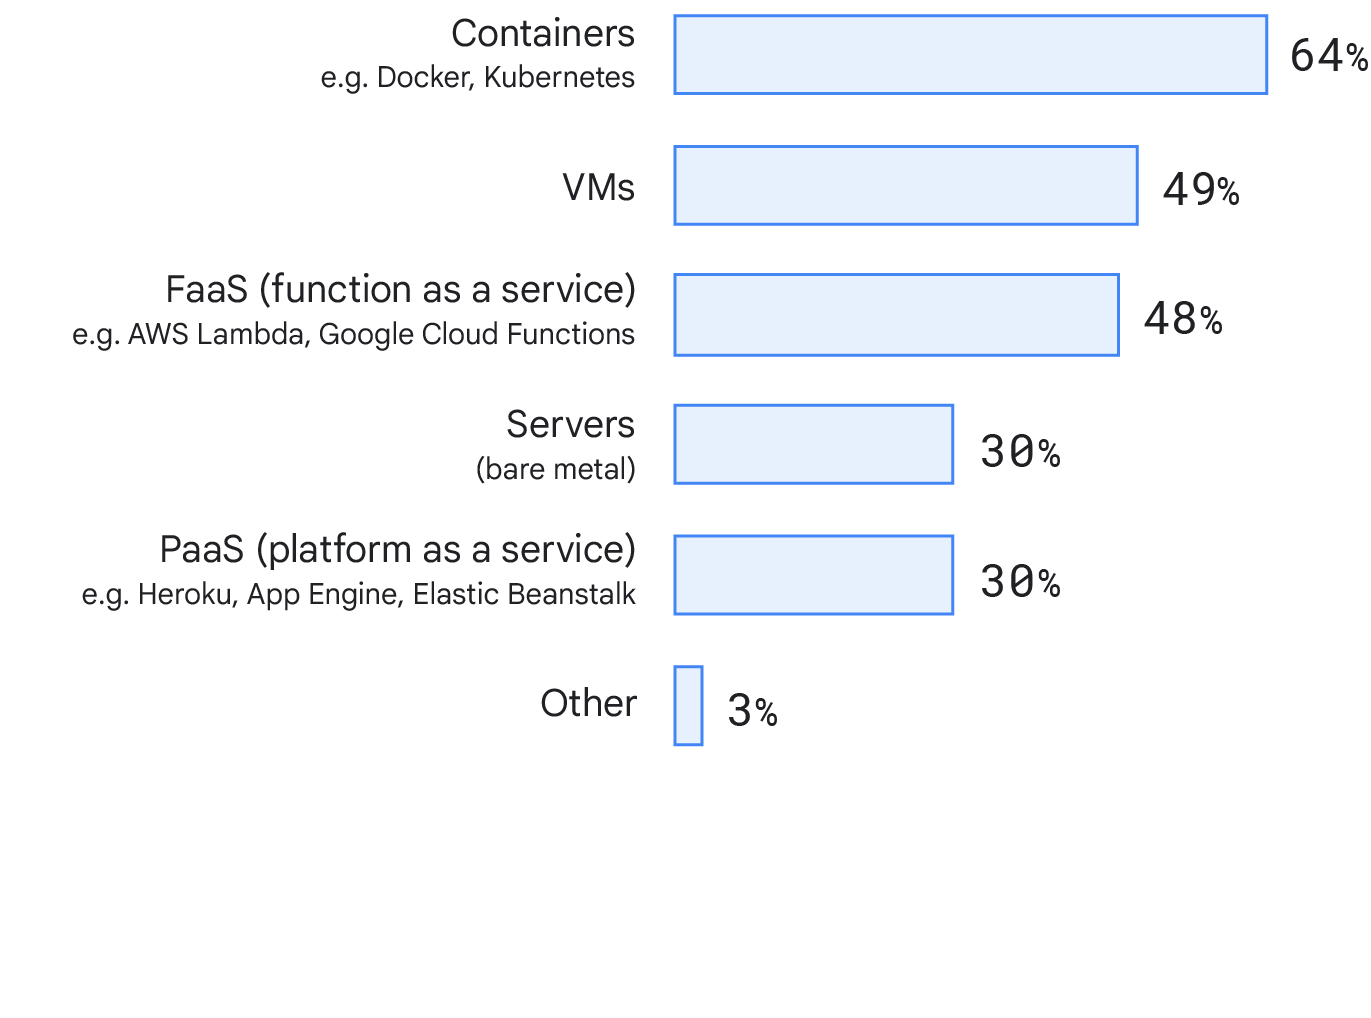
Deployment target
This year we looked at where respondents deploy the primary service or application they work on. To our surprise, a large proportion of respondents use containers (64%), with 48% using virtual machines (VMs). This might reflect a shift in the industry toward more modern deployment target technologies. We checked for differences between different company sizes and did not find significant differences between deployment targets.
Final thoughts
After seven years of research, we continue to see the benefits that DevOps brings to organizations. Year over year organizations continue to accelerate and improve.
Teams that embrace its principles and capabilities can deliver software quickly and reliably, all while driving value directly to the business. This year we investigated the effects of SRE practices, a secure software supply chain, quality documentation, and we revisited our exploration of leveraging the cloud. Each area enables people and teams to be more effective. We focus on the importance of structuring solutions that fit the people leveraging these capabilities, not fitting the people to the solution.
We thank everyone who contributed to this year’s survey, and hope our research helps you and your organization build better teams and better software—while also maintaining work-life balance.
Acknowledgements
This year’s report was made possible by a large family of passionate contributors. Survey question design, analysis, writing, editing, and report design are just a few of the ways that our colleagues helped to realize this large effort. The authors would like to thank all of these people for their input and guidance on the report this year. All acknowledgements are listed alphabetically.

Authors
Dustin Smith
Dustin Smith is a human factors psychologist and staff user experience research manager at Google and he has worked on the DORA project for three years. For the past seven years, he has studied how people are affected by the systems and environments around them in a variety of contexts: software engineering, free-to-play gaming, healthcare, and military. His research at Google identifies areas where software developers can feel happier and more productive during development. He has worked on the DORA project for two years. Dustin received his PhD in Human Factors Psychology from Wichita State University.
Daniella Villalba
Daniella Villalba is a user experience researcher dedicated to the DORA project. She focuses on understanding the factors that make developers happy and productive. Before Google, Daniella studied the benefits of meditation training, the psycho-social factors that affect the experiences of college students, eyewitness memory, and false confessions. She received her PhD in Experimental Psychology from Florida International University.
Michelle Irvine
Michelle Irvine is a technical writer at Google, where she works to bridge the gap between developer tools and the people who use them. Before Google, she worked in educational publishing and as a technical writer for physics simulation software. Michelle has a BSc in Physics, as well as an MA in Rhetoric and Communication Design from the University of Waterloo.
Dave Stanke
Dave Stanke is a developer relations engineer at Google, where he advises customers on practices for adopting DevOps and SRE. Throughout his career, he has worn all the hats, including startup CTO, product manager, customer support, software developer, sysadmin, and graphic designer. He holds an MS in Technology Management from Columbia University.
Nathen Harvey
Nathen Harvey is a developer relations engineer at Google who has built a career on helping teams realize their potential while aligning technology to business outcomes. Nathen has had the privilege of working with some of the best teams and open source communities, helping them apply the principles and practices of DevOps and SRE. Nathen co-edited and contributed to “97 Things Every Cloud Engineer Should Know,” O’Reilly 2020.
Methodology
Research design
This study employs a cross-sectional, theory-based design. This theory-based design is known as inferential predictive, and is one of the most common types conducted in business and technology research today. Inferential design is used when purely experimental design is not possible and field experiments are preferred.
Target population and sampling
Our target population for this survey was practitioners and leaders working in, or closely with, technology and transformations and especially those familiar with DevOps. We promoted the survey via email lists, online promotions, an online panel, social media, and asked people to share the survey with their networks (that is, snowball sampling).
Creating latent constructs
We formulated our hypotheses and constructs using previously validated constructs wherever possible. We developed new constructs based on theory, definitions, and expert input. We then took additional steps to clarify intent to ensure that data collected from the survey had a high likelihood of being reliable and valid.14
Statistical analysis methods
Cluster analysis. We used cluster analysis to identify our software delivery performance profiles based on deployment frequency, lead time, time to restore service, and change failure rate. We used a latent class analysis15 because we did not have any industry or theoretical reasons to have a predetermined number of clusters, and we used Bayesian information criterion16 to determine the optimal number of clusters.
Measurement model. Prior to conducting analysis, we identified constructs using exploratory factor analysis with principal component analysis using varimax rotation.17 We confirmed statistical tests for convergent and divergent validity and reliability using average variance extracted (AVE), correlation, Cronbach’s alpha,18 and composite reliability.
Structural equation modeling. We tested the structural equation models (SEM) using Partial Least Squares (PLS) analysis, which is a correlation-based SEM.19
________________________
14. Churchill Jr, G. A. “A paradigm for developing better measures of marketing constructs,” Journal of Marketing Research 16:1, (1979), 64–73.
15. Hagenaars, J. A., & McCutcheon, A. L. (Eds.). (2002). Applied latent class analysis. Cambridge University Press.
16. Vrieze, S. I. (2012). Model selection and psychological theory: a discussion of the differences between the Akaike information criterion (AIC) and the Bayesian information criterion (BIC). Psychological methods, 17(2), 228.
17. Straub, D., Boudreau, M. C., & Gefen, D. (2004). Validation guidelines for IS positivist research. Communications of the Association for Information systems, 13(1), 24.
18. Nunnally, J.C. Psychometric Theory. New York: McGraw-Hill, 1978
19. Hair Jr, J. F., Hult, G. T. M., Ringle, C. M., & Sarstedt, M. (2021). “A primer on partial least squares structural equation modeling (PLS-SEM).” Sage publications
Further reading
Find more information on DevOps capabilities at https://cloud.google.com/devops/capabilities
Find resources on site reliability engineering (SRE) at
Take the DevOps Quick Check:
https://www.devops-research.com/quickcheck.html
Explore the DevOps research program:
https://www.devops-research.com/research.html
Find out about the Google Cloud Application Modernization Program:
https://cloud.google.com/solutions/camp
Read the “The ROI of DevOps Transformation: How to quantify the impact of your modernization initiatives” whitepaper:
https://cloud.google.com/resources/roi-of-devops-transformation-whitepaper
See prior State of DevOps reports:
State of DevOps 2014: https://services.google.com/fh/files/misc/state-of-devops-2014.pdf
State of DevOps 2015: https://services.google.com/fh/files/misc/state-of-devops-2015.pdf
State of DevOps 2016: https://services.google.com/fh/files/misc/state-of-devops-2016.pdf
State of DevOps 2017: https://services.google.com/fh/files/misc/state-of-devops-2017.pdf
Accelerate State of DevOps 2018: https://services.google.com/fh/files/misc/state-of-devops-2018.pdf
Accelerate State of DevOps 2019:
https://services.google.com/fh/files/misc/state-of-devops-2019.pdf
Ready to begin your data-driven transformation?
Explore our approach to building a data cloud that will optimize for speed, scale, and security. View here